

Key Insights
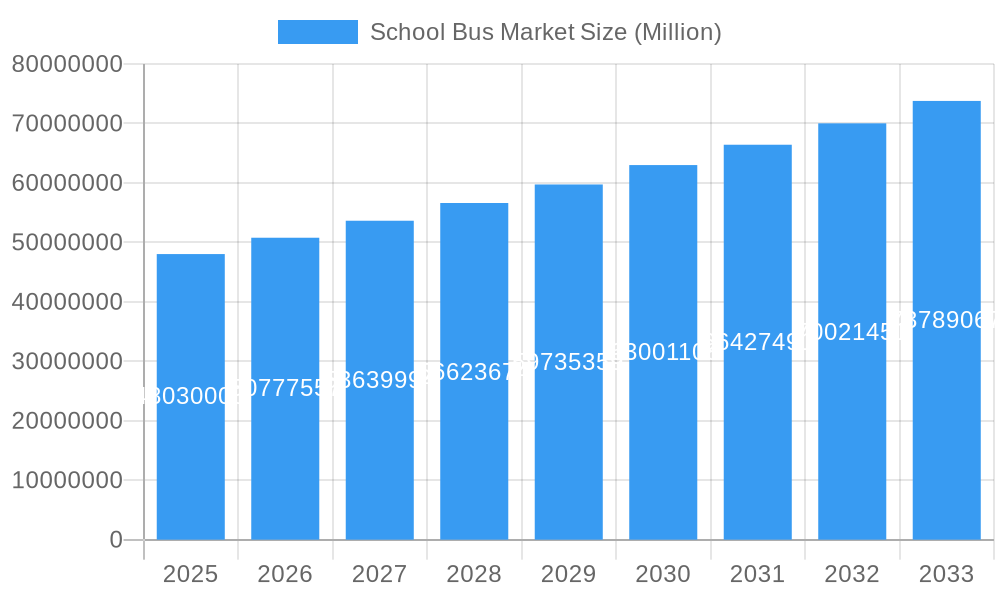
The global School Bus Market is poised for significant expansion, projected to reach $48.03 million by 2025, with a robust Compound Annual Growth Rate (CAGR) of 5.69% during the forecast period of 2025-2033. This growth is primarily fueled by an increasing emphasis on student safety and well-being, leading to greater demand for modern and compliant school transportation solutions. Government initiatives aimed at improving school bus fleets and the continuous technological advancements in propulsion systems, particularly the rising adoption of electric and hybrid models, are also key drivers. The market is witnessing a discernible shift towards more sustainable and emission-free transportation, aligning with global environmental goals and creating new opportunities for manufacturers.
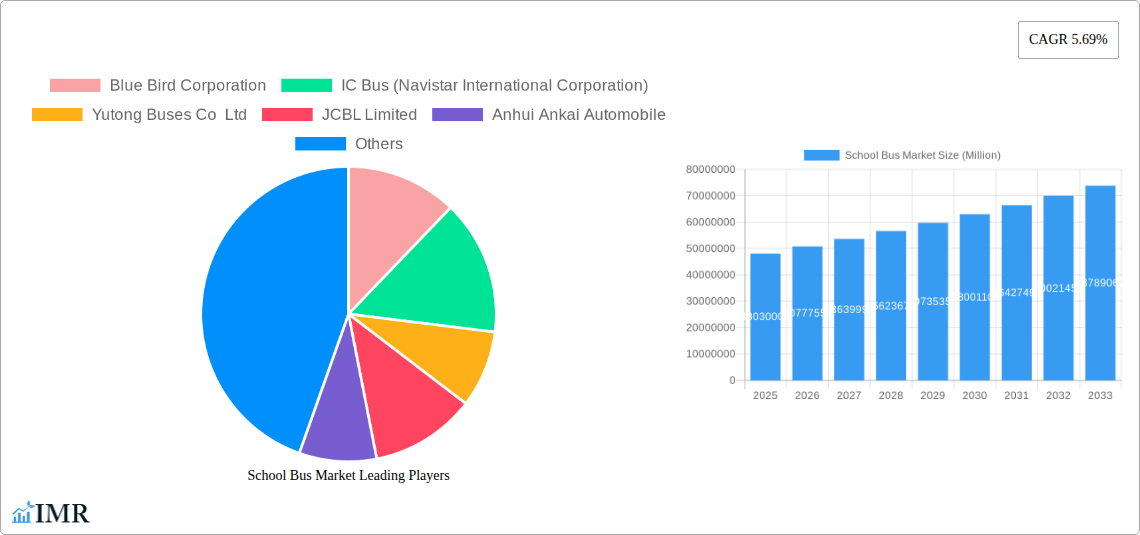
School Bus Market Market Size (In Million)
The market segmentation highlights the diverse landscape of the school bus industry. The Internal Combustion Engine (ICE) segment, while established, is seeing a gradual transition towards Electric and Hybrid propulsion types, driven by increasing environmental regulations and operational cost benefits in the long run. Capacity design types, ranging from Type A to Type D, cater to varying passenger needs and operational contexts, ensuring flexibility for diverse educational institutions. Geographically, North America and Europe are expected to remain dominant regions due to established regulatory frameworks and proactive adoption of advanced technologies. However, the Asia Pacific region presents substantial growth potential, driven by increasing student populations and government investments in education infrastructure. Key companies like Blue Bird Corporation, IC Bus, and Yutong Buses are at the forefront, innovating and expanding their offerings to capture market share in this evolving sector.
School Bus Market Company Market Share
School Bus Market: Comprehensive Analysis & Future Outlook (2019-2033) - Electric & ICE Propulsion, Type A-D Capacity, Global & Regional Trends
This in-depth report offers a definitive analysis of the global school bus market, covering the period from 2019 to 2033, with a base year of 2025. We provide critical insights into electric school buses, ICE school buses, and hybrid school bus adoption, examining the growth of Type A school bus, Type B school bus, Type C school bus, and Type D school bus segments. With a focus on market dynamics, growth trends, regional dominance, product landscapes, key drivers, barriers, opportunities, and future outlook, this report is an essential resource for industry professionals, investors, and policymakers seeking to understand the evolving student transportation market. The report meticulously analyzes market share, CAGR, and penetration rates, presenting all values in million units for clear quantitative understanding.
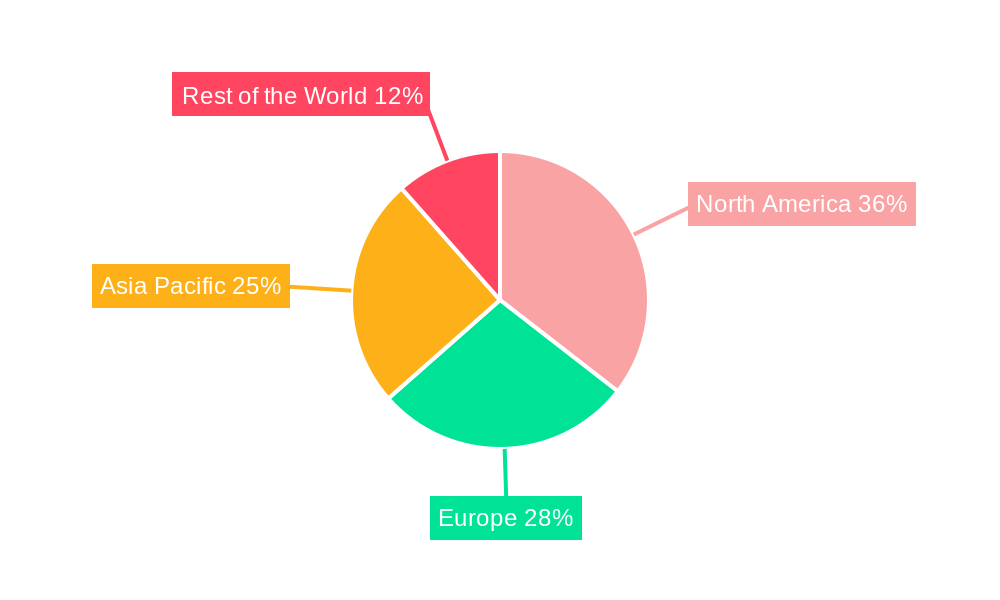
School Bus Market Regional Market Share
School Bus Market Market Dynamics & Structure
The school bus market exhibits a moderately consolidated structure, with leading manufacturers like Blue Bird Corporation, IC Bus (Navistar International Corporation), and Yutong Buses Co Ltd holding significant market shares. Technological innovation, particularly the rapid advancement and adoption of electric school buses, is a primary driver shaping market dynamics. Government regulations, including emissions standards and incentives for zero-emission vehicles, play a crucial role in steering market direction. Competitive product substitutes, such as public transportation and ride-sharing services, pose a minor challenge, as school bus services remain a mandated and specialized form of student transportation. End-user demographics, primarily school districts and private transportation providers, dictate demand patterns, with a growing emphasis on safety, cost-effectiveness, and environmental sustainability. Mergers and acquisitions (M&A) are an emerging trend, reflecting consolidation efforts and strategic partnerships aimed at expanding product portfolios and market reach. The market is projected to witness increased M&A activity as companies seek to capitalize on the transition to electric mobility.
- Market Concentration: Moderately consolidated with key players dominating specific regions and product segments.
- Technological Innovation Drivers: Development and deployment of electric school bus technology, improved battery range, and charging infrastructure.
- Regulatory Frameworks: Stringent emissions standards (e.g., EPA regulations) and government incentives for electric and low-emission vehicles.
- Competitive Product Substitutes: Limited direct substitutes for dedicated school bus services, with a focus on enhancing existing bus fleet efficiency and safety.
- End-User Demographics: School districts, private bus operators, and government agencies prioritizing safety, cost, and environmental impact.
- M&A Trends: Increasing consolidation to gain competitive advantage and expand market presence, particularly in the EV segment.
School Bus Market Growth Trends & Insights
The school bus market is poised for significant expansion, driven by a confluence of factors including escalating demand for safe and reliable student transportation, and a strong push towards sustainability and emission reduction. The market size is projected to witness a Compound Annual Growth Rate (CAGR) of approximately 6.8% from the base year 2025, reaching an estimated XX million units by 2033. This growth is fueled by the increasing adoption of electric school buses, which are gaining traction due to favorable government policies, declining battery costs, and growing environmental awareness. The penetration of electric vehicles within the school bus fleet is expected to surge, presenting a substantial shift from traditional Internal Combustion Engine (ICE) buses. Technological disruptions, such as advancements in battery technology, vehicle-to-grid (V2G) capabilities, and autonomous driving features, are poised to revolutionize the school bus industry. Consumer behavior is also shifting, with school districts prioritizing zero-emission solutions for their fleets to meet sustainability goals and improve air quality in communities. The demand for larger capacity Type C school bus and Type D school bus models continues to be robust, catering to the needs of larger student populations. However, the growth trajectory is also influenced by the development and adoption of smaller, more versatile Type A school bus and Type B school bus for specialized routes and smaller districts. The interplay between evolving regulatory landscapes, technological innovations, and the economic viability of alternative propulsion systems will dictate the pace and scale of market evolution.
Dominant Regions, Countries, or Segments in School Bus Market
The school bus market is experiencing dynamic growth across various regions and segments, with North America emerging as a dominant force, particularly in the adoption of electric school buses. The United States, a key market within North America, is a significant driver of growth due to its extensive school transportation infrastructure and proactive government initiatives promoting the transition to zero-emission fleets. Federal and state-level incentives, alongside stringent environmental regulations, are accelerating the deployment of Type A all-electric school bus and Type D electric school bus models.
Propulsion Type:
- Electric and Hybrid: This segment is projected to witness the highest growth rate, driven by environmental regulations and technological advancements. The demand for zero-emission transportation is pushing school districts to invest in electric and hybrid fleets.
- Internal Combustion Engine (ICE): While still dominant in terms of current fleet numbers, ICE propulsion is expected to see a gradual decline in market share as electric alternatives become more accessible and cost-effective.
Capacity Design Type:
- Type C: This segment, representing traditional full-size school buses, continues to hold a significant market share due to its capacity and proven reliability for transporting large numbers of students.
- Type D: Similar to Type C, Type D buses also cater to high-capacity needs and are crucial for densely populated areas.
- Type A: The Type A school bus segment is experiencing rapid growth due to its flexibility, maneuverability, and suitability for smaller student populations or specialized routes. The increasing availability of electric variants in this category is further boosting its market penetration.
- Type B: While less dominant than Type A, C, or D, the Type B segment offers a niche solution for specific transportation needs.
The Asia-Pacific region is also showing substantial growth potential, driven by increasing investments in education infrastructure and a rising awareness of sustainable transportation solutions. Countries like China are making significant strides in the production and deployment of electric buses, including school variants. Europe is also actively pursuing greener transportation, with several countries implementing policies to encourage the adoption of electric school buses. The dominance of specific segments like Type A school bus for urban routes and Type C/D school bus for suburban and rural areas will be influenced by regional population densities and transportation infrastructure. The ongoing shift towards electrification is a universal trend, making the electric school bus market a key growth indicator globally.
School Bus Market Product Landscape
The school bus market is characterized by continuous product innovation focused on enhancing safety, efficiency, and environmental performance. Leading manufacturers are introducing advanced features such as improved passive and active safety systems, enhanced driver assistance technologies, and more robust battery management systems for electric school buses. The development of lightweight materials and aerodynamic designs contributes to improved fuel efficiency for ICE models and extended range for electric variants. Specific product innovations include the deployment of larger battery capacities for extended range electric buses and the integration of smart technology for fleet management and real-time tracking. The Type A school bus segment is seeing innovation in compact, maneuverable designs with zero-emission powertrains, while Type C and Type D school bus models are focusing on increased passenger capacity and enhanced safety features, particularly in electric iterations. The product landscape is increasingly defined by the pursuit of reliable, cost-effective, and sustainable student transportation solutions.
Key Drivers, Barriers & Challenges in School Bus Market
Key Drivers:
- Environmental Regulations & Sustainability Goals: Increasing government mandates and public pressure to reduce emissions are compelling school districts to adopt electric school buses and other low-emission alternatives.
- Technological Advancements: Improvements in battery technology, charging infrastructure, and vehicle efficiency are making electric school buses more viable and cost-effective.
- Total Cost of Ownership (TCO): While upfront costs for electric buses can be higher, lower fuel and maintenance expenses are driving a favorable TCO, particularly for large fleets.
- Safety Innovations: Continuous development in vehicle safety features, including advanced driver-assistance systems (ADAS), enhances the appeal of modern school buses across all segments.
Barriers & Challenges:
- High Upfront Cost of Electric Buses: The initial purchase price of electric school buses remains a significant hurdle for many school districts, especially those with limited budgets.
- Charging Infrastructure Development: The lack of widespread and accessible charging infrastructure, particularly in rural areas, poses a challenge for the widespread adoption of electric fleets.
- Range Anxiety: Concerns about the operational range of electric buses, especially in extreme weather conditions or for long routes, continue to be a factor.
- Supply Chain Constraints: Global supply chain issues, particularly for battery components, can impact production timelines and the availability of electric school buses.
- Training and Maintenance Expertise: The transition to electric vehicles requires specialized training for mechanics and drivers, which can be a logistical and financial challenge.
Emerging Opportunities in School Bus Market
Emerging opportunities in the school bus market lie in the burgeoning demand for electric school buses, particularly in underserved urban and suburban areas. The integration of advanced telematics and fleet management solutions offers opportunities for optimizing routes, enhancing safety, and improving operational efficiency. The development of vehicle-to-grid (V2G) technology presents a novel opportunity for school buses to contribute to grid stability while generating revenue for school districts. Furthermore, the increasing focus on personalized student transportation is driving demand for smaller, more adaptable Type A school bus models, opening avenues for specialized manufacturers. Partnerships between bus manufacturers, charging infrastructure providers, and utility companies are crucial for unlocking the full potential of the electric school bus ecosystem.
Growth Accelerators in the School Bus Market Industry
Growth accelerators in the school bus market are primarily driven by supportive government policies and incentives that promote the adoption of zero-emission school buses. Technological breakthroughs in battery density and charging speed are making electric vehicles increasingly practical for daily school transportation. Strategic partnerships between bus manufacturers, technology providers, and school districts are fostering innovation and facilitating smoother transitions to electric fleets. Market expansion strategies, including the development of new electric models tailored to specific regional needs and the establishment of robust service and maintenance networks, are also crucial growth catalysts. The increasing awareness among parents and communities about the health and environmental benefits of electric school buses is indirectly accelerating their adoption.
Key Players Shaping the School Bus Market Market
- Blue Bird Corporation
- IC Bus (Navistar International Corporation)
- Yutong Buses Co Ltd
- JCBL Limited
- Anhui Ankai Automobile
- Thomas Built Buses Inc
- Lion Electric Company
- Collins Bus Corporation
- Tata Motor
Notable Milestones in School Bus Market Sector
- Dec 2023: GreenPower Motor Company announced its first orders for the Type A all-electric, purpose-built, zero-emission Nano BEAST school bus for the New York market through its dealer Leonard Bus Sales.
- Oct 2023: GreenPower, a West Virginia-based electric bus maker, unveiled the Mega BEAST, a ramped-up version of the BEAST (“Battery Electric Automotive School Transportation”), its Type D electric school bus that has a 140-mile range. The new model will be manufactured at GreenPower’s facilities in both California and South Charleston, West Virginia, beginning in 2024.
- Sept 2023: Phoenix Motor Inc. announced a contract order for ten all-electric, zero-emission Type-A school buses in the District of Columbia. The Phoenix Type-A School Buses will be built on a Ford E-450 chassis powered by Phoenix’s 150-mile range battery electric drive system and a Pegasus Orion school bus body.
In-Depth School Bus Market Market Outlook
The school bus market outlook is exceptionally bright, driven by an irreversible shift towards electrification and enhanced safety features. The sustained commitment from governments worldwide to reduce carbon footprints and improve air quality will continue to fuel the demand for electric school buses. Innovations in battery technology are expected to further reduce charging times and increase range, addressing key concerns for fleet operators. The market will witness a growing adoption of intelligent transportation systems, integrating real-time data for efficient route planning and enhanced passenger safety. Strategic collaborations between manufacturers and energy providers will be instrumental in building out the necessary charging infrastructure. The continued expansion of Type A school bus offerings, coupled with advancements in Type C and Type D electric school bus models, will cater to the diverse needs of school districts globally, ensuring robust growth throughout the forecast period.
School Bus Market Segmentation
-
1. Propulsion Type
- 1.1. Internal Combustion Engine (ICE)
- 1.2. Compress
- 1.3. Electric and Hybrid
-
2. Capacity Design Type
- 2.1. Type A
- 2.2. Type B
- 2.3. Type C
- 2.4. Type D
School Bus Market Segmentation By Geography
-
1. North America
- 1.1. United States
- 1.2. Canada
- 1.3. Mexico
- 1.4. Rest of North America
-
2. Europe
- 2.1. Germany
- 2.2. United Kingdom
- 2.3. France
- 2.4. Russia
- 2.5. Spain
- 2.6. Rest of Europe
-
3. Asia Pacific
- 3.1. China
- 3.2. India
- 3.3. Japan
- 3.4. South Korea
- 3.5. Rest of Asia Pacific
-
4. Rest of the World
- 4.1. South America
- 4.2. Middle East and Africa
School Bus Market Regional Market Share
Geographic Coverage of School Bus Market
School Bus Market REPORT HIGHLIGHTS
| Aspects | Details |
|---|---|
| Study Period | 2020-2034 |
| Base Year | 2025 |
| Estimated Year | 2026 |
| Forecast Period | 2026-2034 |
| Historical Period | 2020-2025 |
| Growth Rate | CAGR of 5.69% from 2020-2034 |
| Segmentation |
|
Table of Contents
- 1. Introduction
- 1.1. Research Scope
- 1.2. Market Segmentation
- 1.3. Research Objective
- 1.4. Definitions and Assumptions
- 2. Executive Summary
- 2.1. Market Snapshot
- 3. Market Dynamics
- 3.1. Market Drivers
- 3.2. Market Restrains
- 3.3. Market Trends
- 3.4. Market Opportunities
- 4. Market Factor Analysis
- 4.1. Porters Five Forces
- 4.1.1. Bargaining Power of Suppliers
- 4.1.2. Bargaining Power of Buyers
- 4.1.3. Threat of New Entrants
- 4.1.4. Threat of Substitutes
- 4.1.5. Competitive Rivalry
- 4.2. PESTEL analysis
- 4.3. BCG Analysis
- 4.3.1. Stars (High Growth, High Market Share)
- 4.3.2. Cash Cows (Low Growth, High Market Share)
- 4.3.3. Question Mark (High Growth, Low Market Share)
- 4.3.4. Dogs (Low Growth, Low Market Share)
- 4.4. Ansoff Matrix Analysis
- 4.5. Supply Chain Analysis
- 4.6. Regulatory Landscape
- 4.7. Current Market Potential and Opportunity Assessment (TAM–SAM–SOM Framework)
- 4.8. IMR Analyst Note
- 4.1. Porters Five Forces
- 5. Market Analysis, Insights and Forecast 2021-2033
- 5.1. Market Analysis, Insights and Forecast - by Propulsion Type
- 5.1.1. Internal Combustion Engine (ICE)
- 5.1.2. Compress
- 5.1.3. Electric and Hybrid
- 5.2. Market Analysis, Insights and Forecast - by Capacity Design Type
- 5.2.1. Type A
- 5.2.2. Type B
- 5.2.3. Type C
- 5.2.4. Type D
- 5.3. Market Analysis, Insights and Forecast - by Region
- 5.3.1. North America
- 5.3.2. Europe
- 5.3.3. Asia Pacific
- 5.3.4. Rest of the World
- 5.1. Market Analysis, Insights and Forecast - by Propulsion Type
- 6. Global School Bus Market Analysis, Insights and Forecast, 2021-2033
- 6.1. Market Analysis, Insights and Forecast - by Propulsion Type
- 6.1.1. Internal Combustion Engine (ICE)
- 6.1.2. Compress
- 6.1.3. Electric and Hybrid
- 6.2. Market Analysis, Insights and Forecast - by Capacity Design Type
- 6.2.1. Type A
- 6.2.2. Type B
- 6.2.3. Type C
- 6.2.4. Type D
- 6.1. Market Analysis, Insights and Forecast - by Propulsion Type
- 7. North America School Bus Market Analysis, Insights and Forecast, 2020-2032
- 7.1. Market Analysis, Insights and Forecast - by Propulsion Type
- 7.1.1. Internal Combustion Engine (ICE)
- 7.1.2. Compress
- 7.1.3. Electric and Hybrid
- 7.2. Market Analysis, Insights and Forecast - by Capacity Design Type
- 7.2.1. Type A
- 7.2.2. Type B
- 7.2.3. Type C
- 7.2.4. Type D
- 7.1. Market Analysis, Insights and Forecast - by Propulsion Type
- 8. Europe School Bus Market Analysis, Insights and Forecast, 2020-2032
- 8.1. Market Analysis, Insights and Forecast - by Propulsion Type
- 8.1.1. Internal Combustion Engine (ICE)
- 8.1.2. Compress
- 8.1.3. Electric and Hybrid
- 8.2. Market Analysis, Insights and Forecast - by Capacity Design Type
- 8.2.1. Type A
- 8.2.2. Type B
- 8.2.3. Type C
- 8.2.4. Type D
- 8.1. Market Analysis, Insights and Forecast - by Propulsion Type
- 9. Asia Pacific School Bus Market Analysis, Insights and Forecast, 2020-2032
- 9.1. Market Analysis, Insights and Forecast - by Propulsion Type
- 9.1.1. Internal Combustion Engine (ICE)
- 9.1.2. Compress
- 9.1.3. Electric and Hybrid
- 9.2. Market Analysis, Insights and Forecast - by Capacity Design Type
- 9.2.1. Type A
- 9.2.2. Type B
- 9.2.3. Type C
- 9.2.4. Type D
- 9.1. Market Analysis, Insights and Forecast - by Propulsion Type
- 10. Rest of the World School Bus Market Analysis, Insights and Forecast, 2020-2032
- 10.1. Market Analysis, Insights and Forecast - by Propulsion Type
- 10.1.1. Internal Combustion Engine (ICE)
- 10.1.2. Compress
- 10.1.3. Electric and Hybrid
- 10.2. Market Analysis, Insights and Forecast - by Capacity Design Type
- 10.2.1. Type A
- 10.2.2. Type B
- 10.2.3. Type C
- 10.2.4. Type D
- 10.1. Market Analysis, Insights and Forecast - by Propulsion Type
- 11. Competitive Analysis
- 11.1. Company Profiles
- 11.1.1 Blue Bird Corporation
- 11.1.1.1. Company Overview
- 11.1.1.2. Products
- 11.1.1.3. Company Financials
- 11.1.1.4. SWOT Analysis
- 11.1.2 IC Bus (Navistar International Corporation)
- 11.1.2.1. Company Overview
- 11.1.2.2. Products
- 11.1.2.3. Company Financials
- 11.1.2.4. SWOT Analysis
- 11.1.3 Yutong Buses Co Ltd
- 11.1.3.1. Company Overview
- 11.1.3.2. Products
- 11.1.3.3. Company Financials
- 11.1.3.4. SWOT Analysis
- 11.1.4 JCBL Limited
- 11.1.4.1. Company Overview
- 11.1.4.2. Products
- 11.1.4.3. Company Financials
- 11.1.4.4. SWOT Analysis
- 11.1.5 Anhui Ankai Automobile
- 11.1.5.1. Company Overview
- 11.1.5.2. Products
- 11.1.5.3. Company Financials
- 11.1.5.4. SWOT Analysis
- 11.1.6 Thomas Built Buses Inc
- 11.1.6.1. Company Overview
- 11.1.6.2. Products
- 11.1.6.3. Company Financials
- 11.1.6.4. SWOT Analysis
- 11.1.7 Lion Electric Company
- 11.1.7.1. Company Overview
- 11.1.7.2. Products
- 11.1.7.3. Company Financials
- 11.1.7.4. SWOT Analysis
- 11.1.8 Collins Bus Corporation
- 11.1.8.1. Company Overview
- 11.1.8.2. Products
- 11.1.8.3. Company Financials
- 11.1.8.4. SWOT Analysis
- 11.1.9 Tata Motor
- 11.1.9.1. Company Overview
- 11.1.9.2. Products
- 11.1.9.3. Company Financials
- 11.1.9.4. SWOT Analysis
- 11.1.1 Blue Bird Corporation
- 11.2. Market Entropy
- 11.2.1 Company's Key Areas Served
- 11.2.2 Recent Developments
- 11.3. Company Market Share Analysis 2025
- 11.3.1 Top 5 Companies Market Share Analysis
- 11.3.2 Top 3 Companies Market Share Analysis
- 11.4. List of Potential Customers
- 12. Research Methodology
List of Figures
- Figure 1: Global School Bus Market Revenue Breakdown (Million, %) by Region 2025 & 2033
- Figure 2: North America School Bus Market Revenue (Million), by Propulsion Type 2025 & 2033
- Figure 3: North America School Bus Market Revenue Share (%), by Propulsion Type 2025 & 2033
- Figure 4: North America School Bus Market Revenue (Million), by Capacity Design Type 2025 & 2033
- Figure 5: North America School Bus Market Revenue Share (%), by Capacity Design Type 2025 & 2033
- Figure 6: North America School Bus Market Revenue (Million), by Country 2025 & 2033
- Figure 7: North America School Bus Market Revenue Share (%), by Country 2025 & 2033
- Figure 8: Europe School Bus Market Revenue (Million), by Propulsion Type 2025 & 2033
- Figure 9: Europe School Bus Market Revenue Share (%), by Propulsion Type 2025 & 2033
- Figure 10: Europe School Bus Market Revenue (Million), by Capacity Design Type 2025 & 2033
- Figure 11: Europe School Bus Market Revenue Share (%), by Capacity Design Type 2025 & 2033
- Figure 12: Europe School Bus Market Revenue (Million), by Country 2025 & 2033
- Figure 13: Europe School Bus Market Revenue Share (%), by Country 2025 & 2033
- Figure 14: Asia Pacific School Bus Market Revenue (Million), by Propulsion Type 2025 & 2033
- Figure 15: Asia Pacific School Bus Market Revenue Share (%), by Propulsion Type 2025 & 2033
- Figure 16: Asia Pacific School Bus Market Revenue (Million), by Capacity Design Type 2025 & 2033
- Figure 17: Asia Pacific School Bus Market Revenue Share (%), by Capacity Design Type 2025 & 2033
- Figure 18: Asia Pacific School Bus Market Revenue (Million), by Country 2025 & 2033
- Figure 19: Asia Pacific School Bus Market Revenue Share (%), by Country 2025 & 2033
- Figure 20: Rest of the World School Bus Market Revenue (Million), by Propulsion Type 2025 & 2033
- Figure 21: Rest of the World School Bus Market Revenue Share (%), by Propulsion Type 2025 & 2033
- Figure 22: Rest of the World School Bus Market Revenue (Million), by Capacity Design Type 2025 & 2033
- Figure 23: Rest of the World School Bus Market Revenue Share (%), by Capacity Design Type 2025 & 2033
- Figure 24: Rest of the World School Bus Market Revenue (Million), by Country 2025 & 2033
- Figure 25: Rest of the World School Bus Market Revenue Share (%), by Country 2025 & 2033
List of Tables
- Table 1: Global School Bus Market Revenue Million Forecast, by Propulsion Type 2020 & 2033
- Table 2: Global School Bus Market Revenue Million Forecast, by Capacity Design Type 2020 & 2033
- Table 3: Global School Bus Market Revenue Million Forecast, by Region 2020 & 2033
- Table 4: Global School Bus Market Revenue Million Forecast, by Propulsion Type 2020 & 2033
- Table 5: Global School Bus Market Revenue Million Forecast, by Capacity Design Type 2020 & 2033
- Table 6: Global School Bus Market Revenue Million Forecast, by Country 2020 & 2033
- Table 7: United States School Bus Market Revenue (Million) Forecast, by Application 2020 & 2033
- Table 8: Canada School Bus Market Revenue (Million) Forecast, by Application 2020 & 2033
- Table 9: Mexico School Bus Market Revenue (Million) Forecast, by Application 2020 & 2033
- Table 10: Rest of North America School Bus Market Revenue (Million) Forecast, by Application 2020 & 2033
- Table 11: Global School Bus Market Revenue Million Forecast, by Propulsion Type 2020 & 2033
- Table 12: Global School Bus Market Revenue Million Forecast, by Capacity Design Type 2020 & 2033
- Table 13: Global School Bus Market Revenue Million Forecast, by Country 2020 & 2033
- Table 14: Germany School Bus Market Revenue (Million) Forecast, by Application 2020 & 2033
- Table 15: United Kingdom School Bus Market Revenue (Million) Forecast, by Application 2020 & 2033
- Table 16: France School Bus Market Revenue (Million) Forecast, by Application 2020 & 2033
- Table 17: Russia School Bus Market Revenue (Million) Forecast, by Application 2020 & 2033
- Table 18: Spain School Bus Market Revenue (Million) Forecast, by Application 2020 & 2033
- Table 19: Rest of Europe School Bus Market Revenue (Million) Forecast, by Application 2020 & 2033
- Table 20: Global School Bus Market Revenue Million Forecast, by Propulsion Type 2020 & 2033
- Table 21: Global School Bus Market Revenue Million Forecast, by Capacity Design Type 2020 & 2033
- Table 22: Global School Bus Market Revenue Million Forecast, by Country 2020 & 2033
- Table 23: China School Bus Market Revenue (Million) Forecast, by Application 2020 & 2033
- Table 24: India School Bus Market Revenue (Million) Forecast, by Application 2020 & 2033
- Table 25: Japan School Bus Market Revenue (Million) Forecast, by Application 2020 & 2033
- Table 26: South Korea School Bus Market Revenue (Million) Forecast, by Application 2020 & 2033
- Table 27: Rest of Asia Pacific School Bus Market Revenue (Million) Forecast, by Application 2020 & 2033
- Table 28: Global School Bus Market Revenue Million Forecast, by Propulsion Type 2020 & 2033
- Table 29: Global School Bus Market Revenue Million Forecast, by Capacity Design Type 2020 & 2033
- Table 30: Global School Bus Market Revenue Million Forecast, by Country 2020 & 2033
- Table 31: South America School Bus Market Revenue (Million) Forecast, by Application 2020 & 2033
- Table 32: Middle East and Africa School Bus Market Revenue (Million) Forecast, by Application 2020 & 2033
Frequently Asked Questions
1. What is the projected Compound Annual Growth Rate (CAGR) of the School Bus Market?
The projected CAGR is approximately 5.69%.
2. Which companies are prominent players in the School Bus Market?
Key companies in the market include Blue Bird Corporation, IC Bus (Navistar International Corporation), Yutong Buses Co Ltd, JCBL Limited, Anhui Ankai Automobile, Thomas Built Buses Inc, Lion Electric Company, Collins Bus Corporation, Tata Motor.
3. What are the main segments of the School Bus Market?
The market segments include Propulsion Type, Capacity Design Type.
4. Can you provide details about the market size?
The market size is estimated to be USD 48.03 Million as of 2022.
5. What are some drivers contributing to market growth?
Government Initiatives Worldwide Supporting Education Infrastructure are Propelling Growth.
6. What are the notable trends driving market growth?
Growing Sales of Electric School Buses to Witness Growth in Coming Years.
7. Are there any restraints impacting market growth?
Stringent Regulatory Compliance Standards Related to Emissions and Safety Present Hurdles.
8. Can you provide examples of recent developments in the market?
Dec 2023: GreenPower Motor Company announced its first orders for the Type A all-electric, purpose-built, zero-emission Nano BEAST school bus for the New York market through its dealer Leonard Bus Sales.
9. What pricing options are available for accessing the report?
Pricing options include single-user, multi-user, and enterprise licenses priced at USD 4750, USD 5250, and USD 8750 respectively.
10. Is the market size provided in terms of value or volume?
The market size is provided in terms of value, measured in Million.
11. Are there any specific market keywords associated with the report?
Yes, the market keyword associated with the report is "School Bus Market," which aids in identifying and referencing the specific market segment covered.
12. How do I determine which pricing option suits my needs best?
The pricing options vary based on user requirements and access needs. Individual users may opt for single-user licenses, while businesses requiring broader access may choose multi-user or enterprise licenses for cost-effective access to the report.
13. Are there any additional resources or data provided in the School Bus Market report?
While the report offers comprehensive insights, it's advisable to review the specific contents or supplementary materials provided to ascertain if additional resources or data are available.
14. How can I stay updated on further developments or reports in the School Bus Market?
To stay informed about further developments, trends, and reports in the School Bus Market, consider subscribing to industry newsletters, following relevant companies and organizations, or regularly checking reputable industry news sources and publications.
Methodology
Step 1 - Identification of Relevant Samples Size from Population Database


Step 2 - Approaches for Defining Global Market Size (Value, Volume* & Price*)

Note*: In applicable scenarios
Step 3 - Data Sources
Primary Research
- Web Analytics
- Survey Reports
- Research Institute
- Latest Research Reports
- Opinion Leaders
Secondary Research
- Annual Reports
- White Paper
- Latest Press Release
- Industry Association
- Paid Database
- Investor Presentations

Step 4 - Data Triangulation
Involves using different sources of information in order to increase the validity of a study
These sources are likely to be stakeholders in a program - participants, other researchers, program staff, other community members, and so on.
Then we put all data in single framework & apply various statistical tools to find out the dynamic on the market.
During the analysis stage, feedback from the stakeholder groups would be compared to determine areas of agreement as well as areas of divergence