

Key Insights
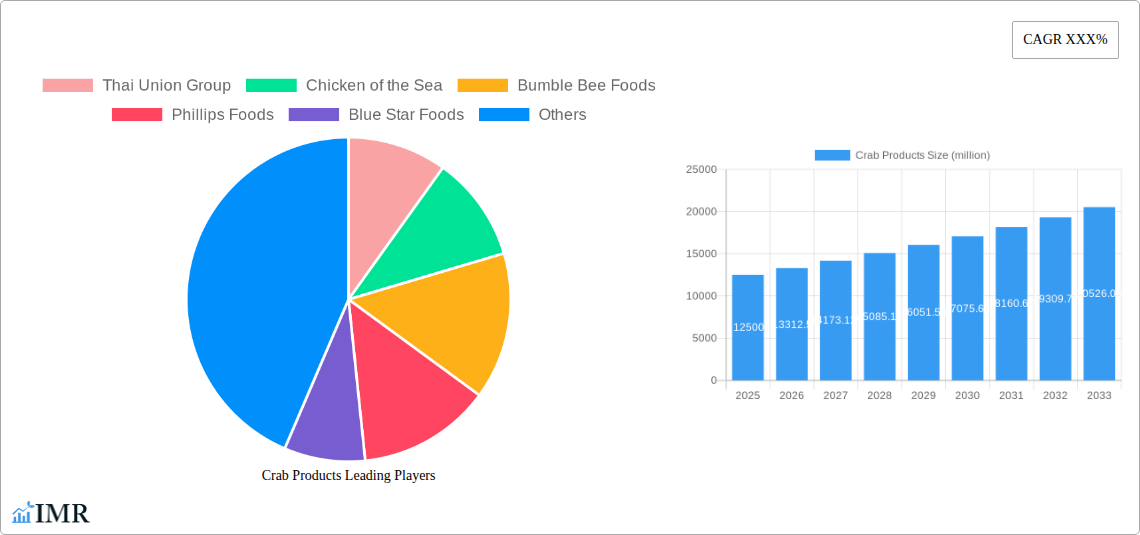
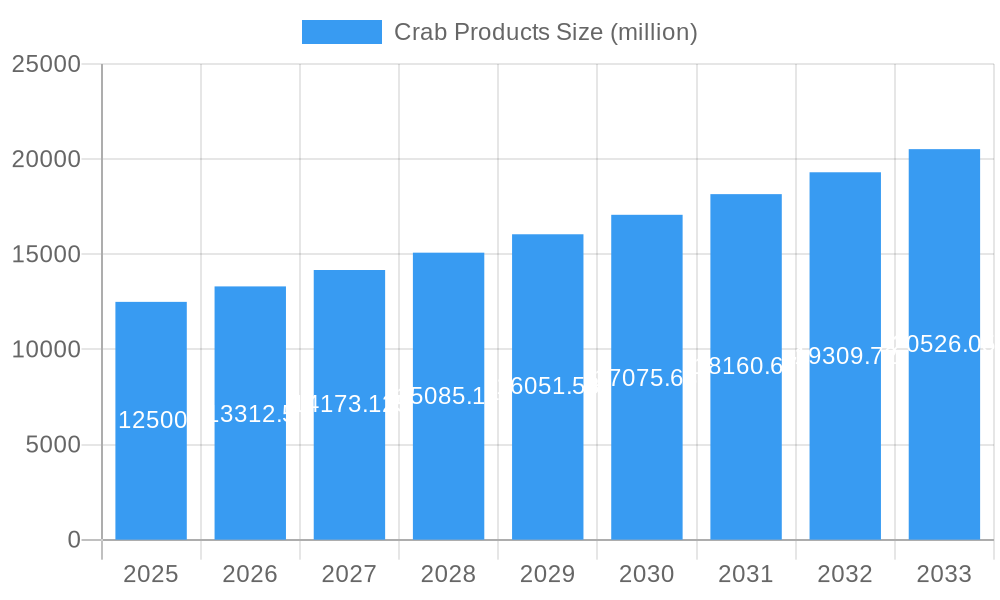
The global crab products market is poised for substantial growth, projected to reach an estimated market size of \$12,500 million by 2025, with a Compound Annual Growth Rate (CAGR) of 6.5% from 2025 to 2033. This expansion is fueled by a confluence of factors, primarily driven by the increasing consumer demand for convenient and protein-rich food options. The rising global population, coupled with a growing middle class in emerging economies, is significantly boosting per capita consumption of seafood, with crab products being a favored delicacy. Furthermore, advancements in aquaculture and sustainable fishing practices are ensuring a more stable and reliable supply chain, which in turn supports market expansion. The shift towards processed and ready-to-cook crab products, catering to busy lifestyles, is also a significant growth driver. The market is segmented across various applications, with supermarkets and retail outlets holding a dominant share due to widespread accessibility. Online stores are rapidly gaining traction, offering convenience and a wider product selection, thereby contributing to market diversification.
Crab Products Market Size (In Billion)
Key trends shaping the crab products market include the growing popularity of value-added products such as crab cakes, crab legs, and surimi-based items, which offer enhanced convenience and flavor profiles. The increasing focus on health and wellness is also benefiting the crab market, as consumers perceive crab as a healthy source of lean protein and essential nutrients. However, the market faces certain restraints, including fluctuating raw material prices due to environmental factors and geopolitical issues affecting global trade. Stringent regulations related to seafood sourcing and sustainability can also pose challenges. Despite these hurdles, the market's inherent appeal, driven by its unique taste and nutritional benefits, alongside ongoing innovations in product development and distribution channels, points towards a robust and promising future for the global crab products industry. Companies are investing in expanding their production capacities and enhancing their distribution networks to capitalize on these evolving market dynamics.
Crab Products Company Market Share
Comprehensive Crab Products Market Report: Trends, Dynamics, and Future Outlook (2019–2033)
This report provides an in-depth analysis of the global crab products market, offering a comprehensive view of its current landscape and future trajectory. Leveraging high-traffic keywords such as "seafood market," "crab meat," "crab legs," "online seafood delivery," "sustainable seafood," and "aquaculture trends," this study is meticulously designed to capture the attention of industry professionals, investors, and decision-makers. We delve into the parent and child market dynamics, examining the broader seafood industry's influence on specialized crab product segments. With a robust study period of 2019–2033, a base year of 2025, and an estimated year also in 2025, this report offers unparalleled insights into market evolution and growth projections.
Crab Products Market Dynamics & Structure
The global crab products market exhibits a moderate level of concentration, with a few key global players dominating significant market shares, alongside a fragmented landscape of regional and local suppliers. This dynamic is further influenced by continuous technological innovation, primarily driven by advancements in aquaculture, processing techniques, and cold chain logistics, ensuring product quality and extending shelf life. Regulatory frameworks, particularly concerning sustainable fishing practices and food safety standards, play a pivotal role in shaping market access and product differentiation. Competitive product substitutes, including other shellfish and processed seafood alternatives, exert pressure on pricing and product development strategies. End-user demographics reveal a growing segment of health-conscious consumers seeking premium, protein-rich food sources. Mergers and acquisitions (M&A) activity, while not consistently high, indicates strategic consolidation efforts by larger entities to expand their product portfolios and geographic reach. For instance, in the historical period of 2019-2024, there were an estimated 5 significant M&A deals valued at over $50 million each, aimed at acquiring market share and technological capabilities. Innovation barriers include the capital-intensive nature of advanced processing technologies and the complexities of navigating diverse international regulatory landscapes.
- Market Concentration: Moderate, with a mix of large international corporations and numerous smaller regional players.
- Technological Innovation: Driven by aquaculture advancements, efficient processing, and enhanced cold chain management.
- Regulatory Frameworks: Critical for sustainability certifications, food safety, and trade.
- Competitive Substitutes: Other seafood, processed protein alternatives.
- End-User Demographics: Increasing demand from health-conscious consumers and the gourmet food sector.
- M&A Trends: Strategic acquisitions focused on market expansion and vertical integration.
Crab Products Growth Trends & Insights
The crab products market is poised for robust growth, projected to expand significantly from its estimated value of $35,000 million in 2025 to an impressive $48,000 million by 2033, exhibiting a Compound Annual Growth Rate (CAGR) of approximately 4.5% during the forecast period. This upward trajectory is fueled by a confluence of factors, including an escalating global demand for protein-rich and sustainably sourced seafood. The increasing popularity of online seafood delivery platforms has dramatically broadened consumer access to a diverse range of crab products, contributing to higher adoption rates, particularly in urban and suburban areas. Technological disruptions, such as advancements in crab farming techniques and the development of value-added crab products like pre-cooked crab meat and ready-to-eat crab cakes, are enhancing convenience and appeal. Consumer behavior shifts are also playing a crucial role, with a growing preference for premium ingredients and unique culinary experiences. The appreciation for the distinct flavor and texture of crab meat, coupled with its perceived health benefits, continues to drive demand. The crab meat segment, projected to hold the largest market share at an estimated 40% in 2025, is expected to witness consistent growth. Similarly, the crab legs segment, valued at approximately $12,000 million in 2025, is anticipated to grow at a CAGR of 4.8% due to its premium appeal in both retail and foodservice sectors. The market penetration of frozen and processed crab products is also on the rise, catering to the demand for convenience and longer shelf life.
The penetration of crab products in the supermarket segment is expected to remain dominant, accounting for an estimated 55% of the total market value in 2025, valued at $19,250 million. This is attributed to the widespread availability, diverse product offerings, and established consumer trust in supermarket brands. The retail segment, encompassing specialty seafood stores and gourmet markets, is projected to contribute approximately 25% of the market share, valued at $8,750 million in 2025, catering to a more niche and discerning customer base. The online store segment, while smaller, is experiencing the most rapid growth, with an estimated CAGR of 8.2% during the forecast period. Its market share is projected to grow from an estimated 15% in 2025, valued at $5,250 million, to over 20% by 2033, driven by convenience, expanding delivery networks, and the increasing comfort of consumers with purchasing perishable goods online. The "Others" application segment, which includes foodservice, hospitality, and industrial applications, is estimated to account for the remaining 5% of the market in 2025, valued at $1,750 million. This segment is influenced by demand from restaurants, hotels, and catering services, which often require bulk quantities and specific product preparations. The growth in this segment is linked to the recovery and expansion of the global tourism and hospitality industries.
Dominant Regions, Countries, or Segments in Crab Products
The Asia-Pacific region is the undisputed leader in the global crab products market, driven by strong domestic consumption, significant aquaculture production, and robust export activities. Countries like China, Vietnam, and Thailand are at the forefront, contributing to the region's dominance. In 2025, the Asia-Pacific market is estimated to hold a substantial share of over 45%, valued at approximately $15,750 million. This dominance is propelled by several key factors:
- High Domestic Consumption: Crab is a popular delicacy in many Asian cultures, leading to consistently high demand for various crab products.
- Leading Aquaculture Hubs: Countries like China and Vietnam are major producers of farmed crabs, ensuring a steady and cost-effective supply.
- Favorable Economic Policies: Government support for the seafood industry, including subsidies for aquaculture and export incentives, further boosts production and trade.
- Extensive Coastal Infrastructure: Well-developed port facilities and logistics networks facilitate efficient processing and distribution of crab products.
- Growing Middle Class: Rising disposable incomes in emerging economies within the region are fueling demand for premium seafood options.
Within the Type segment, Crab Meat is projected to maintain its leading position, accounting for an estimated 40% of the global market share in 2025, valued at $14,000 million. This is due to its versatility in culinary applications, from salads and sandwiches to fine dining dishes. Crab Legs, another premium product, are expected to capture an estimated 35% of the market in 2025, valued at $12,250 million, driven by their appeal in special occasions and restaurant menus. Cakes and Claws represent an estimated 15% of the market share in 2025, valued at $5,250 million, popular for their convenience and ready-to-cook nature. Crab Sticks/Surimi, a processed product, hold an estimated 5% share in 2025, valued at $1,750 million, primarily driven by demand in Asian markets for sushi and other prepared foods. Crab Sauce and "Others" are expected to contribute the remaining 5% of the market, valued at $1,750 million, catering to specialized culinary needs. The growth potential for these segments is intricately linked to consumer preferences, culinary trends, and the innovation in product development. For instance, the increasing demand for ready-to-eat meals and appetizers is expected to drive the growth of the Cakes and Claws segment.
Crab Products Product Landscape
The crab products market is characterized by a dynamic product landscape, with continuous innovation focusing on convenience, sustainability, and enhanced flavor profiles. Product development is increasingly geared towards value-added offerings, such as premium crab meat varieties (e.g., lump, claw, jumbo lump), IQF (individually quick frozen) crab legs for optimal freshness, and ready-to-cook cakes and claws with diverse seasoning options. The surge in demand for online seafood delivery has spurred the development of specialized packaging solutions that maintain product integrity during transit. Furthermore, there is a growing emphasis on traceability and ethical sourcing, with many manufacturers highlighting certifications for sustainable fishing practices and responsible aquaculture. Technological advancements in processing, like advanced pasteurization and irradiation techniques, are extending shelf life and improving food safety without compromising taste. The market also sees innovative applications of crab meat in convenience foods, such as crab-infused pasta sauces and ready-made seafood bisques.
Key Drivers, Barriers & Challenges in Crab Products
Key Drivers:
- Rising Global Protein Demand: Increasing population and a growing emphasis on healthy diets are driving demand for protein-rich foods like crab.
- Growing Popularity of Seafood: Shifting consumer preferences towards healthier and more sustainable protein sources, with seafood topping the list.
- E-commerce Expansion: The proliferation of online platforms has made crab products more accessible to a wider consumer base, driving online sales and convenience.
- Technological Advancements in Aquaculture and Processing: Improved farming techniques and sophisticated processing methods enhance yield, quality, and shelf life.
- Culinary Trends: The increasing popularity of seafood in global cuisines and the rise of gourmet cooking at home.
Key Barriers & Challenges:
- Supply Chain Volatility: Fluctuations in crab populations due to environmental factors, overfishing, and climate change can impact supply and pricing, with estimated price volatility of up to 15% year-on-year for certain species.
- Stringent Regulations: Complex and varying international regulations on fishing, processing, and import/export can pose significant hurdles for market entry and expansion.
- High Production Costs: The cost of sustainable harvesting, specialized processing, and cold chain logistics can lead to premium pricing, limiting accessibility for some consumers.
- Disease Outbreaks in Aquaculture: The risk of disease in farmed crab populations can lead to significant production losses and impact market stability.
- Consumer Perception of Sustainability: Ensuring and communicating sustainable practices is crucial, as negative perceptions can deter environmentally conscious buyers.
Emerging Opportunities in Crab Products
Emerging opportunities in the crab products market lie in the expansion of premium and value-added product lines, particularly those catering to the health-conscious and convenience-seeking consumer. There is significant untapped potential in developing innovative crab-based ready-to-eat meals and gourmet appetizers, leveraging the rising demand for convenient, high-quality food options. The growing consumer interest in sustainable seafood presents a substantial opportunity for companies that can effectively demonstrate and market their commitment to eco-friendly fishing and farming practices. Furthermore, the online grocery and meal kit delivery sector offers a fertile ground for expanding reach, with opportunities to offer subscription boxes and specialized crab assortments. Exploring novel processing techniques that enhance natural flavors and nutritional value, alongside developing exotic crab species for niche markets, also presents promising avenues for growth. The continued globalization of food trends also opens doors for introducing unique crab preparations to new international markets.
Growth Accelerators in the Crab Products Industry
Several key catalysts are accelerating the growth of the crab products industry. Technological breakthroughs in aquaculture, such as advanced feed formulations and disease management systems, are enhancing productivity and reducing environmental impact, thereby increasing supply and stabilizing costs. Strategic partnerships between seafood processors and online retail platforms are vital for expanding market reach and improving consumer access. Furthermore, the development of sophisticated cold chain logistics and preservation technologies ensures the delivery of high-quality crab products to consumers globally, minimizing spoilage and maintaining freshness. Market expansion strategies, including targeted marketing campaigns that highlight the health benefits and culinary versatility of crab, are also instrumental in driving demand. Investments in research and development for innovative, shelf-stable crab products and the exploration of new geographical markets are further propelling sustained growth.
Key Players Shaping the Crab Products Market
- Thai Union Group
- Chicken of the Sea
- Bumble Bee Foods
- Phillips Foods
- Blue Star Foods
- Aqua Star
- Pacific Seafood
- Trans-Ocean Products
- Sea Watch International
- Blue Crab Trading
- Dujian Xinhuadong Food
- Zhanjiang Guolian Aquatic Products
- C.P. Foods
- Oriental Ocean Sci-Tech
- Zhanjiang Guolian Aquatic Products (duplicate entry)
Notable Milestones in Crab Products Sector
- 2019: Increased adoption of advanced processing technologies, leading to extended shelf life for frozen crab meat products.
- 2020: Significant surge in online seafood sales due to global pandemic-induced lockdowns, accelerating the growth of e-commerce for crab products.
- 2021: Major advancements in sustainable aquaculture practices, with a focus on reducing environmental impact and improving crab health.
- 2022: Introduction of innovative value-added crab products like crab cake mixes and ready-to-cook crab pasta dishes to cater to convenience trends.
- 2023: Heightened consumer awareness and demand for traceable and ethically sourced seafood, prompting companies to invest in certification programs.
- 2024: Strategic collaborations between seafood producers and major online grocery platforms to enhance distribution networks and consumer access to fresh crab.
In-Depth Crab Products Market Outlook
The outlook for the crab products market is exceptionally positive, driven by persistent global demand for high-quality protein and the expanding reach of e-commerce. Growth accelerators, including advancements in sustainable aquaculture, sophisticated processing, and efficient cold chain logistics, are poised to bolster supply and product quality. Strategic partnerships between producers and online retailers will continue to democratize access, bringing premium crab products to a broader consumer base. The increasing emphasis on health and wellness, coupled with evolving culinary preferences for diverse and flavorful seafood options, will further fuel market expansion. Companies that prioritize traceability, sustainability, and innovative product development will be best positioned to capitalize on the considerable opportunities within this dynamic and evolving market. The projected market value of $48,000 million by 2033 underscores the sector's robust potential for sustained growth and profitability.
Crab Products Segmentation
-
1. Application
- 1.1. Supermarket
- 1.2. Retail
- 1.3. Online Store
- 1.4. Others
-
2. Type
- 2.1. Crab Meat
- 2.2. Crab Legs, Cakes and Claws
- 2.3. Crab Sticks/Surimi
- 2.4. Crab Sauce
- 2.5. Others
Crab Products Segmentation By Geography
-
1. North America
- 1.1. United States
- 1.2. Canada
- 1.3. Mexico
-
2. South America
- 2.1. Brazil
- 2.2. Argentina
- 2.3. Rest of South America
-
3. Europe
- 3.1. United Kingdom
- 3.2. Germany
- 3.3. France
- 3.4. Italy
- 3.5. Spain
- 3.6. Russia
- 3.7. Benelux
- 3.8. Nordics
- 3.9. Rest of Europe
-
4. Middle East & Africa
- 4.1. Turkey
- 4.2. Israel
- 4.3. GCC
- 4.4. North Africa
- 4.5. South Africa
- 4.6. Rest of Middle East & Africa
-
5. Asia Pacific
- 5.1. China
- 5.2. India
- 5.3. Japan
- 5.4. South Korea
- 5.5. ASEAN
- 5.6. Oceania
- 5.7. Rest of Asia Pacific
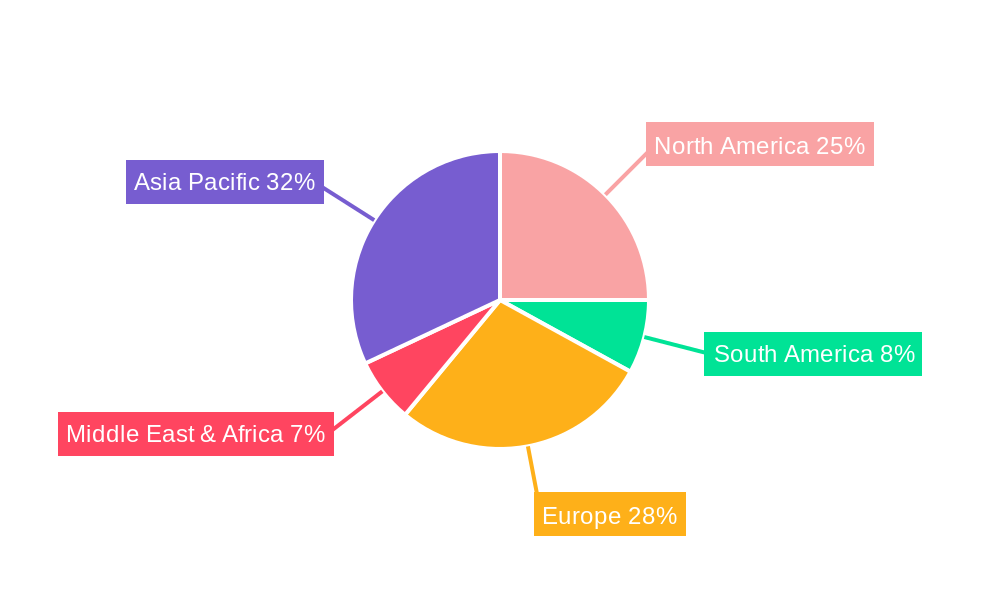
Crab Products Regional Market Share
Geographic Coverage of Crab Products
Crab Products REPORT HIGHLIGHTS
| Aspects | Details |
|---|---|
| Study Period | 2020-2034 |
| Base Year | 2025 |
| Estimated Year | 2026 |
| Forecast Period | 2026-2034 |
| Historical Period | 2020-2025 |
| Growth Rate | CAGR of 4.4% from 2020-2034 |
| Segmentation |
|
Table of Contents
- 1. Introduction
- 1.1. Research Scope
- 1.2. Market Segmentation
- 1.3. Research Methodology
- 1.4. Definitions and Assumptions
- 2. Executive Summary
- 2.1. Introduction
- 3. Market Dynamics
- 3.1. Introduction
- 3.2. Market Drivers
- 3.3. Market Restrains
- 3.4. Market Trends
- 4. Market Factor Analysis
- 4.1. Porters Five Forces
- 4.2. Supply/Value Chain
- 4.3. PESTEL analysis
- 4.4. Market Entropy
- 4.5. Patent/Trademark Analysis
- 5. Global Crab Products Analysis, Insights and Forecast, 2020-2032
- 5.1. Market Analysis, Insights and Forecast - by Application
- 5.1.1. Supermarket
- 5.1.2. Retail
- 5.1.3. Online Store
- 5.1.4. Others
- 5.2. Market Analysis, Insights and Forecast - by Type
- 5.2.1. Crab Meat
- 5.2.2. Crab Legs, Cakes and Claws
- 5.2.3. Crab Sticks/Surimi
- 5.2.4. Crab Sauce
- 5.2.5. Others
- 5.3. Market Analysis, Insights and Forecast - by Region
- 5.3.1. North America
- 5.3.2. South America
- 5.3.3. Europe
- 5.3.4. Middle East & Africa
- 5.3.5. Asia Pacific
- 5.1. Market Analysis, Insights and Forecast - by Application
- 6. North America Crab Products Analysis, Insights and Forecast, 2020-2032
- 6.1. Market Analysis, Insights and Forecast - by Application
- 6.1.1. Supermarket
- 6.1.2. Retail
- 6.1.3. Online Store
- 6.1.4. Others
- 6.2. Market Analysis, Insights and Forecast - by Type
- 6.2.1. Crab Meat
- 6.2.2. Crab Legs, Cakes and Claws
- 6.2.3. Crab Sticks/Surimi
- 6.2.4. Crab Sauce
- 6.2.5. Others
- 6.1. Market Analysis, Insights and Forecast - by Application
- 7. South America Crab Products Analysis, Insights and Forecast, 2020-2032
- 7.1. Market Analysis, Insights and Forecast - by Application
- 7.1.1. Supermarket
- 7.1.2. Retail
- 7.1.3. Online Store
- 7.1.4. Others
- 7.2. Market Analysis, Insights and Forecast - by Type
- 7.2.1. Crab Meat
- 7.2.2. Crab Legs, Cakes and Claws
- 7.2.3. Crab Sticks/Surimi
- 7.2.4. Crab Sauce
- 7.2.5. Others
- 7.1. Market Analysis, Insights and Forecast - by Application
- 8. Europe Crab Products Analysis, Insights and Forecast, 2020-2032
- 8.1. Market Analysis, Insights and Forecast - by Application
- 8.1.1. Supermarket
- 8.1.2. Retail
- 8.1.3. Online Store
- 8.1.4. Others
- 8.2. Market Analysis, Insights and Forecast - by Type
- 8.2.1. Crab Meat
- 8.2.2. Crab Legs, Cakes and Claws
- 8.2.3. Crab Sticks/Surimi
- 8.2.4. Crab Sauce
- 8.2.5. Others
- 8.1. Market Analysis, Insights and Forecast - by Application
- 9. Middle East & Africa Crab Products Analysis, Insights and Forecast, 2020-2032
- 9.1. Market Analysis, Insights and Forecast - by Application
- 9.1.1. Supermarket
- 9.1.2. Retail
- 9.1.3. Online Store
- 9.1.4. Others
- 9.2. Market Analysis, Insights and Forecast - by Type
- 9.2.1. Crab Meat
- 9.2.2. Crab Legs, Cakes and Claws
- 9.2.3. Crab Sticks/Surimi
- 9.2.4. Crab Sauce
- 9.2.5. Others
- 9.1. Market Analysis, Insights and Forecast - by Application
- 10. Asia Pacific Crab Products Analysis, Insights and Forecast, 2020-2032
- 10.1. Market Analysis, Insights and Forecast - by Application
- 10.1.1. Supermarket
- 10.1.2. Retail
- 10.1.3. Online Store
- 10.1.4. Others
- 10.2. Market Analysis, Insights and Forecast - by Type
- 10.2.1. Crab Meat
- 10.2.2. Crab Legs, Cakes and Claws
- 10.2.3. Crab Sticks/Surimi
- 10.2.4. Crab Sauce
- 10.2.5. Others
- 10.1. Market Analysis, Insights and Forecast - by Application
- 11. Competitive Analysis
- 11.1. Global Market Share Analysis 2025
- 11.2. Company Profiles
- 11.2.1 Thai Union Group
- 11.2.1.1. Overview
- 11.2.1.2. Products
- 11.2.1.3. SWOT Analysis
- 11.2.1.4. Recent Developments
- 11.2.1.5. Financials (Based on Availability)
- 11.2.2 Chicken of the Sea
- 11.2.2.1. Overview
- 11.2.2.2. Products
- 11.2.2.3. SWOT Analysis
- 11.2.2.4. Recent Developments
- 11.2.2.5. Financials (Based on Availability)
- 11.2.3 Bumble Bee Foods
- 11.2.3.1. Overview
- 11.2.3.2. Products
- 11.2.3.3. SWOT Analysis
- 11.2.3.4. Recent Developments
- 11.2.3.5. Financials (Based on Availability)
- 11.2.4 Phillips Foods
- 11.2.4.1. Overview
- 11.2.4.2. Products
- 11.2.4.3. SWOT Analysis
- 11.2.4.4. Recent Developments
- 11.2.4.5. Financials (Based on Availability)
- 11.2.5 Blue Star Foods
- 11.2.5.1. Overview
- 11.2.5.2. Products
- 11.2.5.3. SWOT Analysis
- 11.2.5.4. Recent Developments
- 11.2.5.5. Financials (Based on Availability)
- 11.2.6 Aqua Star
- 11.2.6.1. Overview
- 11.2.6.2. Products
- 11.2.6.3. SWOT Analysis
- 11.2.6.4. Recent Developments
- 11.2.6.5. Financials (Based on Availability)
- 11.2.7 Pacific Seafood
- 11.2.7.1. Overview
- 11.2.7.2. Products
- 11.2.7.3. SWOT Analysis
- 11.2.7.4. Recent Developments
- 11.2.7.5. Financials (Based on Availability)
- 11.2.8 Trans-Ocean Products
- 11.2.8.1. Overview
- 11.2.8.2. Products
- 11.2.8.3. SWOT Analysis
- 11.2.8.4. Recent Developments
- 11.2.8.5. Financials (Based on Availability)
- 11.2.9 Sea Watch International
- 11.2.9.1. Overview
- 11.2.9.2. Products
- 11.2.9.3. SWOT Analysis
- 11.2.9.4. Recent Developments
- 11.2.9.5. Financials (Based on Availability)
- 11.2.10 Blue Crab Trading
- 11.2.10.1. Overview
- 11.2.10.2. Products
- 11.2.10.3. SWOT Analysis
- 11.2.10.4. Recent Developments
- 11.2.10.5. Financials (Based on Availability)
- 11.2.11 Dujian Xinhuadong Food
- 11.2.11.1. Overview
- 11.2.11.2. Products
- 11.2.11.3. SWOT Analysis
- 11.2.11.4. Recent Developments
- 11.2.11.5. Financials (Based on Availability)
- 11.2.12 Zhanjiang Guolian Aquatic Products
- 11.2.12.1. Overview
- 11.2.12.2. Products
- 11.2.12.3. SWOT Analysis
- 11.2.12.4. Recent Developments
- 11.2.12.5. Financials (Based on Availability)
- 11.2.13 C.P. Foods
- 11.2.13.1. Overview
- 11.2.13.2. Products
- 11.2.13.3. SWOT Analysis
- 11.2.13.4. Recent Developments
- 11.2.13.5. Financials (Based on Availability)
- 11.2.14 Oriental Ocean Sci-Tech
- 11.2.14.1. Overview
- 11.2.14.2. Products
- 11.2.14.3. SWOT Analysis
- 11.2.14.4. Recent Developments
- 11.2.14.5. Financials (Based on Availability)
- 11.2.15 Zhanjiang Guolian Aquatic Products
- 11.2.15.1. Overview
- 11.2.15.2. Products
- 11.2.15.3. SWOT Analysis
- 11.2.15.4. Recent Developments
- 11.2.15.5. Financials (Based on Availability)
- 11.2.1 Thai Union Group
List of Figures
- Figure 1: Global Crab Products Revenue Breakdown (undefined, %) by Region 2025 & 2033
- Figure 2: North America Crab Products Revenue (undefined), by Application 2025 & 2033
- Figure 3: North America Crab Products Revenue Share (%), by Application 2025 & 2033
- Figure 4: North America Crab Products Revenue (undefined), by Type 2025 & 2033
- Figure 5: North America Crab Products Revenue Share (%), by Type 2025 & 2033
- Figure 6: North America Crab Products Revenue (undefined), by Country 2025 & 2033
- Figure 7: North America Crab Products Revenue Share (%), by Country 2025 & 2033
- Figure 8: South America Crab Products Revenue (undefined), by Application 2025 & 2033
- Figure 9: South America Crab Products Revenue Share (%), by Application 2025 & 2033
- Figure 10: South America Crab Products Revenue (undefined), by Type 2025 & 2033
- Figure 11: South America Crab Products Revenue Share (%), by Type 2025 & 2033
- Figure 12: South America Crab Products Revenue (undefined), by Country 2025 & 2033
- Figure 13: South America Crab Products Revenue Share (%), by Country 2025 & 2033
- Figure 14: Europe Crab Products Revenue (undefined), by Application 2025 & 2033
- Figure 15: Europe Crab Products Revenue Share (%), by Application 2025 & 2033
- Figure 16: Europe Crab Products Revenue (undefined), by Type 2025 & 2033
- Figure 17: Europe Crab Products Revenue Share (%), by Type 2025 & 2033
- Figure 18: Europe Crab Products Revenue (undefined), by Country 2025 & 2033
- Figure 19: Europe Crab Products Revenue Share (%), by Country 2025 & 2033
- Figure 20: Middle East & Africa Crab Products Revenue (undefined), by Application 2025 & 2033
- Figure 21: Middle East & Africa Crab Products Revenue Share (%), by Application 2025 & 2033
- Figure 22: Middle East & Africa Crab Products Revenue (undefined), by Type 2025 & 2033
- Figure 23: Middle East & Africa Crab Products Revenue Share (%), by Type 2025 & 2033
- Figure 24: Middle East & Africa Crab Products Revenue (undefined), by Country 2025 & 2033
- Figure 25: Middle East & Africa Crab Products Revenue Share (%), by Country 2025 & 2033
- Figure 26: Asia Pacific Crab Products Revenue (undefined), by Application 2025 & 2033
- Figure 27: Asia Pacific Crab Products Revenue Share (%), by Application 2025 & 2033
- Figure 28: Asia Pacific Crab Products Revenue (undefined), by Type 2025 & 2033
- Figure 29: Asia Pacific Crab Products Revenue Share (%), by Type 2025 & 2033
- Figure 30: Asia Pacific Crab Products Revenue (undefined), by Country 2025 & 2033
- Figure 31: Asia Pacific Crab Products Revenue Share (%), by Country 2025 & 2033
List of Tables
- Table 1: Global Crab Products Revenue undefined Forecast, by Application 2020 & 2033
- Table 2: Global Crab Products Revenue undefined Forecast, by Type 2020 & 2033
- Table 3: Global Crab Products Revenue undefined Forecast, by Region 2020 & 2033
- Table 4: Global Crab Products Revenue undefined Forecast, by Application 2020 & 2033
- Table 5: Global Crab Products Revenue undefined Forecast, by Type 2020 & 2033
- Table 6: Global Crab Products Revenue undefined Forecast, by Country 2020 & 2033
- Table 7: United States Crab Products Revenue (undefined) Forecast, by Application 2020 & 2033
- Table 8: Canada Crab Products Revenue (undefined) Forecast, by Application 2020 & 2033
- Table 9: Mexico Crab Products Revenue (undefined) Forecast, by Application 2020 & 2033
- Table 10: Global Crab Products Revenue undefined Forecast, by Application 2020 & 2033
- Table 11: Global Crab Products Revenue undefined Forecast, by Type 2020 & 2033
- Table 12: Global Crab Products Revenue undefined Forecast, by Country 2020 & 2033
- Table 13: Brazil Crab Products Revenue (undefined) Forecast, by Application 2020 & 2033
- Table 14: Argentina Crab Products Revenue (undefined) Forecast, by Application 2020 & 2033
- Table 15: Rest of South America Crab Products Revenue (undefined) Forecast, by Application 2020 & 2033
- Table 16: Global Crab Products Revenue undefined Forecast, by Application 2020 & 2033
- Table 17: Global Crab Products Revenue undefined Forecast, by Type 2020 & 2033
- Table 18: Global Crab Products Revenue undefined Forecast, by Country 2020 & 2033
- Table 19: United Kingdom Crab Products Revenue (undefined) Forecast, by Application 2020 & 2033
- Table 20: Germany Crab Products Revenue (undefined) Forecast, by Application 2020 & 2033
- Table 21: France Crab Products Revenue (undefined) Forecast, by Application 2020 & 2033
- Table 22: Italy Crab Products Revenue (undefined) Forecast, by Application 2020 & 2033
- Table 23: Spain Crab Products Revenue (undefined) Forecast, by Application 2020 & 2033
- Table 24: Russia Crab Products Revenue (undefined) Forecast, by Application 2020 & 2033
- Table 25: Benelux Crab Products Revenue (undefined) Forecast, by Application 2020 & 2033
- Table 26: Nordics Crab Products Revenue (undefined) Forecast, by Application 2020 & 2033
- Table 27: Rest of Europe Crab Products Revenue (undefined) Forecast, by Application 2020 & 2033
- Table 28: Global Crab Products Revenue undefined Forecast, by Application 2020 & 2033
- Table 29: Global Crab Products Revenue undefined Forecast, by Type 2020 & 2033
- Table 30: Global Crab Products Revenue undefined Forecast, by Country 2020 & 2033
- Table 31: Turkey Crab Products Revenue (undefined) Forecast, by Application 2020 & 2033
- Table 32: Israel Crab Products Revenue (undefined) Forecast, by Application 2020 & 2033
- Table 33: GCC Crab Products Revenue (undefined) Forecast, by Application 2020 & 2033
- Table 34: North Africa Crab Products Revenue (undefined) Forecast, by Application 2020 & 2033
- Table 35: South Africa Crab Products Revenue (undefined) Forecast, by Application 2020 & 2033
- Table 36: Rest of Middle East & Africa Crab Products Revenue (undefined) Forecast, by Application 2020 & 2033
- Table 37: Global Crab Products Revenue undefined Forecast, by Application 2020 & 2033
- Table 38: Global Crab Products Revenue undefined Forecast, by Type 2020 & 2033
- Table 39: Global Crab Products Revenue undefined Forecast, by Country 2020 & 2033
- Table 40: China Crab Products Revenue (undefined) Forecast, by Application 2020 & 2033
- Table 41: India Crab Products Revenue (undefined) Forecast, by Application 2020 & 2033
- Table 42: Japan Crab Products Revenue (undefined) Forecast, by Application 2020 & 2033
- Table 43: South Korea Crab Products Revenue (undefined) Forecast, by Application 2020 & 2033
- Table 44: ASEAN Crab Products Revenue (undefined) Forecast, by Application 2020 & 2033
- Table 45: Oceania Crab Products Revenue (undefined) Forecast, by Application 2020 & 2033
- Table 46: Rest of Asia Pacific Crab Products Revenue (undefined) Forecast, by Application 2020 & 2033
Frequently Asked Questions
1. What is the projected Compound Annual Growth Rate (CAGR) of the Crab Products?
The projected CAGR is approximately 4.4%.
2. Which companies are prominent players in the Crab Products?
Key companies in the market include Thai Union Group, Chicken of the Sea, Bumble Bee Foods, Phillips Foods, Blue Star Foods, Aqua Star, Pacific Seafood, Trans-Ocean Products, Sea Watch International, Blue Crab Trading, Dujian Xinhuadong Food, Zhanjiang Guolian Aquatic Products, C.P. Foods, Oriental Ocean Sci-Tech, Zhanjiang Guolian Aquatic Products.
3. What are the main segments of the Crab Products?
The market segments include Application, Type.
4. Can you provide details about the market size?
The market size is estimated to be USD XXX N/A as of 2022.
5. What are some drivers contributing to market growth?
N/A
6. What are the notable trends driving market growth?
N/A
7. Are there any restraints impacting market growth?
N/A
8. Can you provide examples of recent developments in the market?
N/A
9. What pricing options are available for accessing the report?
Pricing options include single-user, multi-user, and enterprise licenses priced at USD 3950.00, USD 5925.00, and USD 7900.00 respectively.
10. Is the market size provided in terms of value or volume?
The market size is provided in terms of value, measured in N/A.
11. Are there any specific market keywords associated with the report?
Yes, the market keyword associated with the report is "Crab Products," which aids in identifying and referencing the specific market segment covered.
12. How do I determine which pricing option suits my needs best?
The pricing options vary based on user requirements and access needs. Individual users may opt for single-user licenses, while businesses requiring broader access may choose multi-user or enterprise licenses for cost-effective access to the report.
13. Are there any additional resources or data provided in the Crab Products report?
While the report offers comprehensive insights, it's advisable to review the specific contents or supplementary materials provided to ascertain if additional resources or data are available.
14. How can I stay updated on further developments or reports in the Crab Products?
To stay informed about further developments, trends, and reports in the Crab Products, consider subscribing to industry newsletters, following relevant companies and organizations, or regularly checking reputable industry news sources and publications.
Methodology
Step 1 - Identification of Relevant Samples Size from Population Database


Step 2 - Approaches for Defining Global Market Size (Value, Volume* & Price*)

Note*: In applicable scenarios
Step 3 - Data Sources
Primary Research
- Web Analytics
- Survey Reports
- Research Institute
- Latest Research Reports
- Opinion Leaders
Secondary Research
- Annual Reports
- White Paper
- Latest Press Release
- Industry Association
- Paid Database
- Investor Presentations

Step 4 - Data Triangulation
Involves using different sources of information in order to increase the validity of a study
These sources are likely to be stakeholders in a program - participants, other researchers, program staff, other community members, and so on.
Then we put all data in single framework & apply various statistical tools to find out the dynamic on the market.
During the analysis stage, feedback from the stakeholder groups would be compared to determine areas of agreement as well as areas of divergence