

Key Insights
The global Medical Power market is poised for significant expansion, projected to reach $13.74 billion in 2025 and exhibit a robust Compound Annual Growth Rate (CAGR) of 13.49% through 2033. This remarkable growth is fueled by a confluence of factors, prominently including the escalating demand for advanced diagnostic and monitoring equipment, driven by an aging global population and the increasing prevalence of chronic diseases. The surge in home healthcare solutions further amplifies this trend, as individuals seek convenient and accessible medical devices for continuous patient care. Furthermore, the relentless innovation within surgical technologies, demanding ever more precise and reliable power solutions, contributes substantially to market propulsion. The diversification of medical applications, from intricate diagnostic imaging systems to sophisticated life-support devices, necessitates highly specialized and dependable power supplies, creating a sustained demand for advanced AC-DC and DC-DC power solutions.
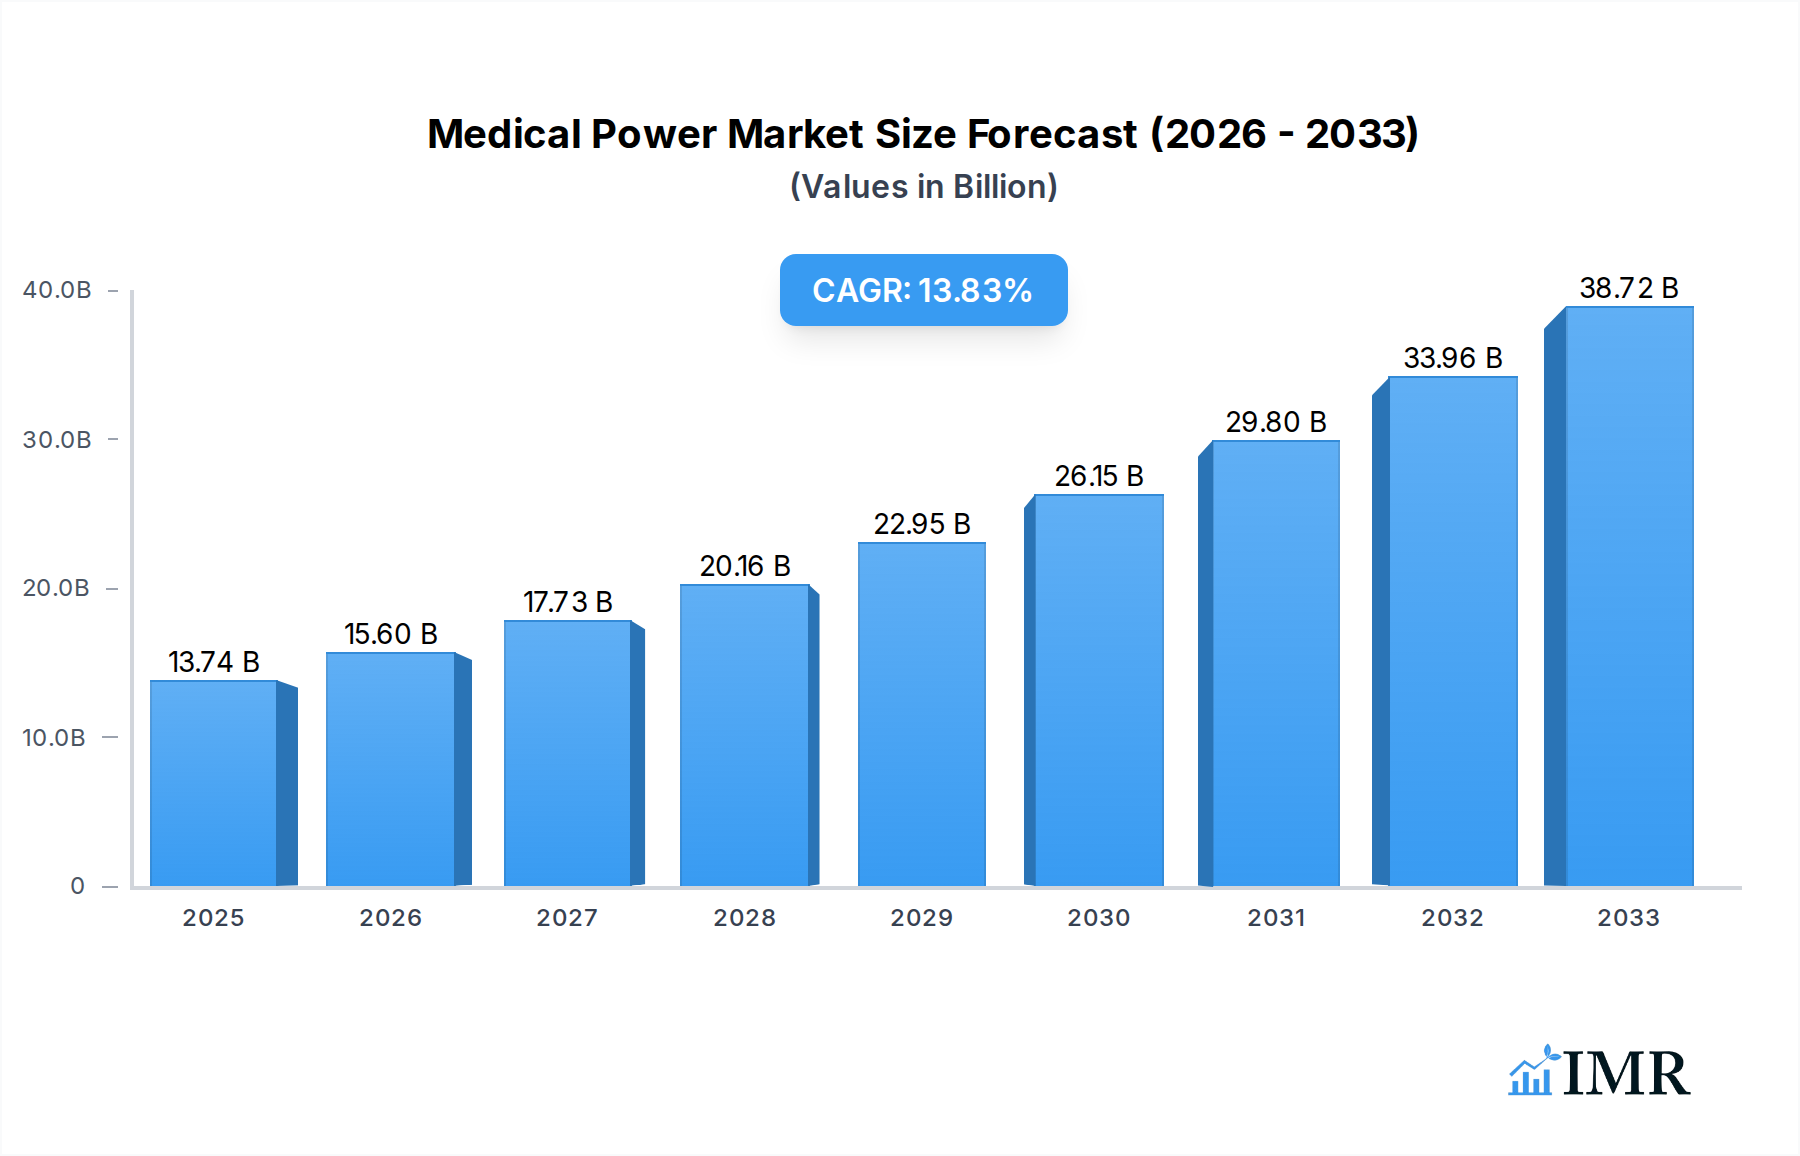
Medical Power Market Size (In Billion)
Key market drivers include the increasing adoption of telehealth and remote patient monitoring, necessitating compact and efficient power solutions for wearable devices and portable medical equipment. The growing emphasis on patient safety and regulatory compliance also spurs the development of highly reliable and secure power supplies with advanced features like isolation and surge protection. While the market exhibits strong growth, certain restraints, such as the high cost of raw materials and the stringent regulatory landscape for medical device certification, may temper the pace of expansion in specific segments. Nevertheless, the overarching trend towards digitalization in healthcare, coupled with substantial investments in R&D for innovative medical devices, ensures a dynamic and promising future for the Medical Power market. The market is segmented by application into Diagnostic & Monitoring Equipment, Home Medical Equipment, Surgical Equipment, and Dental Equipment, with AC-DC Power and DC-DC Power representing key technological types.

Medical Power Company Market Share
Medical Power Market Research Report: Navigating Innovation and Growth (2019–2033)
This comprehensive report delves into the dynamic Medical Power market, analyzing its intricate structure, growth trajectories, and future potential. With a meticulous study period spanning from 2019 to 2033, including a base year of 2025 and a forecast period of 2025–2033, this analysis provides critical insights for industry stakeholders. The report leverages high-traffic keywords and analyzes parent and child market segments, offering a robust understanding of the global medical power supply landscape. All financial values are presented in billions of USD.
Medical Power Market Dynamics & Structure
The global medical power supply market is characterized by a moderate to high level of concentration, driven by a mix of established global players and a growing number of specialized regional manufacturers. Technological innovation remains a primary driver, with continuous advancements in power density, efficiency, and safety features essential for critical medical applications. Regulatory frameworks, such as those established by the FDA, IEC, and other international bodies, play a pivotal role in shaping product development and market access, demanding stringent compliance and quality assurance. Competitive product substitutes are limited in critical applications due to safety and reliability requirements, but advancements in modular power solutions and integrated power management systems offer ongoing innovation. End-user demographics are increasingly shifting towards an aging global population, driving demand for advanced home medical equipment and sophisticated diagnostic and monitoring devices. Mergers and acquisitions (M&A) trends are notable, as larger players seek to expand their product portfolios, geographic reach, and technological capabilities, with approximately 5-7 significant M&A deals observed annually within the parent market, valued at an average of $1.5 billion per deal. Innovation barriers include the high cost of R&D, lengthy and complex regulatory approval processes, and the critical need for unwavering reliability and patient safety.
- Market Concentration: Moderate to High, with key players holding significant market share.
- Technological Innovation: Focus on miniaturization, higher efficiency, intelligent power management, and compliance with evolving safety standards.
- Regulatory Frameworks: Strict adherence to FDA, IEC, and regional medical device regulations is paramount.
- Competitive Landscape: Limited direct substitutes for critical applications; competition driven by feature sets, reliability, and compliance.
- End-User Demographics: Growing demand from aging populations and increased adoption of home healthcare solutions.
- M&A Trends: Strategic acquisitions to enhance product offerings, market access, and technological expertise.
- Innovation Barriers: High R&D costs, regulatory hurdles, and stringent safety requirements.
Medical Power Growth Trends & Insights
The global medical power supply market is poised for robust growth, projected to expand at a Compound Annual Growth Rate (CAGR) of approximately 7.5% from 2025 to 2033. This expansion is fueled by an escalating global demand for advanced healthcare solutions, driven by an aging demographic and the increasing prevalence of chronic diseases. The adoption rates of sophisticated medical devices, ranging from advanced diagnostic and monitoring equipment to sophisticated surgical systems, are rapidly increasing, directly correlating with the demand for specialized medical power supplies. Technological disruptions, such as the integration of artificial intelligence in medical devices and the rise of telehealth, are creating new avenues for innovation in power delivery, demanding smaller, more efficient, and highly reliable power solutions. Consumer behavior shifts are evident, with a growing preference for home-based medical care, necessitating compact and user-friendly medical power supplies for home medical equipment. Market penetration of advanced medical power solutions is deepening across both developed and emerging economies, as healthcare infrastructure continues to develop and upgrade. The estimated market size for medical power supplies was $25 billion in 2025 and is projected to reach $45 billion by 2033. Key market penetration metrics indicate that over 70% of new diagnostic equipment installations in 2025 incorporated highly efficient and compact power supplies, a figure expected to climb to 85% by 2033.
Dominant Regions, Countries, or Segments in Medical Power
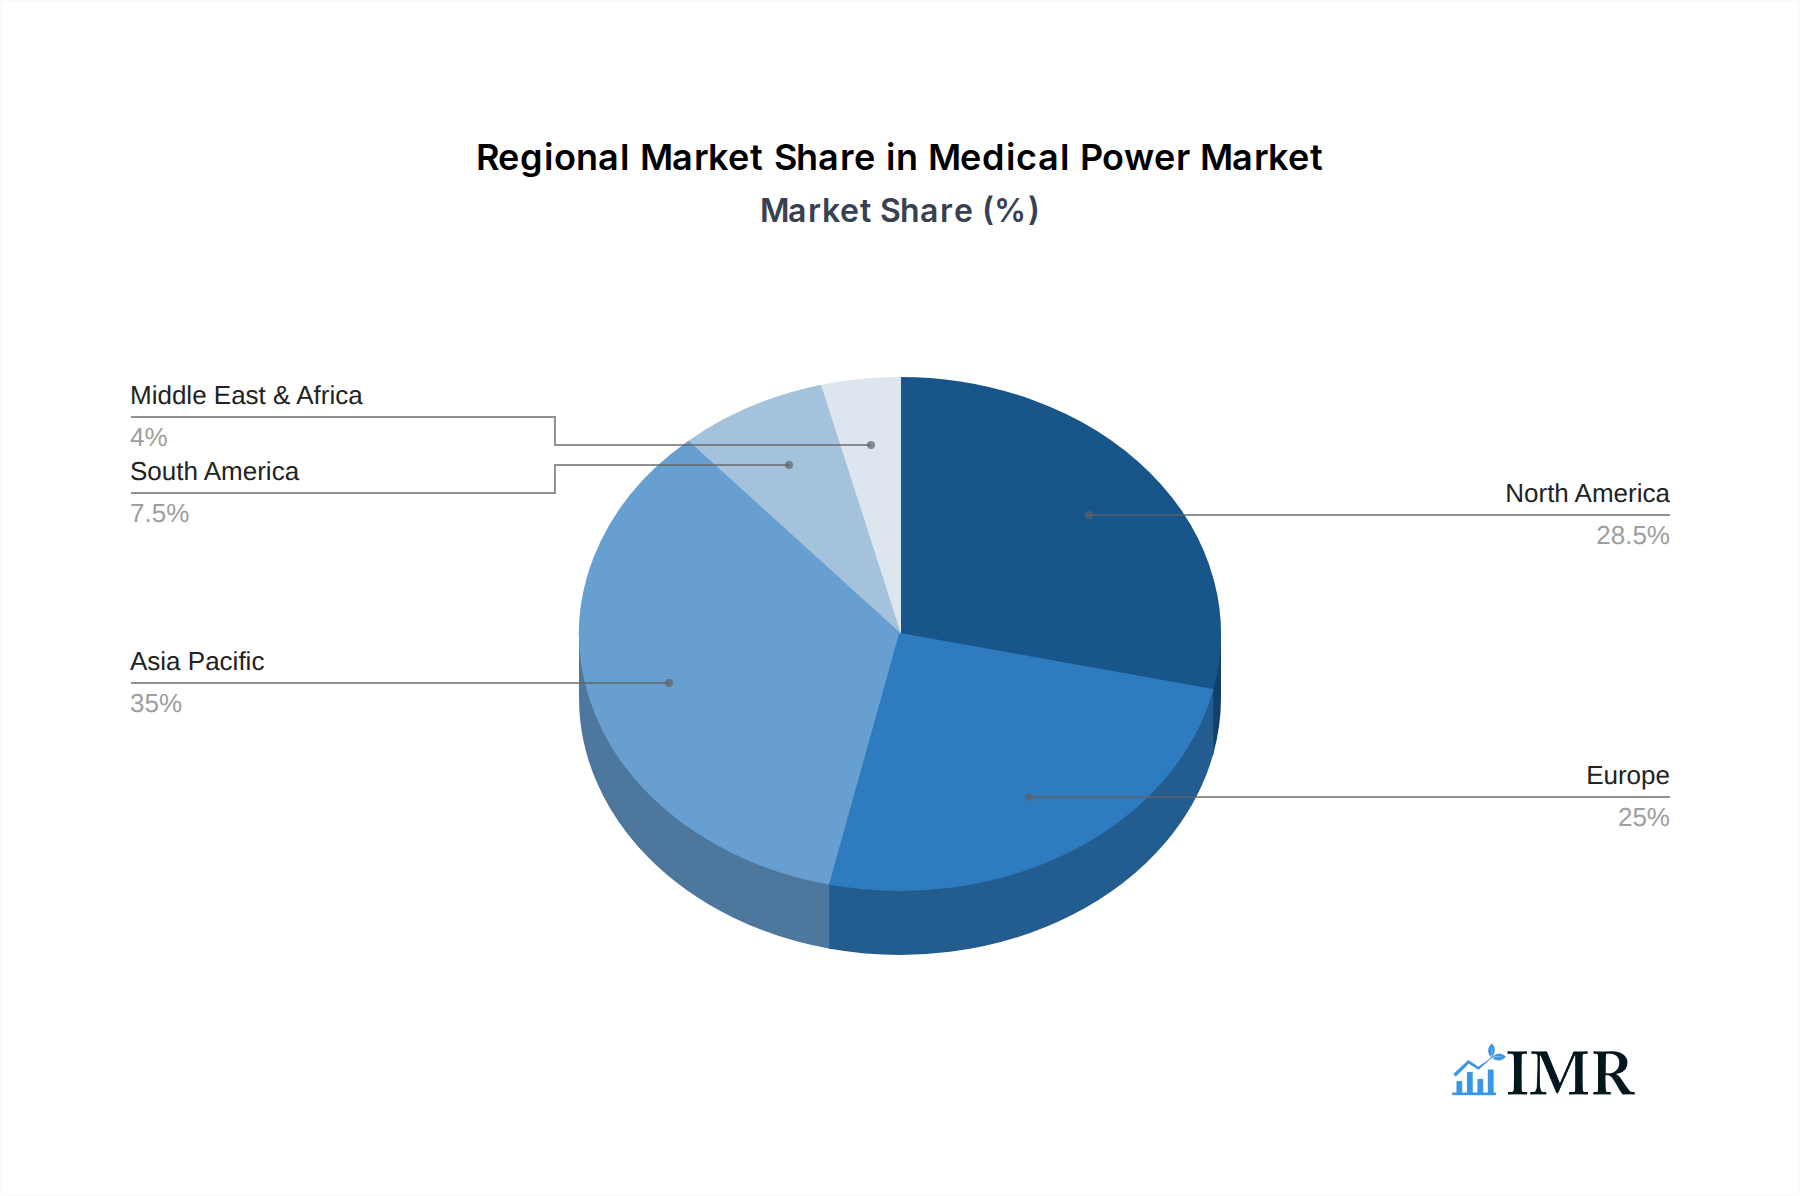
The Diagnostic & Monitoring Equipment segment is a significant driver of growth within the global medical power supply market. This segment is characterized by its critical need for precise, reliable, and often compact power solutions to support complex imaging systems, patient monitoring devices, and laboratory diagnostic instruments. North America, particularly the United States, currently dominates the medical power market, driven by its advanced healthcare infrastructure, high per capita healthcare spending, and a robust ecosystem of medical device manufacturers and research institutions.
- Dominant Segment: Diagnostic & Monitoring Equipment (Estimated market share of 35% in 2025).
- Key Drivers: Increasing demand for advanced imaging technologies (MRI, CT scans), personalized medicine, and real-time patient monitoring solutions.
- Growth Potential: High, driven by continuous innovation in sensing technology and data analytics.
- Market Value: Projected to reach $15.75 billion in 2025.
- Leading Region: North America (Estimated market share of 30% in 2025).
- Key Drivers: Significant investments in healthcare R&D, strong regulatory oversight ensuring high-quality standards, and a large installed base of medical facilities.
- Economic Policies: Favorable government policies supporting medical device innovation and healthcare access.
- Infrastructure: Well-developed healthcare infrastructure and a strong network of medical technology companies.
- Emerging Country/Region: Asia-Pacific, particularly China and India, is experiencing rapid growth due to increasing healthcare expenditure, expanding medical tourism, and a growing focus on improving domestic healthcare capabilities. This region is expected to see a CAGR of over 8.5% in the forecast period.
- Market Share Growth: Projected to increase from 25% in 2025 to 32% by 2033.
- Dominant Power Type: AC-DC Power supplies are paramount for most medical devices, providing the essential interface between mains power and the internal circuitry of medical equipment. The AC-DC segment held an estimated 70% of the market in 2025.
Medical Power Product Landscape
The medical power product landscape is defined by a relentless pursuit of miniaturization, enhanced energy efficiency, and stringent safety certifications. Innovations focus on delivering higher power density in smaller footprints, crucial for portable and implantable medical devices. Advanced features include intelligent power management, remote monitoring capabilities, and enhanced electromagnetic interference (EMI) shielding. The unique selling propositions of leading products lie in their adherence to stringent global medical standards (e.g., IEC 60601 series), low leakage current, and high reliability under continuous operation. Technological advancements are also seen in the integration of digital control, allowing for more precise power delivery and system diagnostics, particularly beneficial for complex surgical equipment and advanced diagnostic imaging systems.
Key Drivers, Barriers & Challenges in Medical Power
The medical power industry is propelled by several key drivers, including the accelerating demand for advanced healthcare technologies, the growing prevalence of chronic diseases, and the increasing shift towards home healthcare solutions. Technological advancements in power electronics and miniaturization are also significant catalysts.
Key Drivers:
- Aging Global Population: Increasing demand for medical devices for age-related conditions.
- Technological Advancements: Innovations in power density, efficiency, and safety features.
- Home Healthcare Trend: Growth in demand for reliable power for home medical equipment.
- Increased Healthcare Spending: Global investments in healthcare infrastructure and medical device development.
Key Barriers & Challenges:
- Stringent Regulatory Compliance: Navigating complex and evolving medical device regulations (e.g., FDA, CE marking) presents significant hurdles and increases time-to-market.
- High R&D Costs: Development of compliant and innovative medical power solutions requires substantial investment.
- Supply Chain Disruptions: Geopolitical events, component shortages, and logistics challenges can impact production and delivery schedules, with an estimated impact of 5-10% on production timelines.
- Competitive Pressures: Intense competition from established players and emerging regional manufacturers necessitates continuous innovation and cost optimization.
- Cybersecurity Concerns: Ensuring the security of connected medical devices and their power supplies is a growing challenge.
Emerging Opportunities in Medical Power
Emerging opportunities in the medical power market lie in the expansion of personalized medicine, the growing adoption of wearable and implantable medical devices, and the increasing demand for robust power solutions in remote and underserved regions. The integration of IoT capabilities within medical power supplies presents an avenue for enhanced device management and data collection. Furthermore, the development of ultra-compact, high-efficiency power solutions for point-of-care diagnostics and telemedicine applications offers significant untapped market potential. The market for compact AC-DC power supplies for portable diagnostic devices is expected to grow at a CAGR of 8.2% in the forecast period.
Growth Accelerators in the Medical Power Industry
Growth accelerators in the medical power industry are primarily driven by ongoing technological breakthroughs in areas like wide-bandgap semiconductors (e.g., GaN, SiC) for increased efficiency and reduced size, strategic partnerships between power supply manufacturers and medical device OEMs to co-develop tailored solutions, and aggressive market expansion strategies into high-growth emerging economies. The increasing adoption of AI and machine learning in medical diagnostics and treatment also necessitates more sophisticated and intelligent power management systems, further accelerating innovation and market growth.
Key Players Shaping the Medical Power Market
- Astrodyne TDI (US)
- CUI Inc. (US)
- Delta Electronic,Inc (TW)
- Excelsys (IE)
- Friwo Geraetebau GmbH (DE)
- Globtek Inc. (US)
- Handy and Harman Ltd. (US)
- Inventus Power (US)
- Mean Well Enterprises Co.,Ltd. (TW)
- Powerbox International AB (SE)
- Spellman High Voltage Electronics Corporation (US)
- Synqor Inc. (US)
- TDK-Lambda Corporation (JP)
- Wall Industries (US)
- XP Power (SG)
- Shenzhen LianYunda Electronics (CN)
Notable Milestones in Medical Power Sector
- 2021: TDK-Lambda introduces its new range of ultra-compact, high-density medical power supplies, addressing the growing need for miniaturization in diagnostic equipment.
- 2022: Delta Electronics announces a strategic acquisition of a specialized medical power solutions provider, expanding its footprint in the surgical equipment segment.
- 2023: XP Power launches an innovative range of medical-grade AC-DC power supplies with enhanced safety features and extended operating temperature ranges, catering to demanding applications.
- 2024: Synqor releases a series of advanced DC-DC converters designed for implantable medical devices, offering unparalleled efficiency and reliability.
- Q1 2025: CUI Inc. announces significant advancements in its medical power supply technology, focusing on cybersecurity and remote monitoring capabilities.
- Q2 2025: Mean Well Enterprises Co.,Ltd. expands its product portfolio with new medical-grade power supplies specifically designed for home medical equipment, focusing on user-friendliness and cost-effectiveness.
In-Depth Medical Power Market Outlook
The in-depth medical power market outlook is exceptionally positive, driven by sustained innovation and an unwavering demand for advanced healthcare solutions. Growth accelerators, including the adoption of wide-bandgap semiconductors, strategic OEM partnerships, and expansion into emerging markets, will continue to fuel market expansion. The increasing integration of IoT and AI into medical devices will necessitate more intelligent and connected power systems, creating significant opportunities for specialized power supply manufacturers. Future market potential lies in developing highly efficient, compact, and secure power solutions for a diverse range of medical applications, from portable diagnostics to complex surgical robotics, further solidifying the industry's critical role in global healthcare advancement. The projected market size for medical power supplies is estimated to reach $45 billion by 2033.
Medical Power Segmentation
-
1. Application
- 1.1. Diagnostic & Monitoring Equipment
- 1.2. Home Medical Equipment
- 1.3. Surgical Equipment
- 1.4. Dental Equipment
-
2. Types
- 2.1. AC-DC Power
- 2.2. DC-DC Power
Medical Power Segmentation By Geography
-
1. North America
- 1.1. United States
- 1.2. Canada
- 1.3. Mexico
-
2. South America
- 2.1. Brazil
- 2.2. Argentina
- 2.3. Rest of South America
-
3. Europe
- 3.1. United Kingdom
- 3.2. Germany
- 3.3. France
- 3.4. Italy
- 3.5. Spain
- 3.6. Russia
- 3.7. Benelux
- 3.8. Nordics
- 3.9. Rest of Europe
-
4. Middle East & Africa
- 4.1. Turkey
- 4.2. Israel
- 4.3. GCC
- 4.4. North Africa
- 4.5. South Africa
- 4.6. Rest of Middle East & Africa
-
5. Asia Pacific
- 5.1. China
- 5.2. India
- 5.3. Japan
- 5.4. South Korea
- 5.5. ASEAN
- 5.6. Oceania
- 5.7. Rest of Asia Pacific
Medical Power Regional Market Share
Geographic Coverage of Medical Power
Medical Power REPORT HIGHLIGHTS
| Aspects | Details |
|---|---|
| Study Period | 2020-2034 |
| Base Year | 2025 |
| Estimated Year | 2026 |
| Forecast Period | 2026-2034 |
| Historical Period | 2020-2025 |
| Growth Rate | CAGR of 13.49% from 2020-2034 |
| Segmentation |
|
Table of Contents
- 1. Introduction
- 1.1. Research Scope
- 1.2. Market Segmentation
- 1.3. Research Methodology
- 1.4. Definitions and Assumptions
- 2. Executive Summary
- 2.1. Introduction
- 3. Market Dynamics
- 3.1. Introduction
- 3.2. Market Drivers
- 3.3. Market Restrains
- 3.4. Market Trends
- 4. Market Factor Analysis
- 4.1. Porters Five Forces
- 4.2. Supply/Value Chain
- 4.3. PESTEL analysis
- 4.4. Market Entropy
- 4.5. Patent/Trademark Analysis
- 5. Global Medical Power Analysis, Insights and Forecast, 2020-2032
- 5.1. Market Analysis, Insights and Forecast - by Application
- 5.1.1. Diagnostic & Monitoring Equipment
- 5.1.2. Home Medical Equipment
- 5.1.3. Surgical Equipment
- 5.1.4. Dental Equipment
- 5.2. Market Analysis, Insights and Forecast - by Types
- 5.2.1. AC-DC Power
- 5.2.2. DC-DC Power
- 5.3. Market Analysis, Insights and Forecast - by Region
- 5.3.1. North America
- 5.3.2. South America
- 5.3.3. Europe
- 5.3.4. Middle East & Africa
- 5.3.5. Asia Pacific
- 5.1. Market Analysis, Insights and Forecast - by Application
- 6. North America Medical Power Analysis, Insights and Forecast, 2020-2032
- 6.1. Market Analysis, Insights and Forecast - by Application
- 6.1.1. Diagnostic & Monitoring Equipment
- 6.1.2. Home Medical Equipment
- 6.1.3. Surgical Equipment
- 6.1.4. Dental Equipment
- 6.2. Market Analysis, Insights and Forecast - by Types
- 6.2.1. AC-DC Power
- 6.2.2. DC-DC Power
- 6.1. Market Analysis, Insights and Forecast - by Application
- 7. South America Medical Power Analysis, Insights and Forecast, 2020-2032
- 7.1. Market Analysis, Insights and Forecast - by Application
- 7.1.1. Diagnostic & Monitoring Equipment
- 7.1.2. Home Medical Equipment
- 7.1.3. Surgical Equipment
- 7.1.4. Dental Equipment
- 7.2. Market Analysis, Insights and Forecast - by Types
- 7.2.1. AC-DC Power
- 7.2.2. DC-DC Power
- 7.1. Market Analysis, Insights and Forecast - by Application
- 8. Europe Medical Power Analysis, Insights and Forecast, 2020-2032
- 8.1. Market Analysis, Insights and Forecast - by Application
- 8.1.1. Diagnostic & Monitoring Equipment
- 8.1.2. Home Medical Equipment
- 8.1.3. Surgical Equipment
- 8.1.4. Dental Equipment
- 8.2. Market Analysis, Insights and Forecast - by Types
- 8.2.1. AC-DC Power
- 8.2.2. DC-DC Power
- 8.1. Market Analysis, Insights and Forecast - by Application
- 9. Middle East & Africa Medical Power Analysis, Insights and Forecast, 2020-2032
- 9.1. Market Analysis, Insights and Forecast - by Application
- 9.1.1. Diagnostic & Monitoring Equipment
- 9.1.2. Home Medical Equipment
- 9.1.3. Surgical Equipment
- 9.1.4. Dental Equipment
- 9.2. Market Analysis, Insights and Forecast - by Types
- 9.2.1. AC-DC Power
- 9.2.2. DC-DC Power
- 9.1. Market Analysis, Insights and Forecast - by Application
- 10. Asia Pacific Medical Power Analysis, Insights and Forecast, 2020-2032
- 10.1. Market Analysis, Insights and Forecast - by Application
- 10.1.1. Diagnostic & Monitoring Equipment
- 10.1.2. Home Medical Equipment
- 10.1.3. Surgical Equipment
- 10.1.4. Dental Equipment
- 10.2. Market Analysis, Insights and Forecast - by Types
- 10.2.1. AC-DC Power
- 10.2.2. DC-DC Power
- 10.1. Market Analysis, Insights and Forecast - by Application
- 11. Competitive Analysis
- 11.1. Global Market Share Analysis 2025
- 11.2. Company Profiles
- 11.2.1 Astrodyne TDI (US)
- 11.2.1.1. Overview
- 11.2.1.2. Products
- 11.2.1.3. SWOT Analysis
- 11.2.1.4. Recent Developments
- 11.2.1.5. Financials (Based on Availability)
- 11.2.2 CUI Inc. (US)
- 11.2.2.1. Overview
- 11.2.2.2. Products
- 11.2.2.3. SWOT Analysis
- 11.2.2.4. Recent Developments
- 11.2.2.5. Financials (Based on Availability)
- 11.2.3 Delta Electronic
- 11.2.3.1. Overview
- 11.2.3.2. Products
- 11.2.3.3. SWOT Analysis
- 11.2.3.4. Recent Developments
- 11.2.3.5. Financials (Based on Availability)
- 11.2.4 Inc (TW)
- 11.2.4.1. Overview
- 11.2.4.2. Products
- 11.2.4.3. SWOT Analysis
- 11.2.4.4. Recent Developments
- 11.2.4.5. Financials (Based on Availability)
- 11.2.5 Excelsys (IE)
- 11.2.5.1. Overview
- 11.2.5.2. Products
- 11.2.5.3. SWOT Analysis
- 11.2.5.4. Recent Developments
- 11.2.5.5. Financials (Based on Availability)
- 11.2.6 Friwo Geraetebau GmbH (DE)
- 11.2.6.1. Overview
- 11.2.6.2. Products
- 11.2.6.3. SWOT Analysis
- 11.2.6.4. Recent Developments
- 11.2.6.5. Financials (Based on Availability)
- 11.2.7 Globtek Inc. (US)
- 11.2.7.1. Overview
- 11.2.7.2. Products
- 11.2.7.3. SWOT Analysis
- 11.2.7.4. Recent Developments
- 11.2.7.5. Financials (Based on Availability)
- 11.2.8 Handy and Harman Ltd. (US)
- 11.2.8.1. Overview
- 11.2.8.2. Products
- 11.2.8.3. SWOT Analysis
- 11.2.8.4. Recent Developments
- 11.2.8.5. Financials (Based on Availability)
- 11.2.9 Inventus Power (US)
- 11.2.9.1. Overview
- 11.2.9.2. Products
- 11.2.9.3. SWOT Analysis
- 11.2.9.4. Recent Developments
- 11.2.9.5. Financials (Based on Availability)
- 11.2.10 Mean Well Enterprises Co.
- 11.2.10.1. Overview
- 11.2.10.2. Products
- 11.2.10.3. SWOT Analysis
- 11.2.10.4. Recent Developments
- 11.2.10.5. Financials (Based on Availability)
- 11.2.11 Ltd. (TW)
- 11.2.11.1. Overview
- 11.2.11.2. Products
- 11.2.11.3. SWOT Analysis
- 11.2.11.4. Recent Developments
- 11.2.11.5. Financials (Based on Availability)
- 11.2.12 Powerbox International AB (SE)
- 11.2.12.1. Overview
- 11.2.12.2. Products
- 11.2.12.3. SWOT Analysis
- 11.2.12.4. Recent Developments
- 11.2.12.5. Financials (Based on Availability)
- 11.2.13 Spellman High Voltage Electronics Corporation (US)
- 11.2.13.1. Overview
- 11.2.13.2. Products
- 11.2.13.3. SWOT Analysis
- 11.2.13.4. Recent Developments
- 11.2.13.5. Financials (Based on Availability)
- 11.2.14 Synqor Inc. (US)
- 11.2.14.1. Overview
- 11.2.14.2. Products
- 11.2.14.3. SWOT Analysis
- 11.2.14.4. Recent Developments
- 11.2.14.5. Financials (Based on Availability)
- 11.2.15 TDK-Lambda Corporation (JP)
- 11.2.15.1. Overview
- 11.2.15.2. Products
- 11.2.15.3. SWOT Analysis
- 11.2.15.4. Recent Developments
- 11.2.15.5. Financials (Based on Availability)
- 11.2.16 Wall Industries (US)
- 11.2.16.1. Overview
- 11.2.16.2. Products
- 11.2.16.3. SWOT Analysis
- 11.2.16.4. Recent Developments
- 11.2.16.5. Financials (Based on Availability)
- 11.2.17 XP Power (SG)
- 11.2.17.1. Overview
- 11.2.17.2. Products
- 11.2.17.3. SWOT Analysis
- 11.2.17.4. Recent Developments
- 11.2.17.5. Financials (Based on Availability)
- 11.2.18 Shenzhen LianYunda Electronics (CN)
- 11.2.18.1. Overview
- 11.2.18.2. Products
- 11.2.18.3. SWOT Analysis
- 11.2.18.4. Recent Developments
- 11.2.18.5. Financials (Based on Availability)
- 11.2.1 Astrodyne TDI (US)
List of Figures
- Figure 1: Global Medical Power Revenue Breakdown (undefined, %) by Region 2025 & 2033
- Figure 2: Global Medical Power Volume Breakdown (K, %) by Region 2025 & 2033
- Figure 3: North America Medical Power Revenue (undefined), by Application 2025 & 2033
- Figure 4: North America Medical Power Volume (K), by Application 2025 & 2033
- Figure 5: North America Medical Power Revenue Share (%), by Application 2025 & 2033
- Figure 6: North America Medical Power Volume Share (%), by Application 2025 & 2033
- Figure 7: North America Medical Power Revenue (undefined), by Types 2025 & 2033
- Figure 8: North America Medical Power Volume (K), by Types 2025 & 2033
- Figure 9: North America Medical Power Revenue Share (%), by Types 2025 & 2033
- Figure 10: North America Medical Power Volume Share (%), by Types 2025 & 2033
- Figure 11: North America Medical Power Revenue (undefined), by Country 2025 & 2033
- Figure 12: North America Medical Power Volume (K), by Country 2025 & 2033
- Figure 13: North America Medical Power Revenue Share (%), by Country 2025 & 2033
- Figure 14: North America Medical Power Volume Share (%), by Country 2025 & 2033
- Figure 15: South America Medical Power Revenue (undefined), by Application 2025 & 2033
- Figure 16: South America Medical Power Volume (K), by Application 2025 & 2033
- Figure 17: South America Medical Power Revenue Share (%), by Application 2025 & 2033
- Figure 18: South America Medical Power Volume Share (%), by Application 2025 & 2033
- Figure 19: South America Medical Power Revenue (undefined), by Types 2025 & 2033
- Figure 20: South America Medical Power Volume (K), by Types 2025 & 2033
- Figure 21: South America Medical Power Revenue Share (%), by Types 2025 & 2033
- Figure 22: South America Medical Power Volume Share (%), by Types 2025 & 2033
- Figure 23: South America Medical Power Revenue (undefined), by Country 2025 & 2033
- Figure 24: South America Medical Power Volume (K), by Country 2025 & 2033
- Figure 25: South America Medical Power Revenue Share (%), by Country 2025 & 2033
- Figure 26: South America Medical Power Volume Share (%), by Country 2025 & 2033
- Figure 27: Europe Medical Power Revenue (undefined), by Application 2025 & 2033
- Figure 28: Europe Medical Power Volume (K), by Application 2025 & 2033
- Figure 29: Europe Medical Power Revenue Share (%), by Application 2025 & 2033
- Figure 30: Europe Medical Power Volume Share (%), by Application 2025 & 2033
- Figure 31: Europe Medical Power Revenue (undefined), by Types 2025 & 2033
- Figure 32: Europe Medical Power Volume (K), by Types 2025 & 2033
- Figure 33: Europe Medical Power Revenue Share (%), by Types 2025 & 2033
- Figure 34: Europe Medical Power Volume Share (%), by Types 2025 & 2033
- Figure 35: Europe Medical Power Revenue (undefined), by Country 2025 & 2033
- Figure 36: Europe Medical Power Volume (K), by Country 2025 & 2033
- Figure 37: Europe Medical Power Revenue Share (%), by Country 2025 & 2033
- Figure 38: Europe Medical Power Volume Share (%), by Country 2025 & 2033
- Figure 39: Middle East & Africa Medical Power Revenue (undefined), by Application 2025 & 2033
- Figure 40: Middle East & Africa Medical Power Volume (K), by Application 2025 & 2033
- Figure 41: Middle East & Africa Medical Power Revenue Share (%), by Application 2025 & 2033
- Figure 42: Middle East & Africa Medical Power Volume Share (%), by Application 2025 & 2033
- Figure 43: Middle East & Africa Medical Power Revenue (undefined), by Types 2025 & 2033
- Figure 44: Middle East & Africa Medical Power Volume (K), by Types 2025 & 2033
- Figure 45: Middle East & Africa Medical Power Revenue Share (%), by Types 2025 & 2033
- Figure 46: Middle East & Africa Medical Power Volume Share (%), by Types 2025 & 2033
- Figure 47: Middle East & Africa Medical Power Revenue (undefined), by Country 2025 & 2033
- Figure 48: Middle East & Africa Medical Power Volume (K), by Country 2025 & 2033
- Figure 49: Middle East & Africa Medical Power Revenue Share (%), by Country 2025 & 2033
- Figure 50: Middle East & Africa Medical Power Volume Share (%), by Country 2025 & 2033
- Figure 51: Asia Pacific Medical Power Revenue (undefined), by Application 2025 & 2033
- Figure 52: Asia Pacific Medical Power Volume (K), by Application 2025 & 2033
- Figure 53: Asia Pacific Medical Power Revenue Share (%), by Application 2025 & 2033
- Figure 54: Asia Pacific Medical Power Volume Share (%), by Application 2025 & 2033
- Figure 55: Asia Pacific Medical Power Revenue (undefined), by Types 2025 & 2033
- Figure 56: Asia Pacific Medical Power Volume (K), by Types 2025 & 2033
- Figure 57: Asia Pacific Medical Power Revenue Share (%), by Types 2025 & 2033
- Figure 58: Asia Pacific Medical Power Volume Share (%), by Types 2025 & 2033
- Figure 59: Asia Pacific Medical Power Revenue (undefined), by Country 2025 & 2033
- Figure 60: Asia Pacific Medical Power Volume (K), by Country 2025 & 2033
- Figure 61: Asia Pacific Medical Power Revenue Share (%), by Country 2025 & 2033
- Figure 62: Asia Pacific Medical Power Volume Share (%), by Country 2025 & 2033
List of Tables
- Table 1: Global Medical Power Revenue undefined Forecast, by Application 2020 & 2033
- Table 2: Global Medical Power Volume K Forecast, by Application 2020 & 2033
- Table 3: Global Medical Power Revenue undefined Forecast, by Types 2020 & 2033
- Table 4: Global Medical Power Volume K Forecast, by Types 2020 & 2033
- Table 5: Global Medical Power Revenue undefined Forecast, by Region 2020 & 2033
- Table 6: Global Medical Power Volume K Forecast, by Region 2020 & 2033
- Table 7: Global Medical Power Revenue undefined Forecast, by Application 2020 & 2033
- Table 8: Global Medical Power Volume K Forecast, by Application 2020 & 2033
- Table 9: Global Medical Power Revenue undefined Forecast, by Types 2020 & 2033
- Table 10: Global Medical Power Volume K Forecast, by Types 2020 & 2033
- Table 11: Global Medical Power Revenue undefined Forecast, by Country 2020 & 2033
- Table 12: Global Medical Power Volume K Forecast, by Country 2020 & 2033
- Table 13: United States Medical Power Revenue (undefined) Forecast, by Application 2020 & 2033
- Table 14: United States Medical Power Volume (K) Forecast, by Application 2020 & 2033
- Table 15: Canada Medical Power Revenue (undefined) Forecast, by Application 2020 & 2033
- Table 16: Canada Medical Power Volume (K) Forecast, by Application 2020 & 2033
- Table 17: Mexico Medical Power Revenue (undefined) Forecast, by Application 2020 & 2033
- Table 18: Mexico Medical Power Volume (K) Forecast, by Application 2020 & 2033
- Table 19: Global Medical Power Revenue undefined Forecast, by Application 2020 & 2033
- Table 20: Global Medical Power Volume K Forecast, by Application 2020 & 2033
- Table 21: Global Medical Power Revenue undefined Forecast, by Types 2020 & 2033
- Table 22: Global Medical Power Volume K Forecast, by Types 2020 & 2033
- Table 23: Global Medical Power Revenue undefined Forecast, by Country 2020 & 2033
- Table 24: Global Medical Power Volume K Forecast, by Country 2020 & 2033
- Table 25: Brazil Medical Power Revenue (undefined) Forecast, by Application 2020 & 2033
- Table 26: Brazil Medical Power Volume (K) Forecast, by Application 2020 & 2033
- Table 27: Argentina Medical Power Revenue (undefined) Forecast, by Application 2020 & 2033
- Table 28: Argentina Medical Power Volume (K) Forecast, by Application 2020 & 2033
- Table 29: Rest of South America Medical Power Revenue (undefined) Forecast, by Application 2020 & 2033
- Table 30: Rest of South America Medical Power Volume (K) Forecast, by Application 2020 & 2033
- Table 31: Global Medical Power Revenue undefined Forecast, by Application 2020 & 2033
- Table 32: Global Medical Power Volume K Forecast, by Application 2020 & 2033
- Table 33: Global Medical Power Revenue undefined Forecast, by Types 2020 & 2033
- Table 34: Global Medical Power Volume K Forecast, by Types 2020 & 2033
- Table 35: Global Medical Power Revenue undefined Forecast, by Country 2020 & 2033
- Table 36: Global Medical Power Volume K Forecast, by Country 2020 & 2033
- Table 37: United Kingdom Medical Power Revenue (undefined) Forecast, by Application 2020 & 2033
- Table 38: United Kingdom Medical Power Volume (K) Forecast, by Application 2020 & 2033
- Table 39: Germany Medical Power Revenue (undefined) Forecast, by Application 2020 & 2033
- Table 40: Germany Medical Power Volume (K) Forecast, by Application 2020 & 2033
- Table 41: France Medical Power Revenue (undefined) Forecast, by Application 2020 & 2033
- Table 42: France Medical Power Volume (K) Forecast, by Application 2020 & 2033
- Table 43: Italy Medical Power Revenue (undefined) Forecast, by Application 2020 & 2033
- Table 44: Italy Medical Power Volume (K) Forecast, by Application 2020 & 2033
- Table 45: Spain Medical Power Revenue (undefined) Forecast, by Application 2020 & 2033
- Table 46: Spain Medical Power Volume (K) Forecast, by Application 2020 & 2033
- Table 47: Russia Medical Power Revenue (undefined) Forecast, by Application 2020 & 2033
- Table 48: Russia Medical Power Volume (K) Forecast, by Application 2020 & 2033
- Table 49: Benelux Medical Power Revenue (undefined) Forecast, by Application 2020 & 2033
- Table 50: Benelux Medical Power Volume (K) Forecast, by Application 2020 & 2033
- Table 51: Nordics Medical Power Revenue (undefined) Forecast, by Application 2020 & 2033
- Table 52: Nordics Medical Power Volume (K) Forecast, by Application 2020 & 2033
- Table 53: Rest of Europe Medical Power Revenue (undefined) Forecast, by Application 2020 & 2033
- Table 54: Rest of Europe Medical Power Volume (K) Forecast, by Application 2020 & 2033
- Table 55: Global Medical Power Revenue undefined Forecast, by Application 2020 & 2033
- Table 56: Global Medical Power Volume K Forecast, by Application 2020 & 2033
- Table 57: Global Medical Power Revenue undefined Forecast, by Types 2020 & 2033
- Table 58: Global Medical Power Volume K Forecast, by Types 2020 & 2033
- Table 59: Global Medical Power Revenue undefined Forecast, by Country 2020 & 2033
- Table 60: Global Medical Power Volume K Forecast, by Country 2020 & 2033
- Table 61: Turkey Medical Power Revenue (undefined) Forecast, by Application 2020 & 2033
- Table 62: Turkey Medical Power Volume (K) Forecast, by Application 2020 & 2033
- Table 63: Israel Medical Power Revenue (undefined) Forecast, by Application 2020 & 2033
- Table 64: Israel Medical Power Volume (K) Forecast, by Application 2020 & 2033
- Table 65: GCC Medical Power Revenue (undefined) Forecast, by Application 2020 & 2033
- Table 66: GCC Medical Power Volume (K) Forecast, by Application 2020 & 2033
- Table 67: North Africa Medical Power Revenue (undefined) Forecast, by Application 2020 & 2033
- Table 68: North Africa Medical Power Volume (K) Forecast, by Application 2020 & 2033
- Table 69: South Africa Medical Power Revenue (undefined) Forecast, by Application 2020 & 2033
- Table 70: South Africa Medical Power Volume (K) Forecast, by Application 2020 & 2033
- Table 71: Rest of Middle East & Africa Medical Power Revenue (undefined) Forecast, by Application 2020 & 2033
- Table 72: Rest of Middle East & Africa Medical Power Volume (K) Forecast, by Application 2020 & 2033
- Table 73: Global Medical Power Revenue undefined Forecast, by Application 2020 & 2033
- Table 74: Global Medical Power Volume K Forecast, by Application 2020 & 2033
- Table 75: Global Medical Power Revenue undefined Forecast, by Types 2020 & 2033
- Table 76: Global Medical Power Volume K Forecast, by Types 2020 & 2033
- Table 77: Global Medical Power Revenue undefined Forecast, by Country 2020 & 2033
- Table 78: Global Medical Power Volume K Forecast, by Country 2020 & 2033
- Table 79: China Medical Power Revenue (undefined) Forecast, by Application 2020 & 2033
- Table 80: China Medical Power Volume (K) Forecast, by Application 2020 & 2033
- Table 81: India Medical Power Revenue (undefined) Forecast, by Application 2020 & 2033
- Table 82: India Medical Power Volume (K) Forecast, by Application 2020 & 2033
- Table 83: Japan Medical Power Revenue (undefined) Forecast, by Application 2020 & 2033
- Table 84: Japan Medical Power Volume (K) Forecast, by Application 2020 & 2033
- Table 85: South Korea Medical Power Revenue (undefined) Forecast, by Application 2020 & 2033
- Table 86: South Korea Medical Power Volume (K) Forecast, by Application 2020 & 2033
- Table 87: ASEAN Medical Power Revenue (undefined) Forecast, by Application 2020 & 2033
- Table 88: ASEAN Medical Power Volume (K) Forecast, by Application 2020 & 2033
- Table 89: Oceania Medical Power Revenue (undefined) Forecast, by Application 2020 & 2033
- Table 90: Oceania Medical Power Volume (K) Forecast, by Application 2020 & 2033
- Table 91: Rest of Asia Pacific Medical Power Revenue (undefined) Forecast, by Application 2020 & 2033
- Table 92: Rest of Asia Pacific Medical Power Volume (K) Forecast, by Application 2020 & 2033
Frequently Asked Questions
1. What is the projected Compound Annual Growth Rate (CAGR) of the Medical Power?
The projected CAGR is approximately 13.49%.
2. Which companies are prominent players in the Medical Power?
Key companies in the market include Astrodyne TDI (US), CUI Inc. (US), Delta Electronic, Inc (TW), Excelsys (IE), Friwo Geraetebau GmbH (DE), Globtek Inc. (US), Handy and Harman Ltd. (US), Inventus Power (US), Mean Well Enterprises Co., Ltd. (TW), Powerbox International AB (SE), Spellman High Voltage Electronics Corporation (US), Synqor Inc. (US), TDK-Lambda Corporation (JP), Wall Industries (US), XP Power (SG), Shenzhen LianYunda Electronics (CN).
3. What are the main segments of the Medical Power?
The market segments include Application, Types.
4. Can you provide details about the market size?
The market size is estimated to be USD XXX N/A as of 2022.
5. What are some drivers contributing to market growth?
N/A
6. What are the notable trends driving market growth?
N/A
7. Are there any restraints impacting market growth?
N/A
8. Can you provide examples of recent developments in the market?
N/A
9. What pricing options are available for accessing the report?
Pricing options include single-user, multi-user, and enterprise licenses priced at USD 3950.00, USD 5925.00, and USD 7900.00 respectively.
10. Is the market size provided in terms of value or volume?
The market size is provided in terms of value, measured in N/A and volume, measured in K.
11. Are there any specific market keywords associated with the report?
Yes, the market keyword associated with the report is "Medical Power," which aids in identifying and referencing the specific market segment covered.
12. How do I determine which pricing option suits my needs best?
The pricing options vary based on user requirements and access needs. Individual users may opt for single-user licenses, while businesses requiring broader access may choose multi-user or enterprise licenses for cost-effective access to the report.
13. Are there any additional resources or data provided in the Medical Power report?
While the report offers comprehensive insights, it's advisable to review the specific contents or supplementary materials provided to ascertain if additional resources or data are available.
14. How can I stay updated on further developments or reports in the Medical Power?
To stay informed about further developments, trends, and reports in the Medical Power, consider subscribing to industry newsletters, following relevant companies and organizations, or regularly checking reputable industry news sources and publications.
Methodology
Step 1 - Identification of Relevant Samples Size from Population Database


Step 2 - Approaches for Defining Global Market Size (Value, Volume* & Price*)

Note*: In applicable scenarios
Step 3 - Data Sources
Primary Research
- Web Analytics
- Survey Reports
- Research Institute
- Latest Research Reports
- Opinion Leaders
Secondary Research
- Annual Reports
- White Paper
- Latest Press Release
- Industry Association
- Paid Database
- Investor Presentations

Step 4 - Data Triangulation
Involves using different sources of information in order to increase the validity of a study
These sources are likely to be stakeholders in a program - participants, other researchers, program staff, other community members, and so on.
Then we put all data in single framework & apply various statistical tools to find out the dynamic on the market.
During the analysis stage, feedback from the stakeholder groups would be compared to determine areas of agreement as well as areas of divergence