

Key Insights
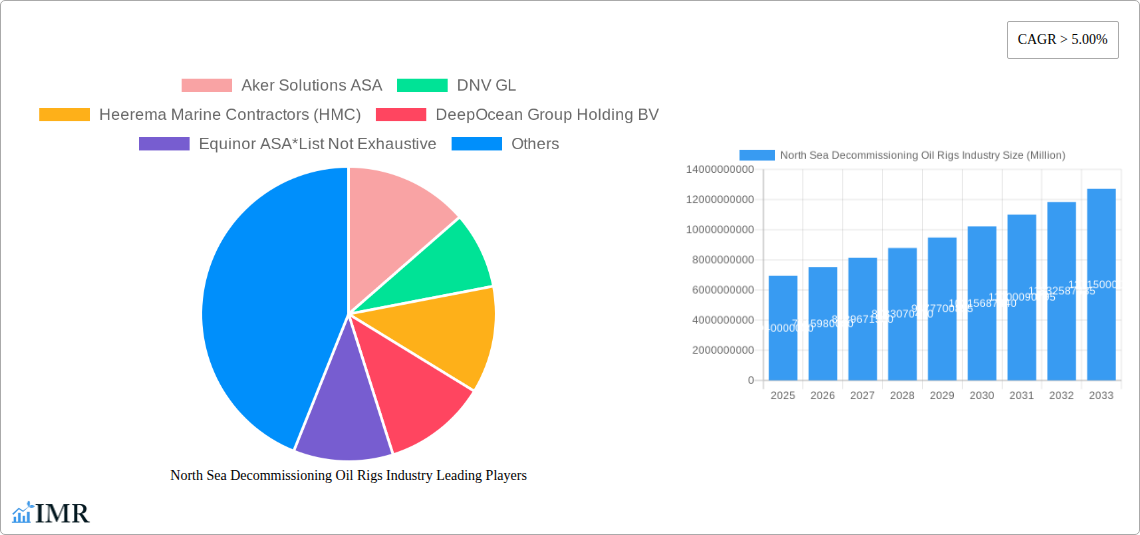
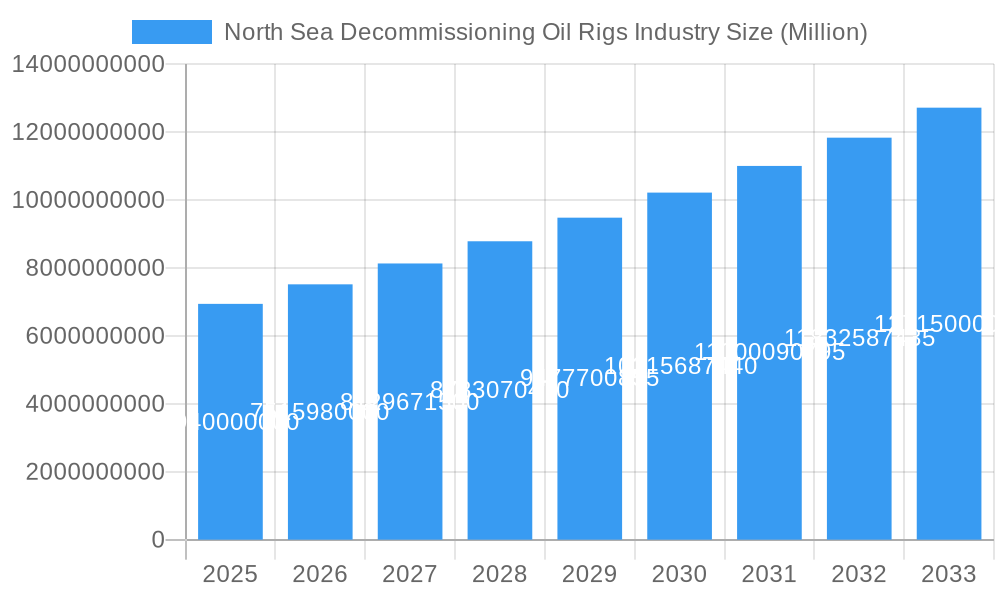
The North Sea Decommissioning Oil Rigs Industry is poised for substantial growth, driven by an aging offshore infrastructure and evolving environmental regulations. With a current market size of $6.94 billion in 2025, the industry is projected to expand at a robust CAGR of 8.2% through 2033. This upward trajectory is primarily fueled by the increasing necessity to safely and responsibly dismantle mature oil and gas platforms. Key drivers include stringent government mandates for offshore environmental protection, the economic imperative to free up valuable subsea space, and the technological advancements that are making decommissioning operations more efficient and cost-effective. The industry is segmented by water depth, with shallow water, deepwater, and ultra-deepwater operations all presenting unique challenges and opportunities. Geographically, the United Kingdom and Norway represent the dominant markets due to their extensive offshore oil and gas history in the North Sea, with the "Rest of North Sea" region also contributing significantly to market demand. Leading companies such as Aker Solutions ASA, DNV GL, and Heerema Marine Contractors (HMC) are at the forefront, investing in innovative solutions and expanding their capabilities to meet the growing demand for their services.
North Sea Decommissioning Oil Rigs Industry Market Size (In Billion)
The future outlook for the North Sea Decommissioning Oil Rigs Industry is characterized by a shift towards more complex and integrated decommissioning projects. While the increasing volume of aging assets serves as a primary growth catalyst, the industry also faces certain restraints. These include the high upfront costs associated with decommissioning, the logistical complexities of operating in harsh offshore environments, and the potential for fluctuating oil prices which can impact investment decisions. However, advancements in robotics, modular dismantling techniques, and specialized vessel development are helping to mitigate these challenges. The ongoing investment in research and development by key players like TechnipFMC PLC and John Wood Group PLC is critical in overcoming these hurdles and ensuring the sustainable and efficient execution of decommissioning projects. As the energy landscape continues to evolve, the decommissioning sector in the North Sea is set to become an increasingly vital and dynamic component of the offshore energy value chain.
North Sea Decommissioning Oil Rigs Industry Company Market Share
North Sea Decommissioning Oil Rigs Industry: Comprehensive Market Analysis & Future Outlook (2019–2033)
This report offers an in-depth analysis of the North Sea Decommissioning Oil Rigs Industry, providing critical insights into market dynamics, growth trends, regional dominance, product landscape, and future opportunities. Covering the study period from 2019 to 2033, with a base and estimated year of 2025, this report is an indispensable resource for stakeholders seeking to understand and capitalize on the evolving decommissioning market. We meticulously analyze market size, competitive landscape, technological advancements, and regulatory impacts, presenting data in billion-unit figures for clarity.
North Sea Decommissioning Oil Rigs Industry Market Dynamics & Structure
The North Sea Decommissioning Oil Rigs Industry is characterized by a moderate to high market concentration, with key players investing heavily in technological innovation and strategic acquisitions to secure a competitive edge. Regulatory frameworks, driven by environmental concerns and aging infrastructure, are becoming increasingly stringent, accelerating the demand for efficient and safe decommissioning solutions. Technological innovation, particularly in robotics, AI-driven analytics for structural integrity assessment, and advanced cutting/removal techniques, is a primary driver, aiming to reduce costs and minimize environmental impact. Competitive product substitutes are emerging, including advanced recycling technologies and innovative repurposing of offshore structures, challenging traditional removal methods. End-user demographics are shifting towards a greater emphasis on cost-effectiveness, environmental stewardship, and risk mitigation. Mergers and acquisitions (M&A) activity is notable, as companies seek to consolidate expertise, expand service offerings, and achieve economies of scale in this complex and capital-intensive sector.
- Market Concentration: Dominated by a handful of specialized service providers, but with increasing fragmentation due to new entrants.
- Technological Innovation Drivers: Environmental regulations, cost reduction mandates, safety enhancements, and development of subsea robotics.
- Regulatory Frameworks: Stricter environmental compliance, decommissioning liability management, and international maritime regulations.
- Competitive Product Substitutes: Advanced offshore recycling technologies, in-situ stabilization, and potential for repurposing of platforms.
- End-User Demographics: Oil and gas operators, government regulatory bodies, and environmental protection agencies.
- M&A Trends: Consolidation of niche service providers, acquisition of innovative technologies, and strategic alliances to offer end-to-end solutions.
North Sea Decommissioning Oil Rigs Industry Growth Trends & Insights
The North Sea Decommissioning Oil Rigs Industry is poised for significant growth, driven by the aging lifecycle of numerous offshore oil and gas assets. The market size is projected to expand considerably, propelled by an increasing number of wells reaching their economic limit and stringent regulatory pressures compelling operators to decommission. Adoption rates for specialized decommissioning services are on an upward trajectory, as companies recognize the necessity of expert intervention for complex offshore operations. Technological disruptions are playing a pivotal role, with advancements in autonomous underwater vehicles (AUVs), remotely operated vehicles (ROVs), and cutting-edge materials science enabling safer, more efficient, and cost-effective decommissioning processes. Consumer behavior, or rather operator behavior, is shifting towards a more proactive and strategic approach to decommissioning planning, integrating it earlier into asset lifecycle management to optimize costs and mitigate future liabilities. This proactive stance is reflected in increasing investments in specialized decommissioning vessels and cutting-edge removal technologies. Market penetration of advanced decommissioning solutions is expected to deepen as the benefits of reduced risk and environmental impact become more apparent. The CAGR is projected to witness a robust upward trend over the forecast period, fueled by an expanding decommissioning pipeline.
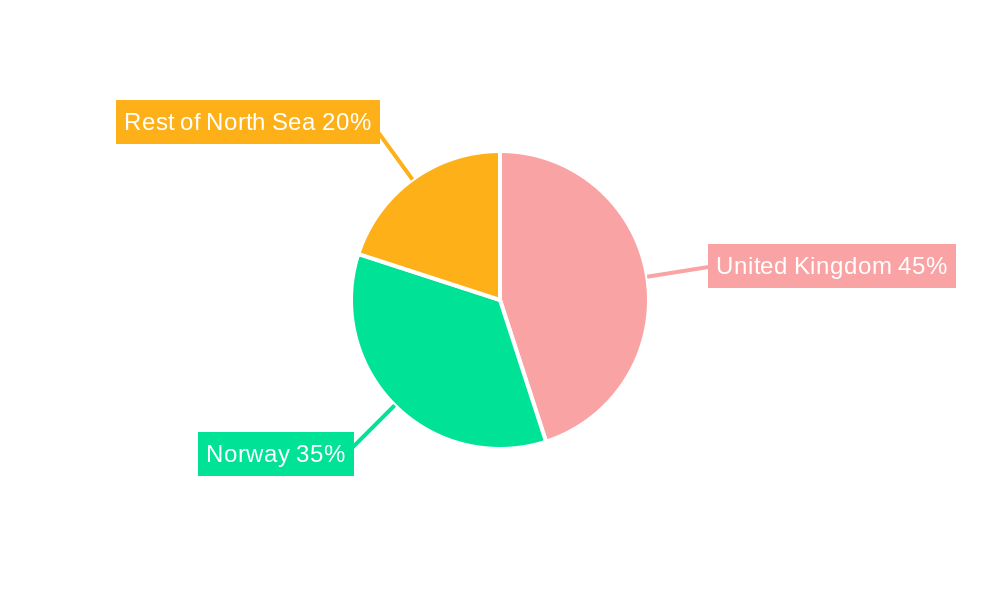
Dominant Regions, Countries, or Segments in North Sea Decommissioning Oil Rigs Industry
The United Kingdom stands as the dominant region in the North Sea Decommissioning Oil Rigs Industry, driven by its extensive offshore oil and gas history and a proactive regulatory environment. This dominance is underpinned by a substantial inventory of aging platforms and pipelines in its sector of the North Sea, necessitating extensive decommissioning activities. Norway also plays a crucial role, with significant offshore infrastructure requiring decommissioning, bolstered by strong government support for sustainable energy practices and technological innovation in the sector. The "Rest of North Sea" segment, encompassing countries like Denmark and the Netherlands, also contributes to the overall market, though to a lesser extent.
Within the segmentation by water depth, Deepwater and Ultra-deepwater decommissioning present unique challenges and opportunities, often requiring more sophisticated technologies and specialized vessels, leading to higher market values in these segments. Shallow Water decommissioning, while perhaps less technologically complex, involves a larger volume of assets, contributing significantly to overall market activity and value.
- United Kingdom:
- Key Drivers: Large installed base of aging offshore assets, stringent regulatory framework (e.g., Oil and Gas Authority directives), significant decommissioning expenditure from major operators.
- Market Share: Holds the largest share of decommissioning projects and associated expenditure.
- Growth Potential: Continued pipeline of late-life assets ensures sustained demand.
- Norway:
- Key Drivers: Significant offshore production history, focus on environmental responsibility, government incentives for decommissioning and technology development.
- Market Share: Second largest market share, with a growing emphasis on complex projects.
- Growth Potential: Advancements in green decommissioning and circular economy principles.
- Rest of North Sea (Denmark, Netherlands, etc.):
- Key Drivers: Smaller but active offshore sectors, evolving regulatory landscapes.
- Market Share: Contributes a smaller but important portion of the overall market.
- Growth Potential: Driven by individual country policies and specific asset retirements.
- Segmentation by Water Depth:
- Deepwater and Ultra-deepwater:
- Key Drivers: Complex engineering challenges, specialized heavy-lift vessels, advanced subsea robotics.
- Market Share: Higher value per project due to technological requirements.
- Growth Potential: Increasing number of deepwater assets reaching end-of-life.
- Shallow Water:
- Key Drivers: Higher volume of smaller structures and pipelines, established removal techniques.
- Market Share: Significant activity volume.
- Growth Potential: Continuous retirement of near-shore and older platforms.
- Deepwater and Ultra-deepwater:
North Sea Decommissioning Oil Rigs Industry Product Landscape
The product landscape in the North Sea Decommissioning Oil Rigs Industry is defined by innovative solutions for asset removal, recycling, and environmental remediation. Advanced subsea cutting tools, high-capacity lifting equipment, and specialized decommissioning vessels are at the forefront. Innovations also include sophisticated software for planning and execution, AI-powered risk assessment tools, and materials science advancements for handling hazardous components. The focus is on minimizing environmental impact through containment technologies, responsible waste management, and the development of techniques for material repurposing. Performance metrics emphasize safety, efficiency, cost-effectiveness, and compliance with stringent environmental standards.
Key Drivers, Barriers & Challenges in North Sea Decommissioning Oil Rigs Industry
Key Drivers: The North Sea Decommissioning Oil Rigs Industry is primarily propelled by the aging infrastructure of existing oil and gas fields, leading to an inevitable increase in decommissioning obligations. Strict environmental regulations from bodies like the OSPAR Commission and national authorities are a major catalyst, pushing operators to remove redundant structures responsibly. Technological advancements in robotics, heavy-lift capabilities, and cutting techniques are making decommissioning more feasible and cost-effective. Economic drivers include the desire to free up valuable seabed space and to monetize residual materials.
Barriers & Challenges: Significant barriers include the immense capital expenditure required for decommissioning projects, often running into billions of dollars per platform. The inherent complexity and inherent risks associated with offshore operations, particularly in harsh North Sea conditions, pose substantial safety challenges. Regulatory uncertainty and evolving compliance requirements can also create hurdles for long-term planning. Supply chain constraints, including the availability of specialized vessels and skilled personnel, can impact project timelines and costs. Competitive pressures among decommissioning service providers can also lead to price wars, impacting profitability.
Emerging Opportunities in North Sea Decommissioning Oil Rigs Industry
Emerging opportunities lie in the development and adoption of greener decommissioning techniques, focusing on circular economy principles such as material reuse and recycling. The growing demand for integrated decommissioning solutions, encompassing planning, execution, and waste management, presents a significant market for comprehensive service providers. Innovations in subsea robotics and autonomous systems offer potential for reduced operational risks and costs, particularly in deepwater environments. Furthermore, the increasing focus on environmental stewardship is creating opportunities for companies offering advanced monitoring and remediation services. The potential repurposing of offshore structures for renewable energy platforms (e.g., wind farms) is an emerging, albeit nascent, opportunity.
Growth Accelerators in the North Sea Decommissioning Oil Rigs Industry Industry
Long-term growth in the North Sea Decommissioning Oil Rigs Industry will be accelerated by continued technological breakthroughs in automation and remote operations, reducing human exposure to risk. Strategic partnerships between oil and gas operators and specialized decommissioning companies will foster greater collaboration and efficiency in planning and execution. Market expansion strategies will likely involve developing standardized decommissioning modules and technologies that can be adapted across different asset types. Furthermore, the increasing global emphasis on sustainability and the energy transition will drive demand for environmentally responsible decommissioning practices, creating a competitive advantage for innovative service providers. Investment in research and development for novel cutting and removal methods will also be a key accelerator.
Key Players Shaping the North Sea Decommissioning Oil Rigs Industry Market
- Aker Solutions ASA
- DNV GL
- Heerema Marine Contractors (HMC)
- DeepOcean Group Holding BV
- Equinor ASA
- Able UK
- John Wood Group PLC
- TechnipFMC PLC
- AF Gruppen SA
- Allseas Group
Notable Milestones in North Sea Decommissioning Oil Rigs Industry Sector
- 2019: Increased regulatory pressure from OSPAR Convention regarding the removal of offshore installations.
- 2020: Advancements in subsea robotics enabling more complex interventions in deeper waters.
- 2021: Growing trend towards integrated decommissioning contracts offering end-to-end solutions.
- 2022: Focus on developing sustainable decommissioning practices and exploring material reuse.
- 2023: Significant investment in specialized heavy-lift vessels to handle larger structures.
- 2024: Increased adoption of AI and data analytics for predictive maintenance and decommissioning planning.
In-Depth North Sea Decommissioning Oil Rigs Industry Market Outlook
The future of the North Sea Decommissioning Oil Rigs Industry is marked by sustained growth, driven by a robust pipeline of aging assets and escalating environmental imperatives. Growth accelerators include relentless technological innovation, particularly in automation, AI, and subsea robotics, which will enhance safety and efficiency while reducing costs. Strategic collaborations between operators and specialized service providers are expected to streamline project execution. The ongoing global transition towards cleaner energy sources will further underscore the importance of responsible decommissioning, creating opportunities for companies committed to sustainable practices. The market is poised for continued investment in specialized infrastructure and talent development, ensuring the safe and environmentally sound retirement of offshore infrastructure.
North Sea Decommissioning Oil Rigs Industry Segmentation
-
1. Water Depth
- 1.1. Shallow Water
- 1.2. Deepwater and Ultra-deepwater
-
2. Geography
- 2.1. United Kingdom
- 2.2. Norway
- 2.3. Rest of North Sea
North Sea Decommissioning Oil Rigs Industry Segmentation By Geography
- 1. United Kingdom
- 2. Norway
- 3. Rest of North Sea
North Sea Decommissioning Oil Rigs Industry Regional Market Share
Geographic Coverage of North Sea Decommissioning Oil Rigs Industry
North Sea Decommissioning Oil Rigs Industry REPORT HIGHLIGHTS
| Aspects | Details |
|---|---|
| Study Period | 2020-2034 |
| Base Year | 2025 |
| Estimated Year | 2026 |
| Forecast Period | 2026-2034 |
| Historical Period | 2020-2025 |
| Growth Rate | CAGR of 8.2% from 2020-2034 |
| Segmentation |
|
Table of Contents
- 1. Introduction
- 1.1. Research Scope
- 1.2. Market Segmentation
- 1.3. Research Objective
- 1.4. Definitions and Assumptions
- 2. Executive Summary
- 2.1. Market Snapshot
- 3. Market Dynamics
- 3.1. Market Drivers
- 3.2. Market Restrains
- 3.3. Market Trends
- 3.4. Market Opportunities
- 4. Market Factor Analysis
- 4.1. Porters Five Forces
- 4.1.1. Bargaining Power of Suppliers
- 4.1.2. Bargaining Power of Buyers
- 4.1.3. Threat of New Entrants
- 4.1.4. Threat of Substitutes
- 4.1.5. Competitive Rivalry
- 4.2. PESTEL analysis
- 4.3. BCG Analysis
- 4.3.1. Stars (High Growth, High Market Share)
- 4.3.2. Cash Cows (Low Growth, High Market Share)
- 4.3.3. Question Mark (High Growth, Low Market Share)
- 4.3.4. Dogs (Low Growth, Low Market Share)
- 4.4. Ansoff Matrix Analysis
- 4.5. Supply Chain Analysis
- 4.6. Regulatory Landscape
- 4.7. Current Market Potential and Opportunity Assessment (TAM–SAM–SOM Framework)
- 4.8. IMR Analyst Note
- 4.1. Porters Five Forces
- 5. Market Analysis, Insights and Forecast 2021-2033
- 5.1. Market Analysis, Insights and Forecast - by Water Depth
- 5.1.1. Shallow Water
- 5.1.2. Deepwater and Ultra-deepwater
- 5.2. Market Analysis, Insights and Forecast - by Geography
- 5.2.1. United Kingdom
- 5.2.2. Norway
- 5.2.3. Rest of North Sea
- 5.3. Market Analysis, Insights and Forecast - by Region
- 5.3.1. United Kingdom
- 5.3.2. Norway
- 5.3.3. Rest of North Sea
- 5.1. Market Analysis, Insights and Forecast - by Water Depth
- 6. Global North Sea Decommissioning Oil Rigs Industry Analysis, Insights and Forecast, 2021-2033
- 6.1. Market Analysis, Insights and Forecast - by Water Depth
- 6.1.1. Shallow Water
- 6.1.2. Deepwater and Ultra-deepwater
- 6.2. Market Analysis, Insights and Forecast - by Geography
- 6.2.1. United Kingdom
- 6.2.2. Norway
- 6.2.3. Rest of North Sea
- 6.1. Market Analysis, Insights and Forecast - by Water Depth
- 7. United Kingdom North Sea Decommissioning Oil Rigs Industry Analysis, Insights and Forecast, 2020-2032
- 7.1. Market Analysis, Insights and Forecast - by Water Depth
- 7.1.1. Shallow Water
- 7.1.2. Deepwater and Ultra-deepwater
- 7.2. Market Analysis, Insights and Forecast - by Geography
- 7.2.1. United Kingdom
- 7.2.2. Norway
- 7.2.3. Rest of North Sea
- 7.1. Market Analysis, Insights and Forecast - by Water Depth
- 8. Norway North Sea Decommissioning Oil Rigs Industry Analysis, Insights and Forecast, 2020-2032
- 8.1. Market Analysis, Insights and Forecast - by Water Depth
- 8.1.1. Shallow Water
- 8.1.2. Deepwater and Ultra-deepwater
- 8.2. Market Analysis, Insights and Forecast - by Geography
- 8.2.1. United Kingdom
- 8.2.2. Norway
- 8.2.3. Rest of North Sea
- 8.1. Market Analysis, Insights and Forecast - by Water Depth
- 9. Rest of North Sea North Sea Decommissioning Oil Rigs Industry Analysis, Insights and Forecast, 2020-2032
- 9.1. Market Analysis, Insights and Forecast - by Water Depth
- 9.1.1. Shallow Water
- 9.1.2. Deepwater and Ultra-deepwater
- 9.2. Market Analysis, Insights and Forecast - by Geography
- 9.2.1. United Kingdom
- 9.2.2. Norway
- 9.2.3. Rest of North Sea
- 9.1. Market Analysis, Insights and Forecast - by Water Depth
- 10. Competitive Analysis
- 10.1. Company Profiles
- 10.1.1 Aker Solutions ASA
- 10.1.1.1. Company Overview
- 10.1.1.2. Products
- 10.1.1.3. Company Financials
- 10.1.1.4. SWOT Analysis
- 10.1.2 DNV GL
- 10.1.2.1. Company Overview
- 10.1.2.2. Products
- 10.1.2.3. Company Financials
- 10.1.2.4. SWOT Analysis
- 10.1.3 Heerema Marine Contractors (HMC)
- 10.1.3.1. Company Overview
- 10.1.3.2. Products
- 10.1.3.3. Company Financials
- 10.1.3.4. SWOT Analysis
- 10.1.4 DeepOcean Group Holding BV
- 10.1.4.1. Company Overview
- 10.1.4.2. Products
- 10.1.4.3. Company Financials
- 10.1.4.4. SWOT Analysis
- 10.1.5 Equinor ASA*List Not Exhaustive
- 10.1.5.1. Company Overview
- 10.1.5.2. Products
- 10.1.5.3. Company Financials
- 10.1.5.4. SWOT Analysis
- 10.1.6 Able UK
- 10.1.6.1. Company Overview
- 10.1.6.2. Products
- 10.1.6.3. Company Financials
- 10.1.6.4. SWOT Analysis
- 10.1.7 John Wood Group PLC
- 10.1.7.1. Company Overview
- 10.1.7.2. Products
- 10.1.7.3. Company Financials
- 10.1.7.4. SWOT Analysis
- 10.1.8 TechnipFMC PLC
- 10.1.8.1. Company Overview
- 10.1.8.2. Products
- 10.1.8.3. Company Financials
- 10.1.8.4. SWOT Analysis
- 10.1.9 AF Gruppen SA
- 10.1.9.1. Company Overview
- 10.1.9.2. Products
- 10.1.9.3. Company Financials
- 10.1.9.4. SWOT Analysis
- 10.1.10 Allseas Group
- 10.1.10.1. Company Overview
- 10.1.10.2. Products
- 10.1.10.3. Company Financials
- 10.1.10.4. SWOT Analysis
- 10.1.1 Aker Solutions ASA
- 10.2. Market Entropy
- 10.2.1 Company's Key Areas Served
- 10.2.2 Recent Developments
- 10.3. Company Market Share Analysis 2025
- 10.3.1 Top 5 Companies Market Share Analysis
- 10.3.2 Top 3 Companies Market Share Analysis
- 10.4. List of Potential Customers
- 11. Research Methodology
List of Figures
- Figure 1: Global North Sea Decommissioning Oil Rigs Industry Revenue Breakdown (undefined, %) by Region 2025 & 2033
- Figure 2: United Kingdom North Sea Decommissioning Oil Rigs Industry Revenue (undefined), by Water Depth 2025 & 2033
- Figure 3: United Kingdom North Sea Decommissioning Oil Rigs Industry Revenue Share (%), by Water Depth 2025 & 2033
- Figure 4: United Kingdom North Sea Decommissioning Oil Rigs Industry Revenue (undefined), by Geography 2025 & 2033
- Figure 5: United Kingdom North Sea Decommissioning Oil Rigs Industry Revenue Share (%), by Geography 2025 & 2033
- Figure 6: United Kingdom North Sea Decommissioning Oil Rigs Industry Revenue (undefined), by Country 2025 & 2033
- Figure 7: United Kingdom North Sea Decommissioning Oil Rigs Industry Revenue Share (%), by Country 2025 & 2033
- Figure 8: Norway North Sea Decommissioning Oil Rigs Industry Revenue (undefined), by Water Depth 2025 & 2033
- Figure 9: Norway North Sea Decommissioning Oil Rigs Industry Revenue Share (%), by Water Depth 2025 & 2033
- Figure 10: Norway North Sea Decommissioning Oil Rigs Industry Revenue (undefined), by Geography 2025 & 2033
- Figure 11: Norway North Sea Decommissioning Oil Rigs Industry Revenue Share (%), by Geography 2025 & 2033
- Figure 12: Norway North Sea Decommissioning Oil Rigs Industry Revenue (undefined), by Country 2025 & 2033
- Figure 13: Norway North Sea Decommissioning Oil Rigs Industry Revenue Share (%), by Country 2025 & 2033
- Figure 14: Rest of North Sea North Sea Decommissioning Oil Rigs Industry Revenue (undefined), by Water Depth 2025 & 2033
- Figure 15: Rest of North Sea North Sea Decommissioning Oil Rigs Industry Revenue Share (%), by Water Depth 2025 & 2033
- Figure 16: Rest of North Sea North Sea Decommissioning Oil Rigs Industry Revenue (undefined), by Geography 2025 & 2033
- Figure 17: Rest of North Sea North Sea Decommissioning Oil Rigs Industry Revenue Share (%), by Geography 2025 & 2033
- Figure 18: Rest of North Sea North Sea Decommissioning Oil Rigs Industry Revenue (undefined), by Country 2025 & 2033
- Figure 19: Rest of North Sea North Sea Decommissioning Oil Rigs Industry Revenue Share (%), by Country 2025 & 2033
List of Tables
- Table 1: Global North Sea Decommissioning Oil Rigs Industry Revenue undefined Forecast, by Water Depth 2020 & 2033
- Table 2: Global North Sea Decommissioning Oil Rigs Industry Revenue undefined Forecast, by Geography 2020 & 2033
- Table 3: Global North Sea Decommissioning Oil Rigs Industry Revenue undefined Forecast, by Region 2020 & 2033
- Table 4: Global North Sea Decommissioning Oil Rigs Industry Revenue undefined Forecast, by Water Depth 2020 & 2033
- Table 5: Global North Sea Decommissioning Oil Rigs Industry Revenue undefined Forecast, by Geography 2020 & 2033
- Table 6: Global North Sea Decommissioning Oil Rigs Industry Revenue undefined Forecast, by Country 2020 & 2033
- Table 7: Global North Sea Decommissioning Oil Rigs Industry Revenue undefined Forecast, by Water Depth 2020 & 2033
- Table 8: Global North Sea Decommissioning Oil Rigs Industry Revenue undefined Forecast, by Geography 2020 & 2033
- Table 9: Global North Sea Decommissioning Oil Rigs Industry Revenue undefined Forecast, by Country 2020 & 2033
- Table 10: Global North Sea Decommissioning Oil Rigs Industry Revenue undefined Forecast, by Water Depth 2020 & 2033
- Table 11: Global North Sea Decommissioning Oil Rigs Industry Revenue undefined Forecast, by Geography 2020 & 2033
- Table 12: Global North Sea Decommissioning Oil Rigs Industry Revenue undefined Forecast, by Country 2020 & 2033
Frequently Asked Questions
1. What is the projected Compound Annual Growth Rate (CAGR) of the North Sea Decommissioning Oil Rigs Industry?
The projected CAGR is approximately 8.2%.
2. Which companies are prominent players in the North Sea Decommissioning Oil Rigs Industry?
Key companies in the market include Aker Solutions ASA, DNV GL, Heerema Marine Contractors (HMC), DeepOcean Group Holding BV, Equinor ASA*List Not Exhaustive, Able UK, John Wood Group PLC, TechnipFMC PLC, AF Gruppen SA, Allseas Group.
3. What are the main segments of the North Sea Decommissioning Oil Rigs Industry?
The market segments include Water Depth, Geography.
4. Can you provide details about the market size?
The market size is estimated to be USD XXX N/A as of 2022.
5. What are some drivers contributing to market growth?
4.; Increasing Demand for Secure. Sustainable. and Clean Energy.
6. What are the notable trends driving market growth?
Shallow Water to Dominate the Market.
7. Are there any restraints impacting market growth?
4.; High Cost of Production of Biofuels.
8. Can you provide examples of recent developments in the market?
N/A
9. What pricing options are available for accessing the report?
Pricing options include single-user, multi-user, and enterprise licenses priced at USD 4750, USD 5250, and USD 8750 respectively.
10. Is the market size provided in terms of value or volume?
The market size is provided in terms of value, measured in N/A.
11. Are there any specific market keywords associated with the report?
Yes, the market keyword associated with the report is "North Sea Decommissioning Oil Rigs Industry," which aids in identifying and referencing the specific market segment covered.
12. How do I determine which pricing option suits my needs best?
The pricing options vary based on user requirements and access needs. Individual users may opt for single-user licenses, while businesses requiring broader access may choose multi-user or enterprise licenses for cost-effective access to the report.
13. Are there any additional resources or data provided in the North Sea Decommissioning Oil Rigs Industry report?
While the report offers comprehensive insights, it's advisable to review the specific contents or supplementary materials provided to ascertain if additional resources or data are available.
14. How can I stay updated on further developments or reports in the North Sea Decommissioning Oil Rigs Industry?
To stay informed about further developments, trends, and reports in the North Sea Decommissioning Oil Rigs Industry, consider subscribing to industry newsletters, following relevant companies and organizations, or regularly checking reputable industry news sources and publications.
Methodology
Step 1 - Identification of Relevant Samples Size from Population Database


Step 2 - Approaches for Defining Global Market Size (Value, Volume* & Price*)

Note*: In applicable scenarios
Step 3 - Data Sources
Primary Research
- Web Analytics
- Survey Reports
- Research Institute
- Latest Research Reports
- Opinion Leaders
Secondary Research
- Annual Reports
- White Paper
- Latest Press Release
- Industry Association
- Paid Database
- Investor Presentations

Step 4 - Data Triangulation
Involves using different sources of information in order to increase the validity of a study
These sources are likely to be stakeholders in a program - participants, other researchers, program staff, other community members, and so on.
Then we put all data in single framework & apply various statistical tools to find out the dynamic on the market.
During the analysis stage, feedback from the stakeholder groups would be compared to determine areas of agreement as well as areas of divergence