

Key Insights
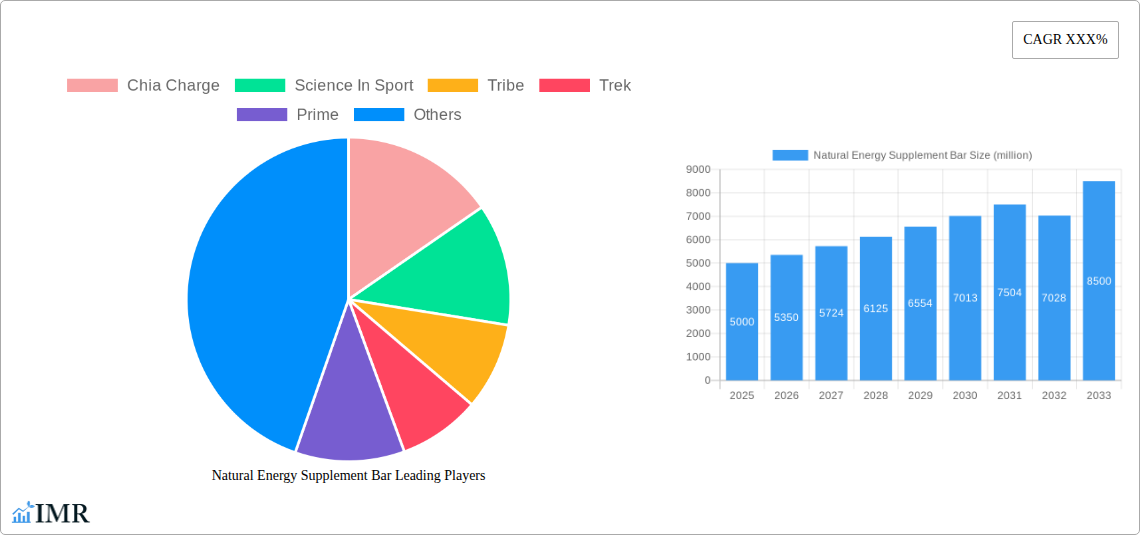
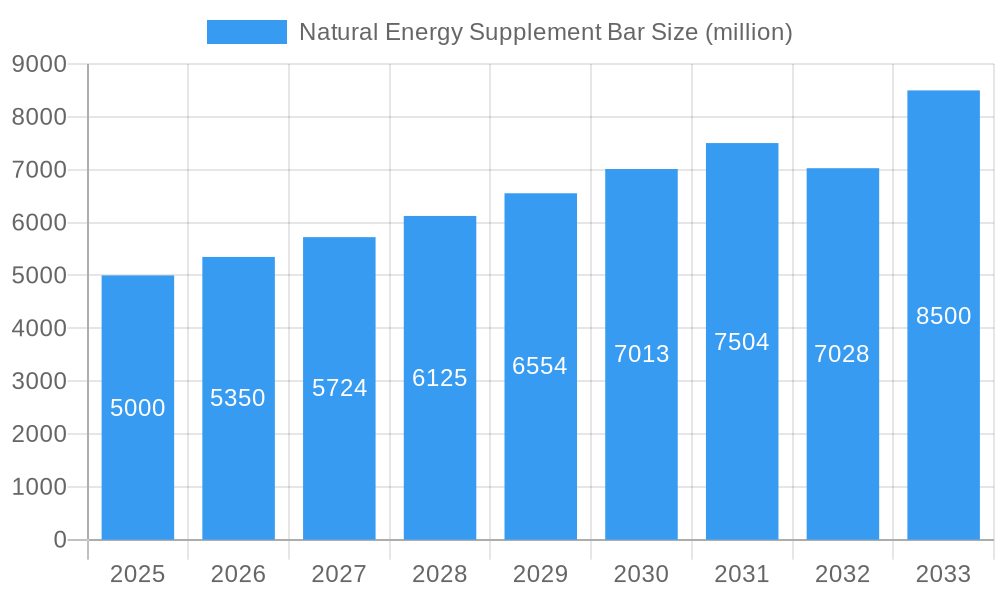
The global natural energy supplement bar market is experiencing robust growth, driven by increasing health consciousness, rising demand for convenient and nutritious snacks, and the growing popularity of active lifestyles. The market, estimated at $5 billion in 2025, is projected to exhibit a Compound Annual Growth Rate (CAGR) of 7% from 2025 to 2033, reaching approximately $8.5 billion by 2033. Key drivers include the rising prevalence of chronic diseases and the consequent need for functional foods, a preference for clean-label ingredients and organic products, and increased consumer spending on premium, healthier food options. Furthermore, the expansion of e-commerce platforms and targeted marketing campaigns are contributing to market expansion. While the market faces some restraints, such as price fluctuations in raw materials and stringent regulatory compliance, these are largely offset by the aforementioned growth drivers. The market is segmented by product type (e.g., protein bars, granola bars, fruit & nut bars), distribution channel (e.g., supermarkets, online retailers, specialty stores), and region. Leading players like Clif Bar, Nature Valley, and RXBAR are leveraging innovative product development, strategic partnerships, and brand building initiatives to strengthen their market positions.
Natural Energy Supplement Bar Market Size (In Billion)
The market's segmentation offers opportunities for niche players to thrive. For example, the increasing demand for vegan and gluten-free options has fueled the growth of specialized bars catering to specific dietary needs. Similarly, the rising awareness of sustainable and ethically sourced ingredients presents opportunities for brands focusing on eco-friendly production practices. Future growth will likely be influenced by trends like personalized nutrition, the integration of smart packaging technology, and the growing acceptance of plant-based protein sources. The competitive landscape is characterized by a mix of established multinational corporations and smaller, specialized brands. Companies are adopting diverse strategies, including product innovation, strategic acquisitions, and expansion into new geographical markets to gain a competitive edge.
Natural Energy Supplement Bar Company Market Share
Natural Energy Supplement Bar Market Report: 2019-2033
This comprehensive report provides an in-depth analysis of the Natural Energy Supplement Bar market, covering market dynamics, growth trends, regional dominance, product landscape, key players, and future outlook. The study period spans 2019-2033, with 2025 as the base and estimated year, and a forecast period of 2025-2033. This report is invaluable for industry professionals, investors, and strategic decision-makers seeking a clear understanding of this dynamic market.
Natural Energy Supplement Bar Market Dynamics & Structure
The natural energy supplement bar market is experiencing significant growth, driven by increasing health consciousness and demand for convenient, nutritious snacks. Market concentration is moderate, with key players such as Clif Bar and Nature Valley holding substantial shares, but also with smaller, niche brands emerging. Technological innovation focuses on improving ingredient sourcing, enhancing taste and texture, and exploring sustainable packaging solutions. Regulatory frameworks vary across regions, impacting ingredient labeling and marketing claims. Competitive product substitutes include energy gels, drinks, and other convenient energy sources. End-user demographics are primarily health-conscious adults aged 25-55, with a growing interest among younger consumers. Mergers and acquisitions (M&A) activity has been moderate, with larger players acquiring smaller brands to expand their product portfolio and market reach.
- Market Concentration: Moderately concentrated, with the top 5 players holding approximately xx% market share in 2025.
- Technological Innovation: Focus on sustainable packaging, novel ingredients (e.g., adaptogens, functional mushrooms), and improved taste profiles.
- Regulatory Landscape: Varying regulations across regions regarding labeling, ingredient claims, and organic certification.
- Competitive Substitutes: Energy gels, protein bars, energy drinks, and other convenient energy sources.
- End-User Demographics: Primarily health-conscious adults (25-55), expanding to younger demographics.
- M&A Activity: XX major M&A deals observed in the historical period (2019-2024), with a projected xx deals during the forecast period.
Natural Energy Supplement Bar Growth Trends & Insights
The natural energy supplement bar market demonstrates robust growth, fueled by increasing consumer demand for convenient and nutritious food options. The market size is projected to reach $xx billion by 2033, exhibiting a CAGR of xx% during the forecast period. Adoption rates are particularly high among fitness enthusiasts, athletes, and busy professionals seeking quick energy boosts. Technological disruptions, such as the introduction of innovative ingredients and improved manufacturing processes, are further driving growth. Consumer behavior shifts toward healthier lifestyles and increased demand for organic and natural products significantly contribute to market expansion. Growing awareness of the benefits of natural energy sources over processed alternatives is another key driver.
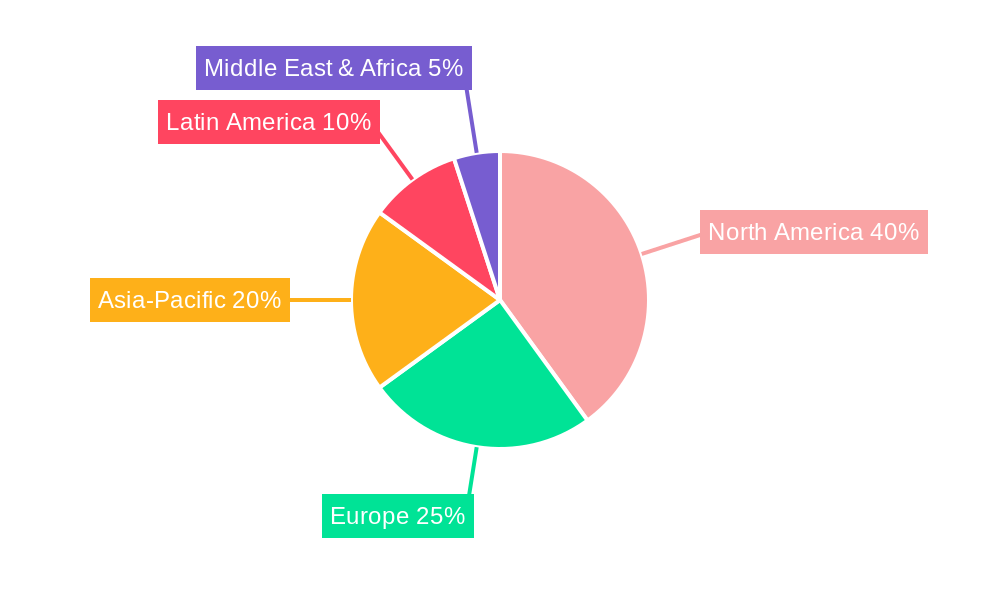
Dominant Regions, Countries, or Segments in Natural Energy Supplement Bar
North America currently dominates the natural energy supplement bar market, accounting for approximately xx% of global sales in 2025. This dominance is primarily attributed to high consumer disposable income, a strong health and wellness culture, and widespread availability of the product through various retail channels. Europe follows closely, driven by similar factors but also with a growing emphasis on organic and sustainably sourced products. Key growth drivers include expanding retail infrastructure, increasing health awareness campaigns, and government initiatives promoting healthy lifestyles.
- North America: High consumer spending, strong health consciousness, and extensive retail presence.
- Europe: Rising demand for organic products, growing health awareness, and expanding retail infrastructure.
- Asia-Pacific: Rapid economic growth, increasing disposable incomes, and rising health awareness, but also some barriers related to cultural preference.
Natural Energy Supplement Bar Product Landscape
The natural energy supplement bar market offers a diverse range of products catering to various consumer needs and preferences. Innovation focuses on unique flavor profiles, the incorporation of functional ingredients like adaptogens and probiotics, and the use of sustainable and ethically sourced ingredients. Products are differentiated by their nutritional profiles (e.g., high protein, high fiber), texture (e.g., chewy, crispy), and packaging. The emphasis on clean labels and transparent ingredient sourcing enhances consumer trust and confidence.
Key Drivers, Barriers & Challenges in Natural Energy Supplement Bar
Key Drivers:
- Increasing consumer demand for convenient and healthy snack options.
- Rising awareness of the benefits of natural energy sources.
- Growing popularity of fitness and wellness activities.
- Technological advancements in product formulation and packaging.
Challenges and Restraints:
- Intense competition from established and emerging brands.
- Fluctuations in raw material prices.
- Stringent regulations regarding food safety and labeling.
- Maintaining supply chain efficiency amid global disruptions. The estimated impact of supply chain issues on market growth is around xx% in 2025.
Emerging Opportunities in Natural Energy Supplement Bar
- Expansion into untapped markets, particularly in developing economies.
- Development of novel product formulations with unique flavors and functional ingredients.
- Increasing demand for personalized nutrition solutions.
- Growing focus on sustainable and eco-friendly packaging.
Growth Accelerators in the Natural Energy Supplement Bar Industry
Strategic partnerships between ingredient suppliers and manufacturers, along with technological advancements in production and packaging, are key growth accelerators. Expansion into new geographic markets and the development of innovative product offerings tailored to specific consumer segments will further propel market growth. Increased investment in research and development and marketing efforts will support further growth.
Key Players Shaping the Natural Energy Supplement Bar Market
- Chia Charge
- Science In Sport
- Tribe
- Trek
- Prime
- Clif Bar
- Battle Oats
- High5
- Eastman
- General Mills
- Luna Bar
- Nature Valley
- PROBAR
- Kate's Real Food
- TAOS BAKES
- Bobo’s Oat Bars
Notable Milestones in Natural Energy Supplement Bar Sector
- 2020: Clif Bar launches a new line of organic energy bars.
- 2021: Nature Valley expands its product range with new flavors and ingredients.
- 2022: Science in Sport acquires a smaller competitor, expanding its market share.
- 2023: Increased focus on sustainable packaging across multiple brands.
- 2024: Several key players invest in research and development of functional ingredients for energy bars.
In-Depth Natural Energy Supplement Bar Market Outlook
The natural energy supplement bar market is poised for continued growth, driven by favorable consumer trends, technological advancements, and strategic market expansion initiatives. Opportunities exist for both established players and emerging brands to capture market share through product innovation, targeted marketing, and strategic partnerships. The focus on sustainability and functional ingredients will further shape the market landscape in the coming years. The market is expected to continue its expansion throughout the forecast period (2025-2033), offering significant opportunities for players who adapt to changing consumer preferences and market dynamics.
Natural Energy Supplement Bar Segmentation
-
1. Application
- 1.1. Online Sales
- 1.2. Offline Sales
-
2. Type
- 2.1. Gluten Free
- 2.2. Nut Free
Natural Energy Supplement Bar Segmentation By Geography
-
1. North America
- 1.1. United States
- 1.2. Canada
- 1.3. Mexico
-
2. South America
- 2.1. Brazil
- 2.2. Argentina
- 2.3. Rest of South America
-
3. Europe
- 3.1. United Kingdom
- 3.2. Germany
- 3.3. France
- 3.4. Italy
- 3.5. Spain
- 3.6. Russia
- 3.7. Benelux
- 3.8. Nordics
- 3.9. Rest of Europe
-
4. Middle East & Africa
- 4.1. Turkey
- 4.2. Israel
- 4.3. GCC
- 4.4. North Africa
- 4.5. South Africa
- 4.6. Rest of Middle East & Africa
-
5. Asia Pacific
- 5.1. China
- 5.2. India
- 5.3. Japan
- 5.4. South Korea
- 5.5. ASEAN
- 5.6. Oceania
- 5.7. Rest of Asia Pacific
Natural Energy Supplement Bar Regional Market Share
Geographic Coverage of Natural Energy Supplement Bar
Natural Energy Supplement Bar REPORT HIGHLIGHTS
| Aspects | Details |
|---|---|
| Study Period | 2020-2034 |
| Base Year | 2025 |
| Estimated Year | 2026 |
| Forecast Period | 2026-2034 |
| Historical Period | 2020-2025 |
| Growth Rate | CAGR of 9.4% from 2020-2034 |
| Segmentation |
|
Table of Contents
- 1. Introduction
- 1.1. Research Scope
- 1.2. Market Segmentation
- 1.3. Research Methodology
- 1.4. Definitions and Assumptions
- 2. Executive Summary
- 2.1. Introduction
- 3. Market Dynamics
- 3.1. Introduction
- 3.2. Market Drivers
- 3.3. Market Restrains
- 3.4. Market Trends
- 4. Market Factor Analysis
- 4.1. Porters Five Forces
- 4.2. Supply/Value Chain
- 4.3. PESTEL analysis
- 4.4. Market Entropy
- 4.5. Patent/Trademark Analysis
- 5. Global Natural Energy Supplement Bar Analysis, Insights and Forecast, 2020-2032
- 5.1. Market Analysis, Insights and Forecast - by Application
- 5.1.1. Online Sales
- 5.1.2. Offline Sales
- 5.2. Market Analysis, Insights and Forecast - by Type
- 5.2.1. Gluten Free
- 5.2.2. Nut Free
- 5.3. Market Analysis, Insights and Forecast - by Region
- 5.3.1. North America
- 5.3.2. South America
- 5.3.3. Europe
- 5.3.4. Middle East & Africa
- 5.3.5. Asia Pacific
- 5.1. Market Analysis, Insights and Forecast - by Application
- 6. North America Natural Energy Supplement Bar Analysis, Insights and Forecast, 2020-2032
- 6.1. Market Analysis, Insights and Forecast - by Application
- 6.1.1. Online Sales
- 6.1.2. Offline Sales
- 6.2. Market Analysis, Insights and Forecast - by Type
- 6.2.1. Gluten Free
- 6.2.2. Nut Free
- 6.1. Market Analysis, Insights and Forecast - by Application
- 7. South America Natural Energy Supplement Bar Analysis, Insights and Forecast, 2020-2032
- 7.1. Market Analysis, Insights and Forecast - by Application
- 7.1.1. Online Sales
- 7.1.2. Offline Sales
- 7.2. Market Analysis, Insights and Forecast - by Type
- 7.2.1. Gluten Free
- 7.2.2. Nut Free
- 7.1. Market Analysis, Insights and Forecast - by Application
- 8. Europe Natural Energy Supplement Bar Analysis, Insights and Forecast, 2020-2032
- 8.1. Market Analysis, Insights and Forecast - by Application
- 8.1.1. Online Sales
- 8.1.2. Offline Sales
- 8.2. Market Analysis, Insights and Forecast - by Type
- 8.2.1. Gluten Free
- 8.2.2. Nut Free
- 8.1. Market Analysis, Insights and Forecast - by Application
- 9. Middle East & Africa Natural Energy Supplement Bar Analysis, Insights and Forecast, 2020-2032
- 9.1. Market Analysis, Insights and Forecast - by Application
- 9.1.1. Online Sales
- 9.1.2. Offline Sales
- 9.2. Market Analysis, Insights and Forecast - by Type
- 9.2.1. Gluten Free
- 9.2.2. Nut Free
- 9.1. Market Analysis, Insights and Forecast - by Application
- 10. Asia Pacific Natural Energy Supplement Bar Analysis, Insights and Forecast, 2020-2032
- 10.1. Market Analysis, Insights and Forecast - by Application
- 10.1.1. Online Sales
- 10.1.2. Offline Sales
- 10.2. Market Analysis, Insights and Forecast - by Type
- 10.2.1. Gluten Free
- 10.2.2. Nut Free
- 10.1. Market Analysis, Insights and Forecast - by Application
- 11. Competitive Analysis
- 11.1. Global Market Share Analysis 2025
- 11.2. Company Profiles
- 11.2.1 Chia Charge
- 11.2.1.1. Overview
- 11.2.1.2. Products
- 11.2.1.3. SWOT Analysis
- 11.2.1.4. Recent Developments
- 11.2.1.5. Financials (Based on Availability)
- 11.2.2 Science In Sport
- 11.2.2.1. Overview
- 11.2.2.2. Products
- 11.2.2.3. SWOT Analysis
- 11.2.2.4. Recent Developments
- 11.2.2.5. Financials (Based on Availability)
- 11.2.3 Tribe
- 11.2.3.1. Overview
- 11.2.3.2. Products
- 11.2.3.3. SWOT Analysis
- 11.2.3.4. Recent Developments
- 11.2.3.5. Financials (Based on Availability)
- 11.2.4 Trek
- 11.2.4.1. Overview
- 11.2.4.2. Products
- 11.2.4.3. SWOT Analysis
- 11.2.4.4. Recent Developments
- 11.2.4.5. Financials (Based on Availability)
- 11.2.5 Prime
- 11.2.5.1. Overview
- 11.2.5.2. Products
- 11.2.5.3. SWOT Analysis
- 11.2.5.4. Recent Developments
- 11.2.5.5. Financials (Based on Availability)
- 11.2.6 Clif Bar
- 11.2.6.1. Overview
- 11.2.6.2. Products
- 11.2.6.3. SWOT Analysis
- 11.2.6.4. Recent Developments
- 11.2.6.5. Financials (Based on Availability)
- 11.2.7 Battle Oats
- 11.2.7.1. Overview
- 11.2.7.2. Products
- 11.2.7.3. SWOT Analysis
- 11.2.7.4. Recent Developments
- 11.2.7.5. Financials (Based on Availability)
- 11.2.8 High5
- 11.2.8.1. Overview
- 11.2.8.2. Products
- 11.2.8.3. SWOT Analysis
- 11.2.8.4. Recent Developments
- 11.2.8.5. Financials (Based on Availability)
- 11.2.9 Eastman
- 11.2.9.1. Overview
- 11.2.9.2. Products
- 11.2.9.3. SWOT Analysis
- 11.2.9.4. Recent Developments
- 11.2.9.5. Financials (Based on Availability)
- 11.2.10 General Mills
- 11.2.10.1. Overview
- 11.2.10.2. Products
- 11.2.10.3. SWOT Analysis
- 11.2.10.4. Recent Developments
- 11.2.10.5. Financials (Based on Availability)
- 11.2.11 Luna Bar
- 11.2.11.1. Overview
- 11.2.11.2. Products
- 11.2.11.3. SWOT Analysis
- 11.2.11.4. Recent Developments
- 11.2.11.5. Financials (Based on Availability)
- 11.2.12 Nature Valley
- 11.2.12.1. Overview
- 11.2.12.2. Products
- 11.2.12.3. SWOT Analysis
- 11.2.12.4. Recent Developments
- 11.2.12.5. Financials (Based on Availability)
- 11.2.13 PROBAR
- 11.2.13.1. Overview
- 11.2.13.2. Products
- 11.2.13.3. SWOT Analysis
- 11.2.13.4. Recent Developments
- 11.2.13.5. Financials (Based on Availability)
- 11.2.14 Kate's Real Food
- 11.2.14.1. Overview
- 11.2.14.2. Products
- 11.2.14.3. SWOT Analysis
- 11.2.14.4. Recent Developments
- 11.2.14.5. Financials (Based on Availability)
- 11.2.15 TAOS BAKES
- 11.2.15.1. Overview
- 11.2.15.2. Products
- 11.2.15.3. SWOT Analysis
- 11.2.15.4. Recent Developments
- 11.2.15.5. Financials (Based on Availability)
- 11.2.16 Bobo’s Oat Bars
- 11.2.16.1. Overview
- 11.2.16.2. Products
- 11.2.16.3. SWOT Analysis
- 11.2.16.4. Recent Developments
- 11.2.16.5. Financials (Based on Availability)
- 11.2.1 Chia Charge
List of Figures
- Figure 1: Global Natural Energy Supplement Bar Revenue Breakdown (undefined, %) by Region 2025 & 2033
- Figure 2: Global Natural Energy Supplement Bar Volume Breakdown (K, %) by Region 2025 & 2033
- Figure 3: North America Natural Energy Supplement Bar Revenue (undefined), by Application 2025 & 2033
- Figure 4: North America Natural Energy Supplement Bar Volume (K), by Application 2025 & 2033
- Figure 5: North America Natural Energy Supplement Bar Revenue Share (%), by Application 2025 & 2033
- Figure 6: North America Natural Energy Supplement Bar Volume Share (%), by Application 2025 & 2033
- Figure 7: North America Natural Energy Supplement Bar Revenue (undefined), by Type 2025 & 2033
- Figure 8: North America Natural Energy Supplement Bar Volume (K), by Type 2025 & 2033
- Figure 9: North America Natural Energy Supplement Bar Revenue Share (%), by Type 2025 & 2033
- Figure 10: North America Natural Energy Supplement Bar Volume Share (%), by Type 2025 & 2033
- Figure 11: North America Natural Energy Supplement Bar Revenue (undefined), by Country 2025 & 2033
- Figure 12: North America Natural Energy Supplement Bar Volume (K), by Country 2025 & 2033
- Figure 13: North America Natural Energy Supplement Bar Revenue Share (%), by Country 2025 & 2033
- Figure 14: North America Natural Energy Supplement Bar Volume Share (%), by Country 2025 & 2033
- Figure 15: South America Natural Energy Supplement Bar Revenue (undefined), by Application 2025 & 2033
- Figure 16: South America Natural Energy Supplement Bar Volume (K), by Application 2025 & 2033
- Figure 17: South America Natural Energy Supplement Bar Revenue Share (%), by Application 2025 & 2033
- Figure 18: South America Natural Energy Supplement Bar Volume Share (%), by Application 2025 & 2033
- Figure 19: South America Natural Energy Supplement Bar Revenue (undefined), by Type 2025 & 2033
- Figure 20: South America Natural Energy Supplement Bar Volume (K), by Type 2025 & 2033
- Figure 21: South America Natural Energy Supplement Bar Revenue Share (%), by Type 2025 & 2033
- Figure 22: South America Natural Energy Supplement Bar Volume Share (%), by Type 2025 & 2033
- Figure 23: South America Natural Energy Supplement Bar Revenue (undefined), by Country 2025 & 2033
- Figure 24: South America Natural Energy Supplement Bar Volume (K), by Country 2025 & 2033
- Figure 25: South America Natural Energy Supplement Bar Revenue Share (%), by Country 2025 & 2033
- Figure 26: South America Natural Energy Supplement Bar Volume Share (%), by Country 2025 & 2033
- Figure 27: Europe Natural Energy Supplement Bar Revenue (undefined), by Application 2025 & 2033
- Figure 28: Europe Natural Energy Supplement Bar Volume (K), by Application 2025 & 2033
- Figure 29: Europe Natural Energy Supplement Bar Revenue Share (%), by Application 2025 & 2033
- Figure 30: Europe Natural Energy Supplement Bar Volume Share (%), by Application 2025 & 2033
- Figure 31: Europe Natural Energy Supplement Bar Revenue (undefined), by Type 2025 & 2033
- Figure 32: Europe Natural Energy Supplement Bar Volume (K), by Type 2025 & 2033
- Figure 33: Europe Natural Energy Supplement Bar Revenue Share (%), by Type 2025 & 2033
- Figure 34: Europe Natural Energy Supplement Bar Volume Share (%), by Type 2025 & 2033
- Figure 35: Europe Natural Energy Supplement Bar Revenue (undefined), by Country 2025 & 2033
- Figure 36: Europe Natural Energy Supplement Bar Volume (K), by Country 2025 & 2033
- Figure 37: Europe Natural Energy Supplement Bar Revenue Share (%), by Country 2025 & 2033
- Figure 38: Europe Natural Energy Supplement Bar Volume Share (%), by Country 2025 & 2033
- Figure 39: Middle East & Africa Natural Energy Supplement Bar Revenue (undefined), by Application 2025 & 2033
- Figure 40: Middle East & Africa Natural Energy Supplement Bar Volume (K), by Application 2025 & 2033
- Figure 41: Middle East & Africa Natural Energy Supplement Bar Revenue Share (%), by Application 2025 & 2033
- Figure 42: Middle East & Africa Natural Energy Supplement Bar Volume Share (%), by Application 2025 & 2033
- Figure 43: Middle East & Africa Natural Energy Supplement Bar Revenue (undefined), by Type 2025 & 2033
- Figure 44: Middle East & Africa Natural Energy Supplement Bar Volume (K), by Type 2025 & 2033
- Figure 45: Middle East & Africa Natural Energy Supplement Bar Revenue Share (%), by Type 2025 & 2033
- Figure 46: Middle East & Africa Natural Energy Supplement Bar Volume Share (%), by Type 2025 & 2033
- Figure 47: Middle East & Africa Natural Energy Supplement Bar Revenue (undefined), by Country 2025 & 2033
- Figure 48: Middle East & Africa Natural Energy Supplement Bar Volume (K), by Country 2025 & 2033
- Figure 49: Middle East & Africa Natural Energy Supplement Bar Revenue Share (%), by Country 2025 & 2033
- Figure 50: Middle East & Africa Natural Energy Supplement Bar Volume Share (%), by Country 2025 & 2033
- Figure 51: Asia Pacific Natural Energy Supplement Bar Revenue (undefined), by Application 2025 & 2033
- Figure 52: Asia Pacific Natural Energy Supplement Bar Volume (K), by Application 2025 & 2033
- Figure 53: Asia Pacific Natural Energy Supplement Bar Revenue Share (%), by Application 2025 & 2033
- Figure 54: Asia Pacific Natural Energy Supplement Bar Volume Share (%), by Application 2025 & 2033
- Figure 55: Asia Pacific Natural Energy Supplement Bar Revenue (undefined), by Type 2025 & 2033
- Figure 56: Asia Pacific Natural Energy Supplement Bar Volume (K), by Type 2025 & 2033
- Figure 57: Asia Pacific Natural Energy Supplement Bar Revenue Share (%), by Type 2025 & 2033
- Figure 58: Asia Pacific Natural Energy Supplement Bar Volume Share (%), by Type 2025 & 2033
- Figure 59: Asia Pacific Natural Energy Supplement Bar Revenue (undefined), by Country 2025 & 2033
- Figure 60: Asia Pacific Natural Energy Supplement Bar Volume (K), by Country 2025 & 2033
- Figure 61: Asia Pacific Natural Energy Supplement Bar Revenue Share (%), by Country 2025 & 2033
- Figure 62: Asia Pacific Natural Energy Supplement Bar Volume Share (%), by Country 2025 & 2033
List of Tables
- Table 1: Global Natural Energy Supplement Bar Revenue undefined Forecast, by Application 2020 & 2033
- Table 2: Global Natural Energy Supplement Bar Volume K Forecast, by Application 2020 & 2033
- Table 3: Global Natural Energy Supplement Bar Revenue undefined Forecast, by Type 2020 & 2033
- Table 4: Global Natural Energy Supplement Bar Volume K Forecast, by Type 2020 & 2033
- Table 5: Global Natural Energy Supplement Bar Revenue undefined Forecast, by Region 2020 & 2033
- Table 6: Global Natural Energy Supplement Bar Volume K Forecast, by Region 2020 & 2033
- Table 7: Global Natural Energy Supplement Bar Revenue undefined Forecast, by Application 2020 & 2033
- Table 8: Global Natural Energy Supplement Bar Volume K Forecast, by Application 2020 & 2033
- Table 9: Global Natural Energy Supplement Bar Revenue undefined Forecast, by Type 2020 & 2033
- Table 10: Global Natural Energy Supplement Bar Volume K Forecast, by Type 2020 & 2033
- Table 11: Global Natural Energy Supplement Bar Revenue undefined Forecast, by Country 2020 & 2033
- Table 12: Global Natural Energy Supplement Bar Volume K Forecast, by Country 2020 & 2033
- Table 13: United States Natural Energy Supplement Bar Revenue (undefined) Forecast, by Application 2020 & 2033
- Table 14: United States Natural Energy Supplement Bar Volume (K) Forecast, by Application 2020 & 2033
- Table 15: Canada Natural Energy Supplement Bar Revenue (undefined) Forecast, by Application 2020 & 2033
- Table 16: Canada Natural Energy Supplement Bar Volume (K) Forecast, by Application 2020 & 2033
- Table 17: Mexico Natural Energy Supplement Bar Revenue (undefined) Forecast, by Application 2020 & 2033
- Table 18: Mexico Natural Energy Supplement Bar Volume (K) Forecast, by Application 2020 & 2033
- Table 19: Global Natural Energy Supplement Bar Revenue undefined Forecast, by Application 2020 & 2033
- Table 20: Global Natural Energy Supplement Bar Volume K Forecast, by Application 2020 & 2033
- Table 21: Global Natural Energy Supplement Bar Revenue undefined Forecast, by Type 2020 & 2033
- Table 22: Global Natural Energy Supplement Bar Volume K Forecast, by Type 2020 & 2033
- Table 23: Global Natural Energy Supplement Bar Revenue undefined Forecast, by Country 2020 & 2033
- Table 24: Global Natural Energy Supplement Bar Volume K Forecast, by Country 2020 & 2033
- Table 25: Brazil Natural Energy Supplement Bar Revenue (undefined) Forecast, by Application 2020 & 2033
- Table 26: Brazil Natural Energy Supplement Bar Volume (K) Forecast, by Application 2020 & 2033
- Table 27: Argentina Natural Energy Supplement Bar Revenue (undefined) Forecast, by Application 2020 & 2033
- Table 28: Argentina Natural Energy Supplement Bar Volume (K) Forecast, by Application 2020 & 2033
- Table 29: Rest of South America Natural Energy Supplement Bar Revenue (undefined) Forecast, by Application 2020 & 2033
- Table 30: Rest of South America Natural Energy Supplement Bar Volume (K) Forecast, by Application 2020 & 2033
- Table 31: Global Natural Energy Supplement Bar Revenue undefined Forecast, by Application 2020 & 2033
- Table 32: Global Natural Energy Supplement Bar Volume K Forecast, by Application 2020 & 2033
- Table 33: Global Natural Energy Supplement Bar Revenue undefined Forecast, by Type 2020 & 2033
- Table 34: Global Natural Energy Supplement Bar Volume K Forecast, by Type 2020 & 2033
- Table 35: Global Natural Energy Supplement Bar Revenue undefined Forecast, by Country 2020 & 2033
- Table 36: Global Natural Energy Supplement Bar Volume K Forecast, by Country 2020 & 2033
- Table 37: United Kingdom Natural Energy Supplement Bar Revenue (undefined) Forecast, by Application 2020 & 2033
- Table 38: United Kingdom Natural Energy Supplement Bar Volume (K) Forecast, by Application 2020 & 2033
- Table 39: Germany Natural Energy Supplement Bar Revenue (undefined) Forecast, by Application 2020 & 2033
- Table 40: Germany Natural Energy Supplement Bar Volume (K) Forecast, by Application 2020 & 2033
- Table 41: France Natural Energy Supplement Bar Revenue (undefined) Forecast, by Application 2020 & 2033
- Table 42: France Natural Energy Supplement Bar Volume (K) Forecast, by Application 2020 & 2033
- Table 43: Italy Natural Energy Supplement Bar Revenue (undefined) Forecast, by Application 2020 & 2033
- Table 44: Italy Natural Energy Supplement Bar Volume (K) Forecast, by Application 2020 & 2033
- Table 45: Spain Natural Energy Supplement Bar Revenue (undefined) Forecast, by Application 2020 & 2033
- Table 46: Spain Natural Energy Supplement Bar Volume (K) Forecast, by Application 2020 & 2033
- Table 47: Russia Natural Energy Supplement Bar Revenue (undefined) Forecast, by Application 2020 & 2033
- Table 48: Russia Natural Energy Supplement Bar Volume (K) Forecast, by Application 2020 & 2033
- Table 49: Benelux Natural Energy Supplement Bar Revenue (undefined) Forecast, by Application 2020 & 2033
- Table 50: Benelux Natural Energy Supplement Bar Volume (K) Forecast, by Application 2020 & 2033
- Table 51: Nordics Natural Energy Supplement Bar Revenue (undefined) Forecast, by Application 2020 & 2033
- Table 52: Nordics Natural Energy Supplement Bar Volume (K) Forecast, by Application 2020 & 2033
- Table 53: Rest of Europe Natural Energy Supplement Bar Revenue (undefined) Forecast, by Application 2020 & 2033
- Table 54: Rest of Europe Natural Energy Supplement Bar Volume (K) Forecast, by Application 2020 & 2033
- Table 55: Global Natural Energy Supplement Bar Revenue undefined Forecast, by Application 2020 & 2033
- Table 56: Global Natural Energy Supplement Bar Volume K Forecast, by Application 2020 & 2033
- Table 57: Global Natural Energy Supplement Bar Revenue undefined Forecast, by Type 2020 & 2033
- Table 58: Global Natural Energy Supplement Bar Volume K Forecast, by Type 2020 & 2033
- Table 59: Global Natural Energy Supplement Bar Revenue undefined Forecast, by Country 2020 & 2033
- Table 60: Global Natural Energy Supplement Bar Volume K Forecast, by Country 2020 & 2033
- Table 61: Turkey Natural Energy Supplement Bar Revenue (undefined) Forecast, by Application 2020 & 2033
- Table 62: Turkey Natural Energy Supplement Bar Volume (K) Forecast, by Application 2020 & 2033
- Table 63: Israel Natural Energy Supplement Bar Revenue (undefined) Forecast, by Application 2020 & 2033
- Table 64: Israel Natural Energy Supplement Bar Volume (K) Forecast, by Application 2020 & 2033
- Table 65: GCC Natural Energy Supplement Bar Revenue (undefined) Forecast, by Application 2020 & 2033
- Table 66: GCC Natural Energy Supplement Bar Volume (K) Forecast, by Application 2020 & 2033
- Table 67: North Africa Natural Energy Supplement Bar Revenue (undefined) Forecast, by Application 2020 & 2033
- Table 68: North Africa Natural Energy Supplement Bar Volume (K) Forecast, by Application 2020 & 2033
- Table 69: South Africa Natural Energy Supplement Bar Revenue (undefined) Forecast, by Application 2020 & 2033
- Table 70: South Africa Natural Energy Supplement Bar Volume (K) Forecast, by Application 2020 & 2033
- Table 71: Rest of Middle East & Africa Natural Energy Supplement Bar Revenue (undefined) Forecast, by Application 2020 & 2033
- Table 72: Rest of Middle East & Africa Natural Energy Supplement Bar Volume (K) Forecast, by Application 2020 & 2033
- Table 73: Global Natural Energy Supplement Bar Revenue undefined Forecast, by Application 2020 & 2033
- Table 74: Global Natural Energy Supplement Bar Volume K Forecast, by Application 2020 & 2033
- Table 75: Global Natural Energy Supplement Bar Revenue undefined Forecast, by Type 2020 & 2033
- Table 76: Global Natural Energy Supplement Bar Volume K Forecast, by Type 2020 & 2033
- Table 77: Global Natural Energy Supplement Bar Revenue undefined Forecast, by Country 2020 & 2033
- Table 78: Global Natural Energy Supplement Bar Volume K Forecast, by Country 2020 & 2033
- Table 79: China Natural Energy Supplement Bar Revenue (undefined) Forecast, by Application 2020 & 2033
- Table 80: China Natural Energy Supplement Bar Volume (K) Forecast, by Application 2020 & 2033
- Table 81: India Natural Energy Supplement Bar Revenue (undefined) Forecast, by Application 2020 & 2033
- Table 82: India Natural Energy Supplement Bar Volume (K) Forecast, by Application 2020 & 2033
- Table 83: Japan Natural Energy Supplement Bar Revenue (undefined) Forecast, by Application 2020 & 2033
- Table 84: Japan Natural Energy Supplement Bar Volume (K) Forecast, by Application 2020 & 2033
- Table 85: South Korea Natural Energy Supplement Bar Revenue (undefined) Forecast, by Application 2020 & 2033
- Table 86: South Korea Natural Energy Supplement Bar Volume (K) Forecast, by Application 2020 & 2033
- Table 87: ASEAN Natural Energy Supplement Bar Revenue (undefined) Forecast, by Application 2020 & 2033
- Table 88: ASEAN Natural Energy Supplement Bar Volume (K) Forecast, by Application 2020 & 2033
- Table 89: Oceania Natural Energy Supplement Bar Revenue (undefined) Forecast, by Application 2020 & 2033
- Table 90: Oceania Natural Energy Supplement Bar Volume (K) Forecast, by Application 2020 & 2033
- Table 91: Rest of Asia Pacific Natural Energy Supplement Bar Revenue (undefined) Forecast, by Application 2020 & 2033
- Table 92: Rest of Asia Pacific Natural Energy Supplement Bar Volume (K) Forecast, by Application 2020 & 2033
Frequently Asked Questions
1. What is the projected Compound Annual Growth Rate (CAGR) of the Natural Energy Supplement Bar?
The projected CAGR is approximately 9.4%.
2. Which companies are prominent players in the Natural Energy Supplement Bar?
Key companies in the market include Chia Charge, Science In Sport, Tribe, Trek, Prime, Clif Bar, Battle Oats, High5, Eastman, General Mills, Luna Bar, Nature Valley, PROBAR, Kate's Real Food, TAOS BAKES, Bobo’s Oat Bars.
3. What are the main segments of the Natural Energy Supplement Bar?
The market segments include Application, Type.
4. Can you provide details about the market size?
The market size is estimated to be USD XXX N/A as of 2022.
5. What are some drivers contributing to market growth?
N/A
6. What are the notable trends driving market growth?
N/A
7. Are there any restraints impacting market growth?
N/A
8. Can you provide examples of recent developments in the market?
N/A
9. What pricing options are available for accessing the report?
Pricing options include single-user, multi-user, and enterprise licenses priced at USD 3950.00, USD 5925.00, and USD 7900.00 respectively.
10. Is the market size provided in terms of value or volume?
The market size is provided in terms of value, measured in N/A and volume, measured in K.
11. Are there any specific market keywords associated with the report?
Yes, the market keyword associated with the report is "Natural Energy Supplement Bar," which aids in identifying and referencing the specific market segment covered.
12. How do I determine which pricing option suits my needs best?
The pricing options vary based on user requirements and access needs. Individual users may opt for single-user licenses, while businesses requiring broader access may choose multi-user or enterprise licenses for cost-effective access to the report.
13. Are there any additional resources or data provided in the Natural Energy Supplement Bar report?
While the report offers comprehensive insights, it's advisable to review the specific contents or supplementary materials provided to ascertain if additional resources or data are available.
14. How can I stay updated on further developments or reports in the Natural Energy Supplement Bar?
To stay informed about further developments, trends, and reports in the Natural Energy Supplement Bar, consider subscribing to industry newsletters, following relevant companies and organizations, or regularly checking reputable industry news sources and publications.
Methodology
Step 1 - Identification of Relevant Samples Size from Population Database


Step 2 - Approaches for Defining Global Market Size (Value, Volume* & Price*)

Note*: In applicable scenarios
Step 3 - Data Sources
Primary Research
- Web Analytics
- Survey Reports
- Research Institute
- Latest Research Reports
- Opinion Leaders
Secondary Research
- Annual Reports
- White Paper
- Latest Press Release
- Industry Association
- Paid Database
- Investor Presentations

Step 4 - Data Triangulation
Involves using different sources of information in order to increase the validity of a study
These sources are likely to be stakeholders in a program - participants, other researchers, program staff, other community members, and so on.
Then we put all data in single framework & apply various statistical tools to find out the dynamic on the market.
During the analysis stage, feedback from the stakeholder groups would be compared to determine areas of agreement as well as areas of divergence