

Key Insights
The global Office Pantry Service market is projected to reach $6.4 billion by 2025, experiencing a Compound Annual Growth Rate (CAGR) of 6.4% from 2025 to 2033. This growth is driven by increasing demand for enhanced employee well-being and productivity, coupled with the rise of sophisticated office environments. Businesses are recognizing the value of well-stocked pantries in boosting employee morale, reducing absenteeism, and cultivating an attractive workplace culture. The inclusion of convenient vending, modern coffee machines, and diverse food and beverage options is crucial for talent acquisition and retention, making office pantry services an essential element of modern workplace strategy.
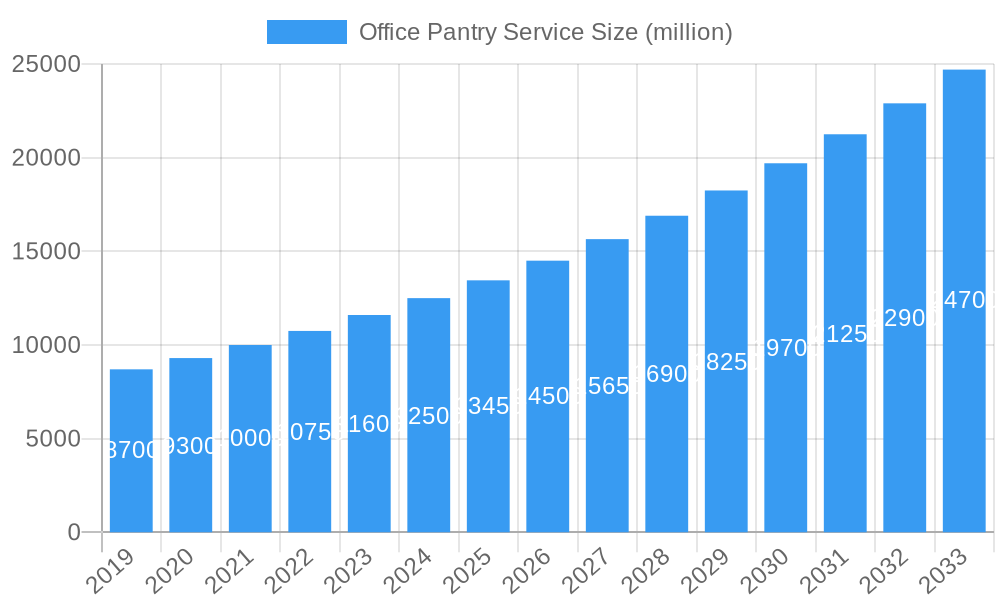
Office Pantry Service Market Size (In Billion)
Evolving workplace dynamics, including hybrid and remote work models, are also fueling market expansion. Companies are investing in premium amenities to incentivize in-office presence and foster collaboration. Key growth drivers include rising disposable incomes, increasing urbanization, and a heightened employer awareness of the connection between employee satisfaction and organizational success. Challenges such as high initial setup costs for equipment and logistical complexities in inventory management may present hurdles. However, innovative service models and technological advancements in inventory management and delivery are actively mitigating these issues, facilitating sustained global market penetration. The competitive landscape features major players like Nestlé SA, Compass Group, and Sodexo, alongside a growing number of specialized providers.
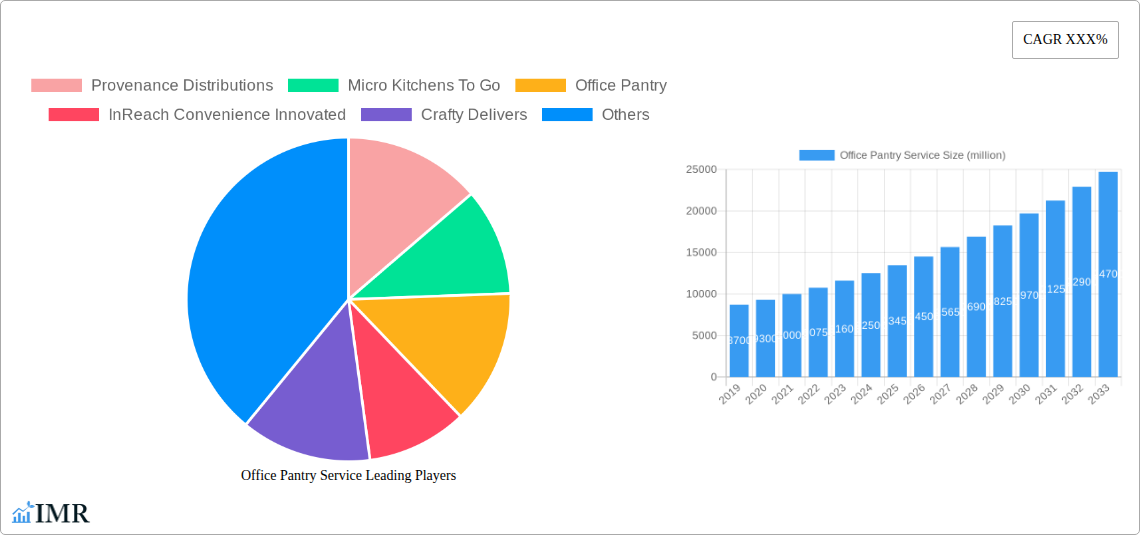
Office Pantry Service Company Market Share
Office Pantry Service Market Dynamics & Structure
The global office pantry service market exhibits a moderately concentrated structure, with key players like Nestlé SA, Compass Group, Keurig Dr Pepper, and Sodexo holding significant market shares. The market is driven by continuous technological innovation, particularly in smart vending machines and automated inventory management systems. Regulatory frameworks, while generally supportive of business operations, can influence product sourcing and safety standards. Competitive product substitutes include in-house catering, meal delivery services, and individual employee provision. End-user demographics are shifting towards a younger, more health-conscious workforce demanding diverse and convenient refreshment options. Mergers and acquisitions (M&A) are prevalent as larger entities seek to consolidate market presence and expand service portfolios. M&A deal volumes are projected to increase by 15% in the forecast period.
- Market Concentration: Top 5 players hold approximately 60% market share.
- Technological Innovation: Focus on IoT integration for vending machines and AI for demand forecasting.
- Regulatory Influence: Food safety and hygiene standards are paramount.
- End-User Preferences: Growing demand for organic, plant-based, and specialty beverages.
- M&A Activity: Driven by economies of scale and service diversification.
Office Pantry Service Growth Trends & Insights
The office pantry service market is experiencing robust growth, driven by evolving workplace cultures and the increasing importance of employee well-being. The market size, valued at approximately $30 billion in the historical period, is projected to expand at a compound annual growth rate (CAGR) of 7.5% during the forecast period of 2025–2033. This expansion is fueled by the growing adoption of modern office designs that prioritize communal spaces and enhanced employee benefits. Technological disruptions, such as the integration of AI for personalized recommendations and subscription-based models for pantry supplies, are further accelerating adoption rates. Consumer behavior shifts are evident in the demand for healthier snack options, sustainable packaging, and on-demand delivery services for pantry essentials. The penetration of office pantry services in SMEs, which currently stands at around 55%, is expected to rise significantly as cost-effective, scalable solutions become more accessible. Large enterprises are increasingly leveraging these services not just as an amenity but as a strategic tool for employee retention and productivity enhancement. The perceived value of a well-stocked and attractive office pantry is becoming a critical factor in attracting and retaining top talent in a competitive job market. This trend is further amplified by the rise of hybrid work models, where companies are investing more in creating an engaging and rewarding in-office experience to encourage employee presence. The integration of digital platforms for ordering, feedback, and personalized offerings is also contributing to a more seamless and satisfying user experience, thereby driving higher engagement and loyalty. The industry is witnessing a paradigm shift from basic refreshment provision to a more holistic approach to workplace nourishment and employee satisfaction.
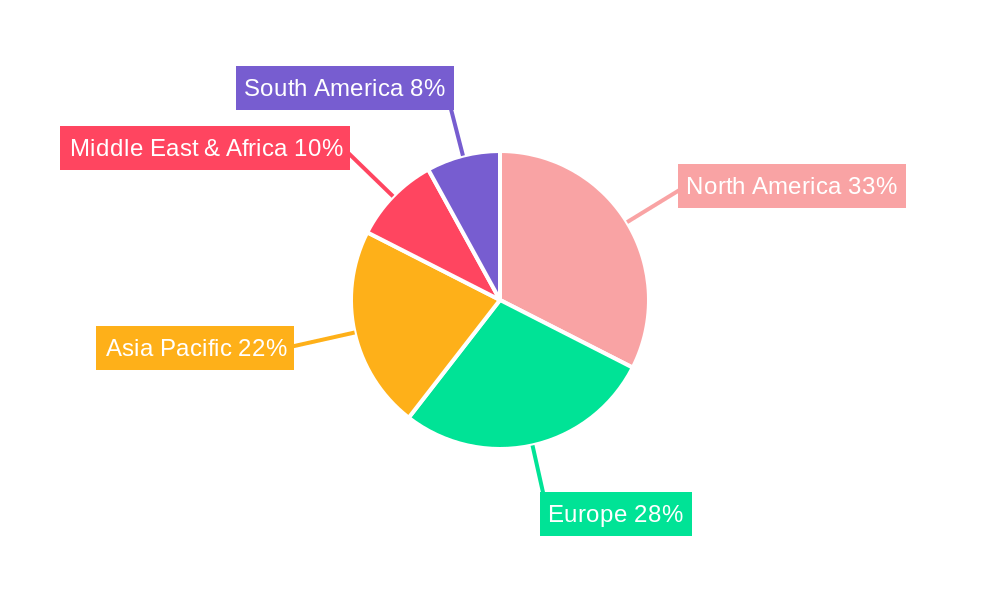
Dominant Regions, Countries, or Segments in Office Pantry Service
The North America region stands as the dominant force in the global office pantry service market, driven by its advanced economic policies, robust infrastructure, and a highly developed corporate culture that prioritizes employee welfare. Within North America, the United States holds a significant market share, estimated at over 40% of the regional total. Key drivers for this dominance include the high concentration of large enterprises and SMEs actively seeking to enhance their employee benefits packages to attract and retain talent. The increasing adoption of modern office designs that incorporate communal break rooms and refreshment zones further bolsters the demand for comprehensive office pantry solutions.
The dominance of North America, particularly the US, can be attributed to several factors:
- Economic Policies and Corporate Culture: A proactive approach by corporations towards employee well-being and productivity translates into higher investment in office pantry services. Tax incentives for employee benefits also play a role.
- Technological Adoption: The region has a high propensity for adopting new technologies, from smart vending machines to digital ordering platforms, which are integral to the modern office pantry experience.
- Market Penetration in Large Enterprises: A substantial number of Fortune 500 companies are headquartered in the US, and they are major consumers of these services, setting trends for other businesses.
- Growth Potential in SMEs: While large enterprises lead, the burgeoning SME sector in the US presents significant growth potential, as more small and medium-sized businesses recognize the competitive advantage of offering attractive pantry services.
- Presence of Key Players: The region is home to several leading office pantry service providers and vending machine manufacturers, fostering a competitive yet innovative environment.
Considering the Application segment, Large Enterprises represent the largest market share within office pantry services, estimated at approximately 65% of the total market value. This dominance stems from their larger employee base, greater budget allocation for employee benefits, and a strategic focus on creating a positive and productive work environment. Their capacity to implement comprehensive pantry programs, including diverse product selections, advanced dispensing technologies, and integrated service management, sets them apart. The demand from Large Enterprises is characterized by a need for scalable, reliable, and customizable solutions that cater to a wide range of employee preferences and dietary needs. These organizations often have dedicated HR or facilities management teams responsible for procuring and overseeing such services, ensuring a consistent and high-quality experience for their workforce.
Office Pantry Service Product Landscape
The office pantry service product landscape is characterized by a continuous stream of innovations aimed at enhancing convenience, variety, and health-consciousness. Smart vending machines with touch screens, mobile payment integration, and real-time inventory tracking are becoming standard. The offerings extend beyond traditional snacks and beverages to include fresh produce, healthy meal options, and personalized subscription boxes. Technological advancements like IoT integration for automated restocking and data analytics for predicting consumption patterns are crucial for optimizing service delivery and reducing waste. Unique selling propositions often revolve around customization, sustainability, and catering to specific dietary requirements, such as gluten-free, vegan, or allergen-free options.
Key Drivers, Barriers & Challenges in Office Pantry Service
Key Drivers:
- Evolving Workplace Culture: The increasing emphasis on employee well-being and work-life balance drives demand for enhanced office amenities.
- Talent Acquisition and Retention: A well-stocked pantry is viewed as a significant perk to attract and retain top talent.
- Technological Advancements: Smart vending machines, IoT integration, and data analytics improve efficiency and personalization.
- Health and Wellness Trends: Growing consumer awareness about healthy eating fuels demand for nutritious snack and beverage options.
Barriers & Challenges:
- Supply Chain Disruptions: Volatility in ingredient sourcing and logistics can impact product availability and cost.
- Regulatory Hurdles: Adherence to food safety, hygiene, and labeling regulations can be complex and costly.
- Competitive Pressures: The market faces intense competition from various service providers and alternative employee benefit solutions.
- Cost Management: Balancing the desire for premium offerings with budget constraints can be challenging for some businesses. The estimated impact of supply chain issues on operational costs is approximately 8% in the current market.
Emerging Opportunities in Office Pantry Service
Emerging opportunities in the office pantry service sector lie in the expansion of personalized wellness programs and the integration of sustainable practices. Untapped markets include smaller businesses that can benefit from tailored, cost-effective pantry solutions. Innovative applications include offering curated snack boxes based on employee health data or preferences, and the development of smart refrigerators that can dispense personalized meals. Evolving consumer preferences for plant-based, ethically sourced, and locally produced items present significant growth avenues. The growing demand for "grab-and-go" healthy meal options and specialized dietary catering also opens new market segments.
Growth Accelerators in the Office Pantry Service Industry
Technological breakthroughs in AI-powered demand forecasting and automated inventory management are key growth accelerators, enabling more efficient operations and reduced waste. Strategic partnerships between office pantry service providers and food manufacturers, as well as wellness platforms, can expand service offerings and market reach. Furthermore, market expansion strategies targeting remote workforces with flexible pantry solutions and the increasing focus on corporate social responsibility (CSR) through sustainable sourcing and waste reduction initiatives are significant growth catalysts. The development of subscription models for customized pantry solutions will also fuel long-term growth.
Key Players Shaping the Office Pantry Service Market
- Provenance Distributions
- Micro Kitchens To Go
- Office Pantry
- InReach Convenience Innovated
- Crafty Delivers
- Dependable Break Room Solutions
- Corporate Essentials
- C&S Vending
- Nestlé SA
- Compass Group
- Keurig Dr Pepper
- Sodexo
- Royal Cup Coffee
- Cantaloupe, Inc.
- Blue Tiger Coffee USA
- Continental Vending
Notable Milestones in Office Pantry Service Sector
- 2019: Increased adoption of IoT in vending machines for real-time data analytics.
- 2020: Surge in demand for contactless payment solutions due to global health concerns.
- 2021: Expansion of plant-based and organic snack options in corporate pantries.
- 2022: Introduction of AI-powered personalized product recommendations by leading providers.
- 2023: Growing focus on sustainable packaging and waste reduction initiatives.
- 2024: Increased M&A activity as larger players consolidate market share.
In-Depth Office Pantry Service Market Outlook
The office pantry service market is poised for sustained growth, propelled by the confluence of evolving workplace dynamics, technological innovation, and a heightened focus on employee well-being. Growth accelerators such as AI-driven operational efficiencies and strategic alliances will continue to shape the industry landscape. The market's future potential lies in its ability to adapt to increasingly diverse workforce needs, offering personalized, healthy, and sustainable refreshment solutions. Companies that can leverage data analytics for predictive stocking and offer truly customized pantry experiences will be well-positioned for long-term success and market leadership in the coming years.
Office Pantry Service Segmentation
-
1. Application
- 1.1. Large Enterprises
- 1.2. SMEs
-
2. Type
- 2.1. Coffee Machine
- 2.2. Vending Machine
- 2.3. Others
Office Pantry Service Segmentation By Geography
-
1. North America
- 1.1. United States
- 1.2. Canada
- 1.3. Mexico
-
2. South America
- 2.1. Brazil
- 2.2. Argentina
- 2.3. Rest of South America
-
3. Europe
- 3.1. United Kingdom
- 3.2. Germany
- 3.3. France
- 3.4. Italy
- 3.5. Spain
- 3.6. Russia
- 3.7. Benelux
- 3.8. Nordics
- 3.9. Rest of Europe
-
4. Middle East & Africa
- 4.1. Turkey
- 4.2. Israel
- 4.3. GCC
- 4.4. North Africa
- 4.5. South Africa
- 4.6. Rest of Middle East & Africa
-
5. Asia Pacific
- 5.1. China
- 5.2. India
- 5.3. Japan
- 5.4. South Korea
- 5.5. ASEAN
- 5.6. Oceania
- 5.7. Rest of Asia Pacific
Office Pantry Service Regional Market Share
Geographic Coverage of Office Pantry Service
Office Pantry Service REPORT HIGHLIGHTS
| Aspects | Details |
|---|---|
| Study Period | 2020-2034 |
| Base Year | 2025 |
| Estimated Year | 2026 |
| Forecast Period | 2026-2034 |
| Historical Period | 2020-2025 |
| Growth Rate | CAGR of 6.4% from 2020-2034 |
| Segmentation |
|
Table of Contents
- 1. Introduction
- 1.1. Research Scope
- 1.2. Market Segmentation
- 1.3. Research Methodology
- 1.4. Definitions and Assumptions
- 2. Executive Summary
- 2.1. Introduction
- 3. Market Dynamics
- 3.1. Introduction
- 3.2. Market Drivers
- 3.3. Market Restrains
- 3.4. Market Trends
- 4. Market Factor Analysis
- 4.1. Porters Five Forces
- 4.2. Supply/Value Chain
- 4.3. PESTEL analysis
- 4.4. Market Entropy
- 4.5. Patent/Trademark Analysis
- 5. Global Office Pantry Service Analysis, Insights and Forecast, 2020-2032
- 5.1. Market Analysis, Insights and Forecast - by Application
- 5.1.1. Large Enterprises
- 5.1.2. SMEs
- 5.2. Market Analysis, Insights and Forecast - by Type
- 5.2.1. Coffee Machine
- 5.2.2. Vending Machine
- 5.2.3. Others
- 5.3. Market Analysis, Insights and Forecast - by Region
- 5.3.1. North America
- 5.3.2. South America
- 5.3.3. Europe
- 5.3.4. Middle East & Africa
- 5.3.5. Asia Pacific
- 5.1. Market Analysis, Insights and Forecast - by Application
- 6. North America Office Pantry Service Analysis, Insights and Forecast, 2020-2032
- 6.1. Market Analysis, Insights and Forecast - by Application
- 6.1.1. Large Enterprises
- 6.1.2. SMEs
- 6.2. Market Analysis, Insights and Forecast - by Type
- 6.2.1. Coffee Machine
- 6.2.2. Vending Machine
- 6.2.3. Others
- 6.1. Market Analysis, Insights and Forecast - by Application
- 7. South America Office Pantry Service Analysis, Insights and Forecast, 2020-2032
- 7.1. Market Analysis, Insights and Forecast - by Application
- 7.1.1. Large Enterprises
- 7.1.2. SMEs
- 7.2. Market Analysis, Insights and Forecast - by Type
- 7.2.1. Coffee Machine
- 7.2.2. Vending Machine
- 7.2.3. Others
- 7.1. Market Analysis, Insights and Forecast - by Application
- 8. Europe Office Pantry Service Analysis, Insights and Forecast, 2020-2032
- 8.1. Market Analysis, Insights and Forecast - by Application
- 8.1.1. Large Enterprises
- 8.1.2. SMEs
- 8.2. Market Analysis, Insights and Forecast - by Type
- 8.2.1. Coffee Machine
- 8.2.2. Vending Machine
- 8.2.3. Others
- 8.1. Market Analysis, Insights and Forecast - by Application
- 9. Middle East & Africa Office Pantry Service Analysis, Insights and Forecast, 2020-2032
- 9.1. Market Analysis, Insights and Forecast - by Application
- 9.1.1. Large Enterprises
- 9.1.2. SMEs
- 9.2. Market Analysis, Insights and Forecast - by Type
- 9.2.1. Coffee Machine
- 9.2.2. Vending Machine
- 9.2.3. Others
- 9.1. Market Analysis, Insights and Forecast - by Application
- 10. Asia Pacific Office Pantry Service Analysis, Insights and Forecast, 2020-2032
- 10.1. Market Analysis, Insights and Forecast - by Application
- 10.1.1. Large Enterprises
- 10.1.2. SMEs
- 10.2. Market Analysis, Insights and Forecast - by Type
- 10.2.1. Coffee Machine
- 10.2.2. Vending Machine
- 10.2.3. Others
- 10.1. Market Analysis, Insights and Forecast - by Application
- 11. Competitive Analysis
- 11.1. Global Market Share Analysis 2025
- 11.2. Company Profiles
- 11.2.1 Provenance Distributions
- 11.2.1.1. Overview
- 11.2.1.2. Products
- 11.2.1.3. SWOT Analysis
- 11.2.1.4. Recent Developments
- 11.2.1.5. Financials (Based on Availability)
- 11.2.2 Micro Kitchens To Go
- 11.2.2.1. Overview
- 11.2.2.2. Products
- 11.2.2.3. SWOT Analysis
- 11.2.2.4. Recent Developments
- 11.2.2.5. Financials (Based on Availability)
- 11.2.3 Office Pantry
- 11.2.3.1. Overview
- 11.2.3.2. Products
- 11.2.3.3. SWOT Analysis
- 11.2.3.4. Recent Developments
- 11.2.3.5. Financials (Based on Availability)
- 11.2.4 InReach Convenience Innovated
- 11.2.4.1. Overview
- 11.2.4.2. Products
- 11.2.4.3. SWOT Analysis
- 11.2.4.4. Recent Developments
- 11.2.4.5. Financials (Based on Availability)
- 11.2.5 Crafty Delivers
- 11.2.5.1. Overview
- 11.2.5.2. Products
- 11.2.5.3. SWOT Analysis
- 11.2.5.4. Recent Developments
- 11.2.5.5. Financials (Based on Availability)
- 11.2.6 Dependable Break Room Solutions
- 11.2.6.1. Overview
- 11.2.6.2. Products
- 11.2.6.3. SWOT Analysis
- 11.2.6.4. Recent Developments
- 11.2.6.5. Financials (Based on Availability)
- 11.2.7 Corporate Essentials
- 11.2.7.1. Overview
- 11.2.7.2. Products
- 11.2.7.3. SWOT Analysis
- 11.2.7.4. Recent Developments
- 11.2.7.5. Financials (Based on Availability)
- 11.2.8 C&S Vending
- 11.2.8.1. Overview
- 11.2.8.2. Products
- 11.2.8.3. SWOT Analysis
- 11.2.8.4. Recent Developments
- 11.2.8.5. Financials (Based on Availability)
- 11.2.9 Nestlé SA
- 11.2.9.1. Overview
- 11.2.9.2. Products
- 11.2.9.3. SWOT Analysis
- 11.2.9.4. Recent Developments
- 11.2.9.5. Financials (Based on Availability)
- 11.2.10 Compass Group
- 11.2.10.1. Overview
- 11.2.10.2. Products
- 11.2.10.3. SWOT Analysis
- 11.2.10.4. Recent Developments
- 11.2.10.5. Financials (Based on Availability)
- 11.2.11 Keurig Dr Pepper
- 11.2.11.1. Overview
- 11.2.11.2. Products
- 11.2.11.3. SWOT Analysis
- 11.2.11.4. Recent Developments
- 11.2.11.5. Financials (Based on Availability)
- 11.2.12 Sodexo
- 11.2.12.1. Overview
- 11.2.12.2. Products
- 11.2.12.3. SWOT Analysis
- 11.2.12.4. Recent Developments
- 11.2.12.5. Financials (Based on Availability)
- 11.2.13 Royal Cup Coffee
- 11.2.13.1. Overview
- 11.2.13.2. Products
- 11.2.13.3. SWOT Analysis
- 11.2.13.4. Recent Developments
- 11.2.13.5. Financials (Based on Availability)
- 11.2.14 Cantaloupe
- 11.2.14.1. Overview
- 11.2.14.2. Products
- 11.2.14.3. SWOT Analysis
- 11.2.14.4. Recent Developments
- 11.2.14.5. Financials (Based on Availability)
- 11.2.15 Inc.
- 11.2.15.1. Overview
- 11.2.15.2. Products
- 11.2.15.3. SWOT Analysis
- 11.2.15.4. Recent Developments
- 11.2.15.5. Financials (Based on Availability)
- 11.2.16 Blue Tiger Coffee USA
- 11.2.16.1. Overview
- 11.2.16.2. Products
- 11.2.16.3. SWOT Analysis
- 11.2.16.4. Recent Developments
- 11.2.16.5. Financials (Based on Availability)
- 11.2.17 Continental Vending
- 11.2.17.1. Overview
- 11.2.17.2. Products
- 11.2.17.3. SWOT Analysis
- 11.2.17.4. Recent Developments
- 11.2.17.5. Financials (Based on Availability)
- 11.2.1 Provenance Distributions
List of Figures
- Figure 1: Global Office Pantry Service Revenue Breakdown (billion, %) by Region 2025 & 2033
- Figure 2: North America Office Pantry Service Revenue (billion), by Application 2025 & 2033
- Figure 3: North America Office Pantry Service Revenue Share (%), by Application 2025 & 2033
- Figure 4: North America Office Pantry Service Revenue (billion), by Type 2025 & 2033
- Figure 5: North America Office Pantry Service Revenue Share (%), by Type 2025 & 2033
- Figure 6: North America Office Pantry Service Revenue (billion), by Country 2025 & 2033
- Figure 7: North America Office Pantry Service Revenue Share (%), by Country 2025 & 2033
- Figure 8: South America Office Pantry Service Revenue (billion), by Application 2025 & 2033
- Figure 9: South America Office Pantry Service Revenue Share (%), by Application 2025 & 2033
- Figure 10: South America Office Pantry Service Revenue (billion), by Type 2025 & 2033
- Figure 11: South America Office Pantry Service Revenue Share (%), by Type 2025 & 2033
- Figure 12: South America Office Pantry Service Revenue (billion), by Country 2025 & 2033
- Figure 13: South America Office Pantry Service Revenue Share (%), by Country 2025 & 2033
- Figure 14: Europe Office Pantry Service Revenue (billion), by Application 2025 & 2033
- Figure 15: Europe Office Pantry Service Revenue Share (%), by Application 2025 & 2033
- Figure 16: Europe Office Pantry Service Revenue (billion), by Type 2025 & 2033
- Figure 17: Europe Office Pantry Service Revenue Share (%), by Type 2025 & 2033
- Figure 18: Europe Office Pantry Service Revenue (billion), by Country 2025 & 2033
- Figure 19: Europe Office Pantry Service Revenue Share (%), by Country 2025 & 2033
- Figure 20: Middle East & Africa Office Pantry Service Revenue (billion), by Application 2025 & 2033
- Figure 21: Middle East & Africa Office Pantry Service Revenue Share (%), by Application 2025 & 2033
- Figure 22: Middle East & Africa Office Pantry Service Revenue (billion), by Type 2025 & 2033
- Figure 23: Middle East & Africa Office Pantry Service Revenue Share (%), by Type 2025 & 2033
- Figure 24: Middle East & Africa Office Pantry Service Revenue (billion), by Country 2025 & 2033
- Figure 25: Middle East & Africa Office Pantry Service Revenue Share (%), by Country 2025 & 2033
- Figure 26: Asia Pacific Office Pantry Service Revenue (billion), by Application 2025 & 2033
- Figure 27: Asia Pacific Office Pantry Service Revenue Share (%), by Application 2025 & 2033
- Figure 28: Asia Pacific Office Pantry Service Revenue (billion), by Type 2025 & 2033
- Figure 29: Asia Pacific Office Pantry Service Revenue Share (%), by Type 2025 & 2033
- Figure 30: Asia Pacific Office Pantry Service Revenue (billion), by Country 2025 & 2033
- Figure 31: Asia Pacific Office Pantry Service Revenue Share (%), by Country 2025 & 2033
List of Tables
- Table 1: Global Office Pantry Service Revenue billion Forecast, by Application 2020 & 2033
- Table 2: Global Office Pantry Service Revenue billion Forecast, by Type 2020 & 2033
- Table 3: Global Office Pantry Service Revenue billion Forecast, by Region 2020 & 2033
- Table 4: Global Office Pantry Service Revenue billion Forecast, by Application 2020 & 2033
- Table 5: Global Office Pantry Service Revenue billion Forecast, by Type 2020 & 2033
- Table 6: Global Office Pantry Service Revenue billion Forecast, by Country 2020 & 2033
- Table 7: United States Office Pantry Service Revenue (billion) Forecast, by Application 2020 & 2033
- Table 8: Canada Office Pantry Service Revenue (billion) Forecast, by Application 2020 & 2033
- Table 9: Mexico Office Pantry Service Revenue (billion) Forecast, by Application 2020 & 2033
- Table 10: Global Office Pantry Service Revenue billion Forecast, by Application 2020 & 2033
- Table 11: Global Office Pantry Service Revenue billion Forecast, by Type 2020 & 2033
- Table 12: Global Office Pantry Service Revenue billion Forecast, by Country 2020 & 2033
- Table 13: Brazil Office Pantry Service Revenue (billion) Forecast, by Application 2020 & 2033
- Table 14: Argentina Office Pantry Service Revenue (billion) Forecast, by Application 2020 & 2033
- Table 15: Rest of South America Office Pantry Service Revenue (billion) Forecast, by Application 2020 & 2033
- Table 16: Global Office Pantry Service Revenue billion Forecast, by Application 2020 & 2033
- Table 17: Global Office Pantry Service Revenue billion Forecast, by Type 2020 & 2033
- Table 18: Global Office Pantry Service Revenue billion Forecast, by Country 2020 & 2033
- Table 19: United Kingdom Office Pantry Service Revenue (billion) Forecast, by Application 2020 & 2033
- Table 20: Germany Office Pantry Service Revenue (billion) Forecast, by Application 2020 & 2033
- Table 21: France Office Pantry Service Revenue (billion) Forecast, by Application 2020 & 2033
- Table 22: Italy Office Pantry Service Revenue (billion) Forecast, by Application 2020 & 2033
- Table 23: Spain Office Pantry Service Revenue (billion) Forecast, by Application 2020 & 2033
- Table 24: Russia Office Pantry Service Revenue (billion) Forecast, by Application 2020 & 2033
- Table 25: Benelux Office Pantry Service Revenue (billion) Forecast, by Application 2020 & 2033
- Table 26: Nordics Office Pantry Service Revenue (billion) Forecast, by Application 2020 & 2033
- Table 27: Rest of Europe Office Pantry Service Revenue (billion) Forecast, by Application 2020 & 2033
- Table 28: Global Office Pantry Service Revenue billion Forecast, by Application 2020 & 2033
- Table 29: Global Office Pantry Service Revenue billion Forecast, by Type 2020 & 2033
- Table 30: Global Office Pantry Service Revenue billion Forecast, by Country 2020 & 2033
- Table 31: Turkey Office Pantry Service Revenue (billion) Forecast, by Application 2020 & 2033
- Table 32: Israel Office Pantry Service Revenue (billion) Forecast, by Application 2020 & 2033
- Table 33: GCC Office Pantry Service Revenue (billion) Forecast, by Application 2020 & 2033
- Table 34: North Africa Office Pantry Service Revenue (billion) Forecast, by Application 2020 & 2033
- Table 35: South Africa Office Pantry Service Revenue (billion) Forecast, by Application 2020 & 2033
- Table 36: Rest of Middle East & Africa Office Pantry Service Revenue (billion) Forecast, by Application 2020 & 2033
- Table 37: Global Office Pantry Service Revenue billion Forecast, by Application 2020 & 2033
- Table 38: Global Office Pantry Service Revenue billion Forecast, by Type 2020 & 2033
- Table 39: Global Office Pantry Service Revenue billion Forecast, by Country 2020 & 2033
- Table 40: China Office Pantry Service Revenue (billion) Forecast, by Application 2020 & 2033
- Table 41: India Office Pantry Service Revenue (billion) Forecast, by Application 2020 & 2033
- Table 42: Japan Office Pantry Service Revenue (billion) Forecast, by Application 2020 & 2033
- Table 43: South Korea Office Pantry Service Revenue (billion) Forecast, by Application 2020 & 2033
- Table 44: ASEAN Office Pantry Service Revenue (billion) Forecast, by Application 2020 & 2033
- Table 45: Oceania Office Pantry Service Revenue (billion) Forecast, by Application 2020 & 2033
- Table 46: Rest of Asia Pacific Office Pantry Service Revenue (billion) Forecast, by Application 2020 & 2033
Frequently Asked Questions
1. What is the projected Compound Annual Growth Rate (CAGR) of the Office Pantry Service?
The projected CAGR is approximately 6.4%.
2. Which companies are prominent players in the Office Pantry Service?
Key companies in the market include Provenance Distributions, Micro Kitchens To Go, Office Pantry, InReach Convenience Innovated, Crafty Delivers, Dependable Break Room Solutions, Corporate Essentials, C&S Vending, Nestlé SA, Compass Group, Keurig Dr Pepper, Sodexo, Royal Cup Coffee, Cantaloupe, Inc., Blue Tiger Coffee USA, Continental Vending.
3. What are the main segments of the Office Pantry Service?
The market segments include Application, Type.
4. Can you provide details about the market size?
The market size is estimated to be USD 6.4 billion as of 2022.
5. What are some drivers contributing to market growth?
N/A
6. What are the notable trends driving market growth?
N/A
7. Are there any restraints impacting market growth?
N/A
8. Can you provide examples of recent developments in the market?
N/A
9. What pricing options are available for accessing the report?
Pricing options include single-user, multi-user, and enterprise licenses priced at USD 4250.00, USD 6375.00, and USD 8500.00 respectively.
10. Is the market size provided in terms of value or volume?
The market size is provided in terms of value, measured in billion.
11. Are there any specific market keywords associated with the report?
Yes, the market keyword associated with the report is "Office Pantry Service," which aids in identifying and referencing the specific market segment covered.
12. How do I determine which pricing option suits my needs best?
The pricing options vary based on user requirements and access needs. Individual users may opt for single-user licenses, while businesses requiring broader access may choose multi-user or enterprise licenses for cost-effective access to the report.
13. Are there any additional resources or data provided in the Office Pantry Service report?
While the report offers comprehensive insights, it's advisable to review the specific contents or supplementary materials provided to ascertain if additional resources or data are available.
14. How can I stay updated on further developments or reports in the Office Pantry Service?
To stay informed about further developments, trends, and reports in the Office Pantry Service, consider subscribing to industry newsletters, following relevant companies and organizations, or regularly checking reputable industry news sources and publications.
Methodology
Step 1 - Identification of Relevant Samples Size from Population Database


Step 2 - Approaches for Defining Global Market Size (Value, Volume* & Price*)

Note*: In applicable scenarios
Step 3 - Data Sources
Primary Research
- Web Analytics
- Survey Reports
- Research Institute
- Latest Research Reports
- Opinion Leaders
Secondary Research
- Annual Reports
- White Paper
- Latest Press Release
- Industry Association
- Paid Database
- Investor Presentations

Step 4 - Data Triangulation
Involves using different sources of information in order to increase the validity of a study
These sources are likely to be stakeholders in a program - participants, other researchers, program staff, other community members, and so on.
Then we put all data in single framework & apply various statistical tools to find out the dynamic on the market.
During the analysis stage, feedback from the stakeholder groups would be compared to determine areas of agreement as well as areas of divergence