

Key Insights
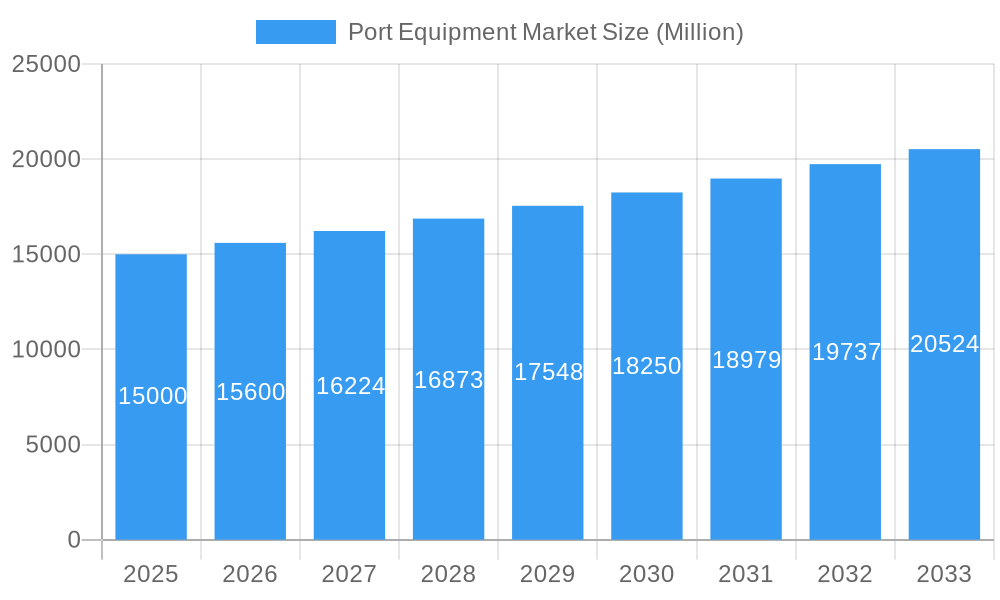
The global port equipment market is poised for significant expansion, driven by escalating international trade, critical port infrastructure enhancements, and the widespread adoption of automation and digitalization. The market, estimated at $20.4 billion in the base year 2025, is projected to grow at a compound annual growth rate (CAGR) of 5.7% through 2033. Key growth drivers include the robust demand for efficient cargo handling solutions to support surging container shipping volumes, the increasing integration of electric and hybrid technologies to meet sustainability mandates and reduce emissions, and the deployment of smart technologies like IoT and AI to optimize port operations and logistics. Despite these positive trends, significant initial investment costs, potential supply chain volatilities, and the requirement for skilled personnel to manage advanced equipment present ongoing challenges.
Port Equipment Market Market Size (In Billion)
In terms of segmentation, container handling equipment, including cranes and reach stackers, holds a dominant market share, followed by truck-based equipment and forklifts. Geographically, the Asia-Pacific region, led by China and India, commands the largest market share due to rapid economic development and extensive port expansion projects. North America and Europe are also substantial markets, characterized by ongoing modernization and upgrades at major port facilities. Leading industry players such as ABB Ltd, Liebherr Group, Konecranes Oyj, and Kalmar are actively influencing market dynamics through continuous technological innovation, strategic alliances, and merger and acquisition activities. The future outlook for the port equipment market is highly positive, with ongoing technological advancements expected to further elevate efficiency, productivity, and sustainability across the global port ecosystem, driven by the perpetual growth of international trade and the imperative for optimized port operations.
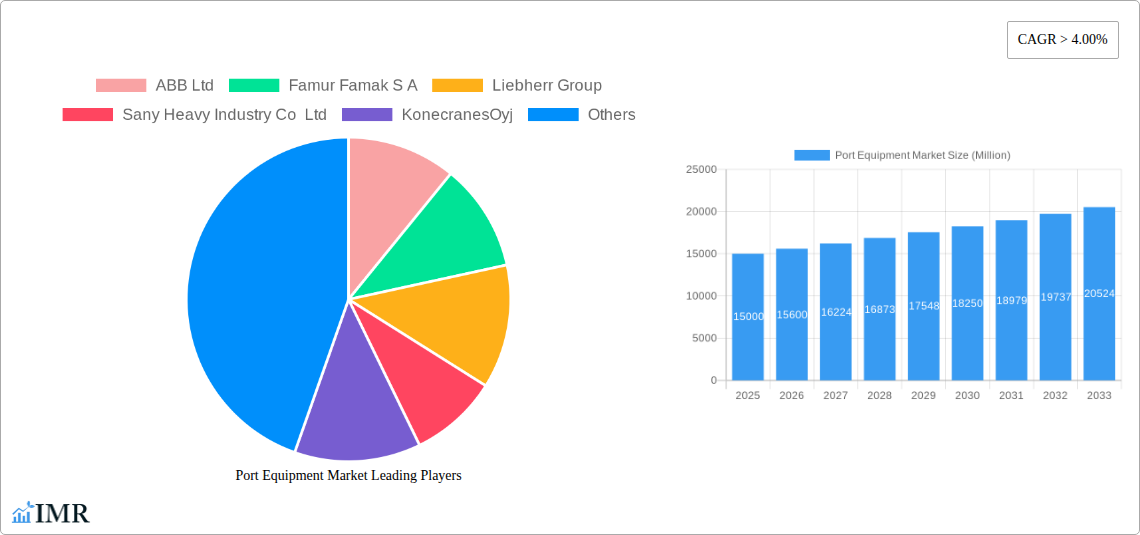
Port Equipment Market Company Market Share
Port Equipment Market: A Comprehensive Analysis (2019-2033)
This in-depth report provides a comprehensive analysis of the Port Equipment Market, encompassing market dynamics, growth trends, regional performance, product landscape, key players, and future outlook. The report covers the period 2019-2033, with a focus on the forecast period 2025-2033, utilizing 2025 as the base year. The market is segmented by equipment type (Cranes, Trucks, Reach Stackers, Forklifts, Others), application (Container Handling, Ship Handling), and fuel type (Diesel, Electric, Hybrid). The parent market is the Material Handling Equipment Market and the child market is the Port Infrastructure and Equipment market. The total market size is projected to reach xx Million units by 2033.
Port Equipment Market Market Dynamics & Structure
The Port Equipment market is characterized by moderate concentration, with several major players holding significant market share. Technological innovation, driven by automation, electrification, and digitalization, is a key driver. Stringent environmental regulations are pushing the adoption of cleaner fuel technologies like electric and hybrid systems. The market faces competition from substitute technologies, including automated guided vehicles (AGVs) and robotics in specific niche applications. End-user demographics are shifting towards larger, more automated ports, particularly in rapidly developing economies. M&A activity has been relatively moderate in recent years, with xx major deals recorded between 2019 and 2024, representing a combined market value of approximately xx Million units.
- Market Concentration: Moderately concentrated, with the top 5 players holding approximately xx% of the market share in 2024.
- Technological Innovation: Focus on automation, electrification (electric and hybrid systems), and data analytics for improved efficiency and reduced emissions.
- Regulatory Framework: Stringent emission regulations in key regions driving adoption of cleaner fuel technologies.
- Competitive Substitutes: AGVs and robotics pose a growing competitive threat in specific handling segments.
- End-User Demographics: Growth driven by expansion of major ports and increasing container traffic globally.
- M&A Trends: Moderate M&A activity, primarily focused on strategic acquisitions to expand product portfolios and geographic reach.
Port Equipment Market Growth Trends & Insights
The Port Equipment market experienced significant growth during the historical period (2019-2024), driven by rising global trade volumes and infrastructure development in major port hubs. The market size expanded from xx Million units in 2019 to xx Million units in 2024, registering a CAGR of xx%. Adoption rates of automated equipment are increasing, particularly in developed economies, while developing countries are witnessing a surge in demand for traditional diesel-powered equipment. Technological disruptions, such as the introduction of autonomous cranes and automated stacking systems, are transforming the industry landscape. Consumer behavior is shifting towards higher efficiency, lower operational costs, and environmentally friendly solutions. The forecast period (2025-2033) is projected to witness continued growth, with a projected CAGR of xx%, driven by sustained growth in global trade, increased port modernization initiatives, and technological advancements. Market penetration of electric and hybrid equipment is expected to increase significantly during this period.
Dominant Regions, Countries, or Segments in Port Equipment Market
The Asia-Pacific region dominated the Port Equipment market in 2024, holding approximately xx% of the global market share, driven by significant infrastructure investments in countries like China, India, and Singapore. Within equipment types, Cranes held the largest market share (xx%), followed by Trucks (xx%). Container handling applications accounted for the largest portion of the market, owing to the high volume of containerized cargo movement globally.
- Key Drivers in Asia-Pacific:
- Rapid economic growth and increasing port capacity expansions.
- Government initiatives promoting infrastructure development and trade facilitation.
- Rising e-commerce activities leading to increased demand for efficient port equipment.
- Dominance Factors: High container throughput volumes, significant investments in port infrastructure, and a large number of operating ports.
- Growth Potential: Significant growth potential exists in developing nations within the region, especially those experiencing rapid industrialization and urbanization.
Port Equipment Market Product Landscape
The Port Equipment market offers a wide range of products, from traditional diesel-powered equipment to advanced automated and electric systems. Recent innovations focus on enhancing operational efficiency, reducing emissions, and improving safety. Key features include advanced control systems, improved load handling capacity, and enhanced durability. Many manufacturers are incorporating telematics and remote diagnostics to optimize maintenance and reduce downtime. Unique selling propositions include enhanced automation capabilities, efficient fuel consumption, and improved safety features.
Key Drivers, Barriers & Challenges in Port Equipment Market
Key Drivers:
- Growing global trade volumes and increasing containerization.
- Investments in port infrastructure modernization and automation.
- Stringent environmental regulations driving adoption of cleaner technologies.
- Advancements in automation and digital technologies improving operational efficiency.
Key Challenges and Restraints:
- High initial investment costs associated with automated equipment.
- Skilled labor shortages for operation and maintenance of advanced systems.
- Supply chain disruptions impacting availability of critical components.
- Intense competition among established players and emerging entrants. This competition has resulted in a xx% decrease in average profit margins between 2019 and 2024.
Emerging Opportunities in Port Equipment Market
- Expanding adoption of autonomous and remotely operated equipment.
- Growth in demand for electric and hybrid systems.
- Increasing adoption of data analytics and IoT for optimizing operations.
- Focus on developing sustainable and environmentally friendly solutions.
- Development of specialized equipment for handling new types of cargo (e.g., wind turbine components).
Growth Accelerators in the Port Equipment Market Industry
Technological advancements, strategic partnerships, and market expansion into developing economies are key accelerators for long-term growth. Developments in Artificial Intelligence (AI) and machine learning are enabling greater automation and efficiency. Strategic collaborations between equipment manufacturers and port operators facilitate seamless integration and optimized deployment of advanced technologies. Expansion into developing countries offers significant growth potential, particularly in regions with expanding port infrastructure.
Key Players Shaping the Port Equipment Market Market
- ABB Ltd
- Famur Famak S A
- Liebherr Group
- Sany Heavy Industry Co Ltd
- Konecranes Oyj
- Cavote
- TTS Group
- Kalmar
- CVS Ferrari
- Hyster-Yale Group
Notable Milestones in Port Equipment Market Sector
- 2021 (Q3): ABB Ltd launched its next-generation automated container crane system.
- 2022 (Q1): Liebherr Group announced a strategic partnership with a major port operator to deploy automated stacking cranes.
- 2023 (Q2): Konecranes Oyj acquired a smaller competitor, expanding its reach in the reach stacker segment. This acquisition resulted in a xx% increase in Konecranes' market share.
- 2024 (Q4): Several key players unveiled new electric and hybrid models at a major industry trade show.
In-Depth Port Equipment Market Market Outlook
The Port Equipment market is poised for continued growth, driven by ongoing technological advancements and increasing investments in port infrastructure. Strategic opportunities exist for companies that can leverage automation, electrification, and data analytics to improve efficiency and sustainability. Expansion into emerging markets and development of innovative solutions for handling new types of cargo will be crucial for long-term success. The market is expected to continue its robust growth trajectory, with a positive outlook for the coming decade.
Port Equipment Market Segmentation
-
1. Equipment Type
- 1.1. Cranes
- 1.2. Trucks
- 1.3. Reach Stackers
- 1.4. Forklifts
- 1.5. Others
-
2. Application
- 2.1. Container Handling
- 2.2. Ship Handling
-
3. Fuel Type
- 3.1. Diesel
- 3.2. Electric
- 3.3. Hybrid
Port Equipment Market Segmentation By Geography
-
1. North America
- 1.1. United States
- 1.2. Canada
- 1.3. Rest of North America
-
2. Europe
- 2.1. Germany
- 2.2. United Kingdom
- 2.3. France
- 2.4. Rest of Europe
-
3. Asia Pacific
- 3.1. India
- 3.2. China
- 3.3. Japan
- 3.4. South Korea
- 3.5. Rest of Asia Pacific
-
4. Rest of the World
- 4.1. Brazil
- 4.2. Mexico
- 4.3. United Arab Emirates
- 4.4. Other Countries
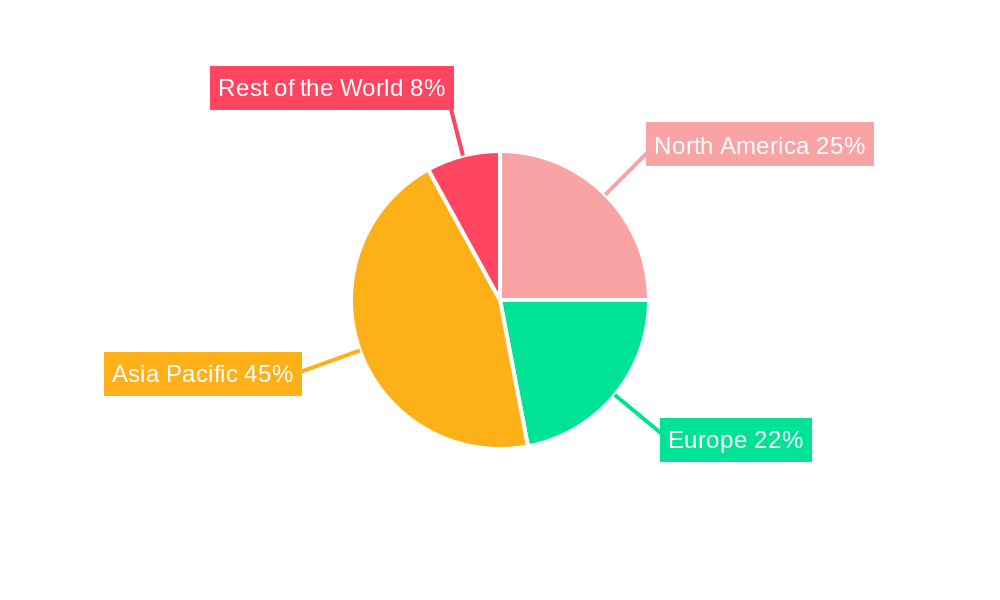
Port Equipment Market Regional Market Share
Geographic Coverage of Port Equipment Market
Port Equipment Market REPORT HIGHLIGHTS
| Aspects | Details |
|---|---|
| Study Period | 2020-2034 |
| Base Year | 2025 |
| Estimated Year | 2026 |
| Forecast Period | 2026-2034 |
| Historical Period | 2020-2025 |
| Growth Rate | CAGR of 5.7% from 2020-2034 |
| Segmentation |
|
Table of Contents
- 1. Introduction
- 1.1. Research Scope
- 1.2. Market Segmentation
- 1.3. Research Objective
- 1.4. Definitions and Assumptions
- 2. Executive Summary
- 2.1. Market Snapshot
- 3. Market Dynamics
- 3.1. Market Drivers
- 3.2. Market Restrains
- 3.3. Market Trends
- 3.4. Market Opportunities
- 4. Market Factor Analysis
- 4.1. Porters Five Forces
- 4.1.1. Bargaining Power of Suppliers
- 4.1.2. Bargaining Power of Buyers
- 4.1.3. Threat of New Entrants
- 4.1.4. Threat of Substitutes
- 4.1.5. Competitive Rivalry
- 4.2. PESTEL analysis
- 4.3. BCG Analysis
- 4.3.1. Stars (High Growth, High Market Share)
- 4.3.2. Cash Cows (Low Growth, High Market Share)
- 4.3.3. Question Mark (High Growth, Low Market Share)
- 4.3.4. Dogs (Low Growth, Low Market Share)
- 4.4. Ansoff Matrix Analysis
- 4.5. Supply Chain Analysis
- 4.6. Regulatory Landscape
- 4.7. Current Market Potential and Opportunity Assessment (TAM–SAM–SOM Framework)
- 4.8. IMR Analyst Note
- 4.1. Porters Five Forces
- 5. Market Analysis, Insights and Forecast 2021-2033
- 5.1. Market Analysis, Insights and Forecast - by Equipment Type
- 5.1.1. Cranes
- 5.1.2. Trucks
- 5.1.3. Reach Stackers
- 5.1.4. Forklifts
- 5.1.5. Others
- 5.2. Market Analysis, Insights and Forecast - by Application
- 5.2.1. Container Handling
- 5.2.2. Ship Handling
- 5.3. Market Analysis, Insights and Forecast - by Fuel Type
- 5.3.1. Diesel
- 5.3.2. Electric
- 5.3.3. Hybrid
- 5.4. Market Analysis, Insights and Forecast - by Region
- 5.4.1. North America
- 5.4.2. Europe
- 5.4.3. Asia Pacific
- 5.4.4. Rest of the World
- 5.1. Market Analysis, Insights and Forecast - by Equipment Type
- 6. Global Port Equipment Market Analysis, Insights and Forecast, 2021-2033
- 6.1. Market Analysis, Insights and Forecast - by Equipment Type
- 6.1.1. Cranes
- 6.1.2. Trucks
- 6.1.3. Reach Stackers
- 6.1.4. Forklifts
- 6.1.5. Others
- 6.2. Market Analysis, Insights and Forecast - by Application
- 6.2.1. Container Handling
- 6.2.2. Ship Handling
- 6.3. Market Analysis, Insights and Forecast - by Fuel Type
- 6.3.1. Diesel
- 6.3.2. Electric
- 6.3.3. Hybrid
- 6.1. Market Analysis, Insights and Forecast - by Equipment Type
- 7. North America Port Equipment Market Analysis, Insights and Forecast, 2020-2032
- 7.1. Market Analysis, Insights and Forecast - by Equipment Type
- 7.1.1. Cranes
- 7.1.2. Trucks
- 7.1.3. Reach Stackers
- 7.1.4. Forklifts
- 7.1.5. Others
- 7.2. Market Analysis, Insights and Forecast - by Application
- 7.2.1. Container Handling
- 7.2.2. Ship Handling
- 7.3. Market Analysis, Insights and Forecast - by Fuel Type
- 7.3.1. Diesel
- 7.3.2. Electric
- 7.3.3. Hybrid
- 7.1. Market Analysis, Insights and Forecast - by Equipment Type
- 8. Europe Port Equipment Market Analysis, Insights and Forecast, 2020-2032
- 8.1. Market Analysis, Insights and Forecast - by Equipment Type
- 8.1.1. Cranes
- 8.1.2. Trucks
- 8.1.3. Reach Stackers
- 8.1.4. Forklifts
- 8.1.5. Others
- 8.2. Market Analysis, Insights and Forecast - by Application
- 8.2.1. Container Handling
- 8.2.2. Ship Handling
- 8.3. Market Analysis, Insights and Forecast - by Fuel Type
- 8.3.1. Diesel
- 8.3.2. Electric
- 8.3.3. Hybrid
- 8.1. Market Analysis, Insights and Forecast - by Equipment Type
- 9. Asia Pacific Port Equipment Market Analysis, Insights and Forecast, 2020-2032
- 9.1. Market Analysis, Insights and Forecast - by Equipment Type
- 9.1.1. Cranes
- 9.1.2. Trucks
- 9.1.3. Reach Stackers
- 9.1.4. Forklifts
- 9.1.5. Others
- 9.2. Market Analysis, Insights and Forecast - by Application
- 9.2.1. Container Handling
- 9.2.2. Ship Handling
- 9.3. Market Analysis, Insights and Forecast - by Fuel Type
- 9.3.1. Diesel
- 9.3.2. Electric
- 9.3.3. Hybrid
- 9.1. Market Analysis, Insights and Forecast - by Equipment Type
- 10. Rest of the World Port Equipment Market Analysis, Insights and Forecast, 2020-2032
- 10.1. Market Analysis, Insights and Forecast - by Equipment Type
- 10.1.1. Cranes
- 10.1.2. Trucks
- 10.1.3. Reach Stackers
- 10.1.4. Forklifts
- 10.1.5. Others
- 10.2. Market Analysis, Insights and Forecast - by Application
- 10.2.1. Container Handling
- 10.2.2. Ship Handling
- 10.3. Market Analysis, Insights and Forecast - by Fuel Type
- 10.3.1. Diesel
- 10.3.2. Electric
- 10.3.3. Hybrid
- 10.1. Market Analysis, Insights and Forecast - by Equipment Type
- 11. Competitive Analysis
- 11.1. Company Profiles
- 11.1.1 ABB Ltd
- 11.1.1.1. Company Overview
- 11.1.1.2. Products
- 11.1.1.3. Company Financials
- 11.1.1.4. SWOT Analysis
- 11.1.2 Famur Famak S A
- 11.1.2.1. Company Overview
- 11.1.2.2. Products
- 11.1.2.3. Company Financials
- 11.1.2.4. SWOT Analysis
- 11.1.3 Liebherr Group
- 11.1.3.1. Company Overview
- 11.1.3.2. Products
- 11.1.3.3. Company Financials
- 11.1.3.4. SWOT Analysis
- 11.1.4 Sany Heavy Industry Co Ltd
- 11.1.4.1. Company Overview
- 11.1.4.2. Products
- 11.1.4.3. Company Financials
- 11.1.4.4. SWOT Analysis
- 11.1.5 KonecranesOyj
- 11.1.5.1. Company Overview
- 11.1.5.2. Products
- 11.1.5.3. Company Financials
- 11.1.5.4. SWOT Analysis
- 11.1.6 Cavote
- 11.1.6.1. Company Overview
- 11.1.6.2. Products
- 11.1.6.3. Company Financials
- 11.1.6.4. SWOT Analysis
- 11.1.7 TTS Group
- 11.1.7.1. Company Overview
- 11.1.7.2. Products
- 11.1.7.3. Company Financials
- 11.1.7.4. SWOT Analysis
- 11.1.8 Kalmar
- 11.1.8.1. Company Overview
- 11.1.8.2. Products
- 11.1.8.3. Company Financials
- 11.1.8.4. SWOT Analysis
- 11.1.9 CVS Ferrari
- 11.1.9.1. Company Overview
- 11.1.9.2. Products
- 11.1.9.3. Company Financials
- 11.1.9.4. SWOT Analysis
- 11.1.10 Hyster-Yale Group
- 11.1.10.1. Company Overview
- 11.1.10.2. Products
- 11.1.10.3. Company Financials
- 11.1.10.4. SWOT Analysis
- 11.1.1 ABB Ltd
- 11.2. Market Entropy
- 11.2.1 Company's Key Areas Served
- 11.2.2 Recent Developments
- 11.3. Company Market Share Analysis 2025
- 11.3.1 Top 5 Companies Market Share Analysis
- 11.3.2 Top 3 Companies Market Share Analysis
- 11.4. List of Potential Customers
- 12. Research Methodology
List of Figures
- Figure 1: Global Port Equipment Market Revenue Breakdown (billion, %) by Region 2025 & 2033
- Figure 2: North America Port Equipment Market Revenue (billion), by Equipment Type 2025 & 2033
- Figure 3: North America Port Equipment Market Revenue Share (%), by Equipment Type 2025 & 2033
- Figure 4: North America Port Equipment Market Revenue (billion), by Application 2025 & 2033
- Figure 5: North America Port Equipment Market Revenue Share (%), by Application 2025 & 2033
- Figure 6: North America Port Equipment Market Revenue (billion), by Fuel Type 2025 & 2033
- Figure 7: North America Port Equipment Market Revenue Share (%), by Fuel Type 2025 & 2033
- Figure 8: North America Port Equipment Market Revenue (billion), by Country 2025 & 2033
- Figure 9: North America Port Equipment Market Revenue Share (%), by Country 2025 & 2033
- Figure 10: Europe Port Equipment Market Revenue (billion), by Equipment Type 2025 & 2033
- Figure 11: Europe Port Equipment Market Revenue Share (%), by Equipment Type 2025 & 2033
- Figure 12: Europe Port Equipment Market Revenue (billion), by Application 2025 & 2033
- Figure 13: Europe Port Equipment Market Revenue Share (%), by Application 2025 & 2033
- Figure 14: Europe Port Equipment Market Revenue (billion), by Fuel Type 2025 & 2033
- Figure 15: Europe Port Equipment Market Revenue Share (%), by Fuel Type 2025 & 2033
- Figure 16: Europe Port Equipment Market Revenue (billion), by Country 2025 & 2033
- Figure 17: Europe Port Equipment Market Revenue Share (%), by Country 2025 & 2033
- Figure 18: Asia Pacific Port Equipment Market Revenue (billion), by Equipment Type 2025 & 2033
- Figure 19: Asia Pacific Port Equipment Market Revenue Share (%), by Equipment Type 2025 & 2033
- Figure 20: Asia Pacific Port Equipment Market Revenue (billion), by Application 2025 & 2033
- Figure 21: Asia Pacific Port Equipment Market Revenue Share (%), by Application 2025 & 2033
- Figure 22: Asia Pacific Port Equipment Market Revenue (billion), by Fuel Type 2025 & 2033
- Figure 23: Asia Pacific Port Equipment Market Revenue Share (%), by Fuel Type 2025 & 2033
- Figure 24: Asia Pacific Port Equipment Market Revenue (billion), by Country 2025 & 2033
- Figure 25: Asia Pacific Port Equipment Market Revenue Share (%), by Country 2025 & 2033
- Figure 26: Rest of the World Port Equipment Market Revenue (billion), by Equipment Type 2025 & 2033
- Figure 27: Rest of the World Port Equipment Market Revenue Share (%), by Equipment Type 2025 & 2033
- Figure 28: Rest of the World Port Equipment Market Revenue (billion), by Application 2025 & 2033
- Figure 29: Rest of the World Port Equipment Market Revenue Share (%), by Application 2025 & 2033
- Figure 30: Rest of the World Port Equipment Market Revenue (billion), by Fuel Type 2025 & 2033
- Figure 31: Rest of the World Port Equipment Market Revenue Share (%), by Fuel Type 2025 & 2033
- Figure 32: Rest of the World Port Equipment Market Revenue (billion), by Country 2025 & 2033
- Figure 33: Rest of the World Port Equipment Market Revenue Share (%), by Country 2025 & 2033
List of Tables
- Table 1: Global Port Equipment Market Revenue billion Forecast, by Equipment Type 2020 & 2033
- Table 2: Global Port Equipment Market Revenue billion Forecast, by Application 2020 & 2033
- Table 3: Global Port Equipment Market Revenue billion Forecast, by Fuel Type 2020 & 2033
- Table 4: Global Port Equipment Market Revenue billion Forecast, by Region 2020 & 2033
- Table 5: Global Port Equipment Market Revenue billion Forecast, by Equipment Type 2020 & 2033
- Table 6: Global Port Equipment Market Revenue billion Forecast, by Application 2020 & 2033
- Table 7: Global Port Equipment Market Revenue billion Forecast, by Fuel Type 2020 & 2033
- Table 8: Global Port Equipment Market Revenue billion Forecast, by Country 2020 & 2033
- Table 9: United States Port Equipment Market Revenue (billion) Forecast, by Application 2020 & 2033
- Table 10: Canada Port Equipment Market Revenue (billion) Forecast, by Application 2020 & 2033
- Table 11: Rest of North America Port Equipment Market Revenue (billion) Forecast, by Application 2020 & 2033
- Table 12: Global Port Equipment Market Revenue billion Forecast, by Equipment Type 2020 & 2033
- Table 13: Global Port Equipment Market Revenue billion Forecast, by Application 2020 & 2033
- Table 14: Global Port Equipment Market Revenue billion Forecast, by Fuel Type 2020 & 2033
- Table 15: Global Port Equipment Market Revenue billion Forecast, by Country 2020 & 2033
- Table 16: Germany Port Equipment Market Revenue (billion) Forecast, by Application 2020 & 2033
- Table 17: United Kingdom Port Equipment Market Revenue (billion) Forecast, by Application 2020 & 2033
- Table 18: France Port Equipment Market Revenue (billion) Forecast, by Application 2020 & 2033
- Table 19: Rest of Europe Port Equipment Market Revenue (billion) Forecast, by Application 2020 & 2033
- Table 20: Global Port Equipment Market Revenue billion Forecast, by Equipment Type 2020 & 2033
- Table 21: Global Port Equipment Market Revenue billion Forecast, by Application 2020 & 2033
- Table 22: Global Port Equipment Market Revenue billion Forecast, by Fuel Type 2020 & 2033
- Table 23: Global Port Equipment Market Revenue billion Forecast, by Country 2020 & 2033
- Table 24: India Port Equipment Market Revenue (billion) Forecast, by Application 2020 & 2033
- Table 25: China Port Equipment Market Revenue (billion) Forecast, by Application 2020 & 2033
- Table 26: Japan Port Equipment Market Revenue (billion) Forecast, by Application 2020 & 2033
- Table 27: South Korea Port Equipment Market Revenue (billion) Forecast, by Application 2020 & 2033
- Table 28: Rest of Asia Pacific Port Equipment Market Revenue (billion) Forecast, by Application 2020 & 2033
- Table 29: Global Port Equipment Market Revenue billion Forecast, by Equipment Type 2020 & 2033
- Table 30: Global Port Equipment Market Revenue billion Forecast, by Application 2020 & 2033
- Table 31: Global Port Equipment Market Revenue billion Forecast, by Fuel Type 2020 & 2033
- Table 32: Global Port Equipment Market Revenue billion Forecast, by Country 2020 & 2033
- Table 33: Brazil Port Equipment Market Revenue (billion) Forecast, by Application 2020 & 2033
- Table 34: Mexico Port Equipment Market Revenue (billion) Forecast, by Application 2020 & 2033
- Table 35: United Arab Emirates Port Equipment Market Revenue (billion) Forecast, by Application 2020 & 2033
- Table 36: Other Countries Port Equipment Market Revenue (billion) Forecast, by Application 2020 & 2033
Frequently Asked Questions
1. What is the projected Compound Annual Growth Rate (CAGR) of the Port Equipment Market?
The projected CAGR is approximately 5.7%.
2. Which companies are prominent players in the Port Equipment Market?
Key companies in the market include ABB Ltd, Famur Famak S A, Liebherr Group, Sany Heavy Industry Co Ltd, KonecranesOyj, Cavote, TTS Group, Kalmar, CVS Ferrari, Hyster-Yale Group.
3. What are the main segments of the Port Equipment Market?
The market segments include Equipment Type, Application, Fuel Type.
4. Can you provide details about the market size?
The market size is estimated to be USD 20.4 billion as of 2022.
5. What are some drivers contributing to market growth?
Increasing disposable income and Low-interest rates from lenders increase the market demand.
6. What are the notable trends driving market growth?
Government Initiatives for Development of Ports are Driving the Market.
7. Are there any restraints impacting market growth?
High initial costs may obstruct the growth.
8. Can you provide examples of recent developments in the market?
N/A
9. What pricing options are available for accessing the report?
Pricing options include single-user, multi-user, and enterprise licenses priced at USD 4750, USD 5250, and USD 8750 respectively.
10. Is the market size provided in terms of value or volume?
The market size is provided in terms of value, measured in billion.
11. Are there any specific market keywords associated with the report?
Yes, the market keyword associated with the report is "Port Equipment Market," which aids in identifying and referencing the specific market segment covered.
12. How do I determine which pricing option suits my needs best?
The pricing options vary based on user requirements and access needs. Individual users may opt for single-user licenses, while businesses requiring broader access may choose multi-user or enterprise licenses for cost-effective access to the report.
13. Are there any additional resources or data provided in the Port Equipment Market report?
While the report offers comprehensive insights, it's advisable to review the specific contents or supplementary materials provided to ascertain if additional resources or data are available.
14. How can I stay updated on further developments or reports in the Port Equipment Market?
To stay informed about further developments, trends, and reports in the Port Equipment Market, consider subscribing to industry newsletters, following relevant companies and organizations, or regularly checking reputable industry news sources and publications.
Methodology
Step 1 - Identification of Relevant Samples Size from Population Database


Step 2 - Approaches for Defining Global Market Size (Value, Volume* & Price*)

Note*: In applicable scenarios
Step 3 - Data Sources
Primary Research
- Web Analytics
- Survey Reports
- Research Institute
- Latest Research Reports
- Opinion Leaders
Secondary Research
- Annual Reports
- White Paper
- Latest Press Release
- Industry Association
- Paid Database
- Investor Presentations

Step 4 - Data Triangulation
Involves using different sources of information in order to increase the validity of a study
These sources are likely to be stakeholders in a program - participants, other researchers, program staff, other community members, and so on.
Then we put all data in single framework & apply various statistical tools to find out the dynamic on the market.
During the analysis stage, feedback from the stakeholder groups would be compared to determine areas of agreement as well as areas of divergence