

Key Insights
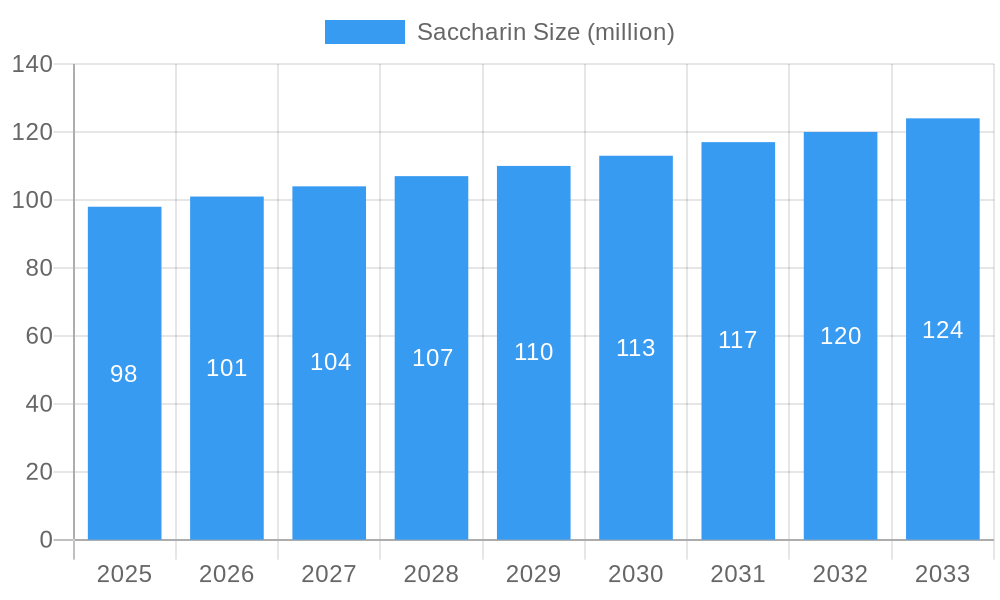
The global saccharin market, valued at approximately $98 million in 2025, is projected to exhibit a steady growth trajectory, driven by its widespread use as a low-calorie sweetener in various food and beverage applications. The 3% CAGR suggests a consistent demand, fueled by the rising prevalence of diet-conscious consumers and the increasing incidence of diabetes globally. Key market drivers include the growing demand for sugar substitutes in health-conscious products, cost-effectiveness compared to other high-intensity sweeteners, and its long shelf life. However, potential market restraints include growing consumer awareness regarding the potential health risks associated with artificial sweeteners and the emergence of alternative, natural sweeteners. The market is segmented based on application (food and beverages, pharmaceuticals, and others), geographic location (with regional variations likely influenced by dietary habits and regulatory landscapes), and product type (granular, liquid, and others). Major players like Kaifeng Xinghua, Tianjin Changjie, and PMC Specialties are shaping market competition through product innovation and strategic partnerships. The forecast period (2025-2033) anticipates continued growth, albeit at a moderate pace, reflecting a balance between increasing demand and potential regulatory shifts and evolving consumer preferences. This moderate growth is further supported by the fact that many countries are now actively encouraging the use of natural sweeteners in a bid to tackle health concerns.
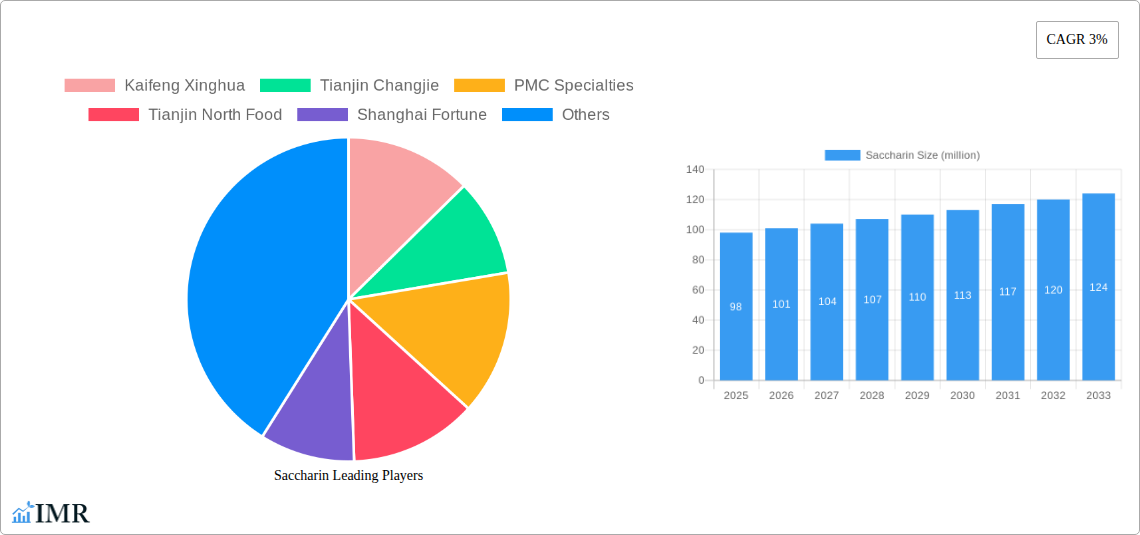
Saccharin Market Size (In Million)
The market's future will depend on consumer perceptions of artificial sweeteners, the introduction of new regulations governing food additives, and the continued innovation and competitiveness within the industry. Ongoing research into the long-term health effects of saccharin could significantly impact market growth. Companies will need to focus on strategies that address consumer concerns regarding artificial sweeteners, such as highlighting the benefits of reduced sugar intake while simultaneously emphasizing the safety and quality of their products. Diversification into new applications and geographic markets will also be crucial for sustained growth in the coming years. The expansion into emerging markets, particularly in Asia and Africa, offers significant potential for market expansion due to increased disposable income and changing dietary habits.
Saccharin Company Market Share
Saccharin Market Report: A Comprehensive Analysis (2019-2033)
This comprehensive report provides an in-depth analysis of the global saccharin market, offering invaluable insights for industry professionals, investors, and strategic decision-makers. The study covers the period from 2019 to 2033, with 2025 serving as the base and estimated year. We analyze market dynamics, growth trends, key players, and future opportunities across various segments, providing a clear understanding of this dynamic market. This report is crucial for navigating the complexities of the saccharin landscape and making informed strategic choices.
Saccharin Market Dynamics & Structure
The global saccharin market, valued at xx million units in 2024, is characterized by moderate concentration, with key players holding significant market shares. Technological innovation, primarily focused on improved production efficiency and purity, is a key driver. Stringent regulatory frameworks concerning food additives significantly impact market dynamics, while competitive pressures from alternative sweeteners such as sucralose and stevia create challenges. The end-user demographics are broad, encompassing food and beverage manufacturers, pharmaceutical companies, and personal care industries. M&A activity in the past five years has been relatively low, with approximately xx deals recorded, indicating a stable yet competitive landscape.
- Market Concentration: Moderately concentrated, with top 5 players holding approximately xx% market share in 2024.
- Technological Innovation: Focus on enhanced production processes and higher purity levels, leading to cost reduction and improved product quality.
- Regulatory Landscape: Stringent regulations on food additives pose both opportunities and challenges, driving demand for high-quality, compliant products.
- Competitive Substitutes: Sucralose, stevia, and aspartame present significant competitive pressure.
- End-User Demographics: Diverse, encompassing food & beverage, pharmaceuticals, and personal care sectors.
- M&A Activity (2019-2024): xx deals, indicating a relatively stable market with potential for consolidation.
Saccharin Growth Trends & Insights
The global saccharin market exhibited a CAGR of xx% during the historical period (2019-2024), driven by increasing demand from the food and beverage industry, particularly in developing economies. The rising prevalence of diet-conscious consumers and the growing acceptance of artificial sweeteners have fueled market growth. Technological advancements, such as improved production methods and enhanced purification techniques, have contributed to increased efficiency and reduced costs. Shifting consumer preferences towards healthier food and beverage options and the increasing prevalence of diabetes and obesity have further propelled demand. The market penetration of saccharin is expected to reach xx% by 2033. Furthermore, innovations in product formulations have expanded application possibilities. We project a CAGR of xx% from 2025 to 2033, with the market expected to reach xx million units by 2033.
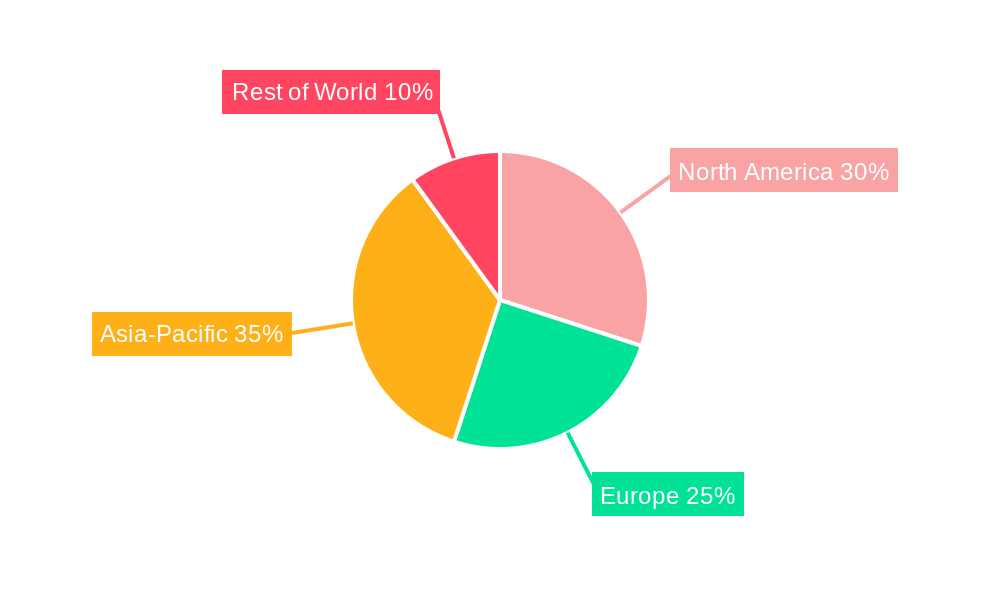
Dominant Regions, Countries, or Segments in Saccharin
Asia-Pacific, particularly China and India, dominates the global saccharin market, driven by factors such as large populations, rising disposable incomes, and increasing consumption of processed foods and beverages. The region’s robust economic growth and expanding food and beverage industries are major contributors. Strong government support for the food processing sector and favorable regulatory environments also play a crucial role. North America and Europe hold significant market shares, driven by established food and beverage industries and high consumer awareness of artificial sweeteners.
- Key Drivers in Asia-Pacific:
- Rapid economic growth and expanding middle class.
- Increasing consumption of processed foods and beverages.
- Favorable regulatory environments and government support.
- Key Drivers in North America & Europe:
- Established food & beverage industries.
- High consumer awareness and acceptance of artificial sweeteners.
Saccharin Product Landscape
Saccharin is predominantly available in granular and liquid forms, catering to diverse applications. Recent innovations focus on improving purity, enhancing taste profiles, and developing specialized formulations for specific applications. These advancements enhance the product's versatility across various industries, including food, beverages, pharmaceuticals, and personal care products. The unique selling proposition of saccharin lies in its intense sweetness, stability, and cost-effectiveness.
Key Drivers, Barriers & Challenges in Saccharin
Key Drivers:
- Rising demand for low-calorie sweeteners.
- Increasing prevalence of diabetes and obesity.
- Growing popularity of processed foods and beverages.
- Cost-effectiveness of saccharin compared to other sweeteners.
Key Challenges & Restraints:
- Concerns about potential health risks associated with saccharin consumption have led to strict regulations and labelling requirements, impacting market growth.
- The competitive landscape, with alternative sweeteners such as sucralose and stevia gaining popularity, presents significant challenges.
- Fluctuations in raw material prices, impacting production costs and profitability. Supply chain disruptions can also affect availability and pricing.
Emerging Opportunities in Saccharin
Emerging opportunities lie in untapped markets in developing economies and the expansion into niche applications such as functional foods and beverages. The development of novel formulations addressing taste and texture challenges offers significant potential. Growing demand for low-calorie and sugar-free options fuels growth across diverse sectors, opening new market segments.
Growth Accelerators in the Saccharin Industry
Technological advancements in production processes, strategic partnerships to expand market reach, and the development of innovative product formulations are crucial for accelerating market growth. Expansion into new geographical regions and exploration of novel applications represent further opportunities for significant growth.
Key Players Shaping the Saccharin Market
- Kaifeng Xinghua
- Tianjin Changjie
- PMC Specialties
- Tianjin North Food
- Shanghai Fortune
- Two Lions
- Productos Aditivos
- Salvichem
- JMC
- Shree Vardayini
- Vishnuchrome
- Aviditya Chemicals
- D K
- PT Bantang Alum
- PT. GOLDEN SARI
Notable Milestones in Saccharin Sector
- 2020: Introduction of a new, high-purity saccharin formulation by PMC Specialties.
- 2022: Acquisition of a smaller saccharin producer by Kaifeng Xinghua, expanding its market presence.
- 2023: Launch of a novel saccharin-based sweetener blend by Shanghai Fortune targeting the beverage sector. (Further milestones to be added as data becomes available)
In-Depth Saccharin Market Outlook
The saccharin market is poised for significant growth in the coming years, driven by the factors highlighted in this report. Strategic partnerships, technological innovations, and expansion into new markets will play a key role in shaping the future landscape. Companies focusing on sustainable production practices and addressing consumer concerns regarding health and safety are likely to experience the most success. The market's future trajectory hinges on navigating regulatory challenges, managing competitive pressures, and capitalizing on opportunities presented by evolving consumer preferences.
Saccharin Segmentation
-
1. Application
- 1.1. Food & Beverage
- 1.2. Pharmaceuticals
- 1.3. Daily Chemical
- 1.4. Other
-
2. Type
- 2.1. Insoluble Saccharin
- 2.2. Soluble Saccharin
Saccharin Segmentation By Geography
-
1. North America
- 1.1. United States
- 1.2. Canada
- 1.3. Mexico
-
2. South America
- 2.1. Brazil
- 2.2. Argentina
- 2.3. Rest of South America
-
3. Europe
- 3.1. United Kingdom
- 3.2. Germany
- 3.3. France
- 3.4. Italy
- 3.5. Spain
- 3.6. Russia
- 3.7. Benelux
- 3.8. Nordics
- 3.9. Rest of Europe
-
4. Middle East & Africa
- 4.1. Turkey
- 4.2. Israel
- 4.3. GCC
- 4.4. North Africa
- 4.5. South Africa
- 4.6. Rest of Middle East & Africa
-
5. Asia Pacific
- 5.1. China
- 5.2. India
- 5.3. Japan
- 5.4. South Korea
- 5.5. ASEAN
- 5.6. Oceania
- 5.7. Rest of Asia Pacific
Saccharin Regional Market Share
Geographic Coverage of Saccharin
Saccharin REPORT HIGHLIGHTS
| Aspects | Details |
|---|---|
| Study Period | 2020-2034 |
| Base Year | 2025 |
| Estimated Year | 2026 |
| Forecast Period | 2026-2034 |
| Historical Period | 2020-2025 |
| Growth Rate | CAGR of 3% from 2020-2034 |
| Segmentation |
|
Table of Contents
- 1. Introduction
- 1.1. Research Scope
- 1.2. Market Segmentation
- 1.3. Research Methodology
- 1.4. Definitions and Assumptions
- 2. Executive Summary
- 2.1. Introduction
- 3. Market Dynamics
- 3.1. Introduction
- 3.2. Market Drivers
- 3.3. Market Restrains
- 3.4. Market Trends
- 4. Market Factor Analysis
- 4.1. Porters Five Forces
- 4.2. Supply/Value Chain
- 4.3. PESTEL analysis
- 4.4. Market Entropy
- 4.5. Patent/Trademark Analysis
- 5. Global Saccharin Analysis, Insights and Forecast, 2020-2032
- 5.1. Market Analysis, Insights and Forecast - by Application
- 5.1.1. Food & Beverage
- 5.1.2. Pharmaceuticals
- 5.1.3. Daily Chemical
- 5.1.4. Other
- 5.2. Market Analysis, Insights and Forecast - by Type
- 5.2.1. Insoluble Saccharin
- 5.2.2. Soluble Saccharin
- 5.3. Market Analysis, Insights and Forecast - by Region
- 5.3.1. North America
- 5.3.2. South America
- 5.3.3. Europe
- 5.3.4. Middle East & Africa
- 5.3.5. Asia Pacific
- 5.1. Market Analysis, Insights and Forecast - by Application
- 6. North America Saccharin Analysis, Insights and Forecast, 2020-2032
- 6.1. Market Analysis, Insights and Forecast - by Application
- 6.1.1. Food & Beverage
- 6.1.2. Pharmaceuticals
- 6.1.3. Daily Chemical
- 6.1.4. Other
- 6.2. Market Analysis, Insights and Forecast - by Type
- 6.2.1. Insoluble Saccharin
- 6.2.2. Soluble Saccharin
- 6.1. Market Analysis, Insights and Forecast - by Application
- 7. South America Saccharin Analysis, Insights and Forecast, 2020-2032
- 7.1. Market Analysis, Insights and Forecast - by Application
- 7.1.1. Food & Beverage
- 7.1.2. Pharmaceuticals
- 7.1.3. Daily Chemical
- 7.1.4. Other
- 7.2. Market Analysis, Insights and Forecast - by Type
- 7.2.1. Insoluble Saccharin
- 7.2.2. Soluble Saccharin
- 7.1. Market Analysis, Insights and Forecast - by Application
- 8. Europe Saccharin Analysis, Insights and Forecast, 2020-2032
- 8.1. Market Analysis, Insights and Forecast - by Application
- 8.1.1. Food & Beverage
- 8.1.2. Pharmaceuticals
- 8.1.3. Daily Chemical
- 8.1.4. Other
- 8.2. Market Analysis, Insights and Forecast - by Type
- 8.2.1. Insoluble Saccharin
- 8.2.2. Soluble Saccharin
- 8.1. Market Analysis, Insights and Forecast - by Application
- 9. Middle East & Africa Saccharin Analysis, Insights and Forecast, 2020-2032
- 9.1. Market Analysis, Insights and Forecast - by Application
- 9.1.1. Food & Beverage
- 9.1.2. Pharmaceuticals
- 9.1.3. Daily Chemical
- 9.1.4. Other
- 9.2. Market Analysis, Insights and Forecast - by Type
- 9.2.1. Insoluble Saccharin
- 9.2.2. Soluble Saccharin
- 9.1. Market Analysis, Insights and Forecast - by Application
- 10. Asia Pacific Saccharin Analysis, Insights and Forecast, 2020-2032
- 10.1. Market Analysis, Insights and Forecast - by Application
- 10.1.1. Food & Beverage
- 10.1.2. Pharmaceuticals
- 10.1.3. Daily Chemical
- 10.1.4. Other
- 10.2. Market Analysis, Insights and Forecast - by Type
- 10.2.1. Insoluble Saccharin
- 10.2.2. Soluble Saccharin
- 10.1. Market Analysis, Insights and Forecast - by Application
- 11. Competitive Analysis
- 11.1. Global Market Share Analysis 2025
- 11.2. Company Profiles
- 11.2.1 Kaifeng Xinghua
- 11.2.1.1. Overview
- 11.2.1.2. Products
- 11.2.1.3. SWOT Analysis
- 11.2.1.4. Recent Developments
- 11.2.1.5. Financials (Based on Availability)
- 11.2.2 Tianjin Changjie
- 11.2.2.1. Overview
- 11.2.2.2. Products
- 11.2.2.3. SWOT Analysis
- 11.2.2.4. Recent Developments
- 11.2.2.5. Financials (Based on Availability)
- 11.2.3 PMC Specialties
- 11.2.3.1. Overview
- 11.2.3.2. Products
- 11.2.3.3. SWOT Analysis
- 11.2.3.4. Recent Developments
- 11.2.3.5. Financials (Based on Availability)
- 11.2.4 Tianjin North Food
- 11.2.4.1. Overview
- 11.2.4.2. Products
- 11.2.4.3. SWOT Analysis
- 11.2.4.4. Recent Developments
- 11.2.4.5. Financials (Based on Availability)
- 11.2.5 Shanghai Fortune
- 11.2.5.1. Overview
- 11.2.5.2. Products
- 11.2.5.3. SWOT Analysis
- 11.2.5.4. Recent Developments
- 11.2.5.5. Financials (Based on Availability)
- 11.2.6 Two Lions
- 11.2.6.1. Overview
- 11.2.6.2. Products
- 11.2.6.3. SWOT Analysis
- 11.2.6.4. Recent Developments
- 11.2.6.5. Financials (Based on Availability)
- 11.2.7 Productos Aditivos
- 11.2.7.1. Overview
- 11.2.7.2. Products
- 11.2.7.3. SWOT Analysis
- 11.2.7.4. Recent Developments
- 11.2.7.5. Financials (Based on Availability)
- 11.2.8 Salvichem
- 11.2.8.1. Overview
- 11.2.8.2. Products
- 11.2.8.3. SWOT Analysis
- 11.2.8.4. Recent Developments
- 11.2.8.5. Financials (Based on Availability)
- 11.2.9 JMC
- 11.2.9.1. Overview
- 11.2.9.2. Products
- 11.2.9.3. SWOT Analysis
- 11.2.9.4. Recent Developments
- 11.2.9.5. Financials (Based on Availability)
- 11.2.10 Shree Vardayini
- 11.2.10.1. Overview
- 11.2.10.2. Products
- 11.2.10.3. SWOT Analysis
- 11.2.10.4. Recent Developments
- 11.2.10.5. Financials (Based on Availability)
- 11.2.11 Vishnuchrome
- 11.2.11.1. Overview
- 11.2.11.2. Products
- 11.2.11.3. SWOT Analysis
- 11.2.11.4. Recent Developments
- 11.2.11.5. Financials (Based on Availability)
- 11.2.12 Aviditya Chemicals
- 11.2.12.1. Overview
- 11.2.12.2. Products
- 11.2.12.3. SWOT Analysis
- 11.2.12.4. Recent Developments
- 11.2.12.5. Financials (Based on Availability)
- 11.2.13 D K
- 11.2.13.1. Overview
- 11.2.13.2. Products
- 11.2.13.3. SWOT Analysis
- 11.2.13.4. Recent Developments
- 11.2.13.5. Financials (Based on Availability)
- 11.2.14 PT Bantang Alum
- 11.2.14.1. Overview
- 11.2.14.2. Products
- 11.2.14.3. SWOT Analysis
- 11.2.14.4. Recent Developments
- 11.2.14.5. Financials (Based on Availability)
- 11.2.15 PT. GOLDEN SARI
- 11.2.15.1. Overview
- 11.2.15.2. Products
- 11.2.15.3. SWOT Analysis
- 11.2.15.4. Recent Developments
- 11.2.15.5. Financials (Based on Availability)
- 11.2.1 Kaifeng Xinghua
List of Figures
- Figure 1: Global Saccharin Revenue Breakdown (million, %) by Region 2025 & 2033
- Figure 2: North America Saccharin Revenue (million), by Application 2025 & 2033
- Figure 3: North America Saccharin Revenue Share (%), by Application 2025 & 2033
- Figure 4: North America Saccharin Revenue (million), by Type 2025 & 2033
- Figure 5: North America Saccharin Revenue Share (%), by Type 2025 & 2033
- Figure 6: North America Saccharin Revenue (million), by Country 2025 & 2033
- Figure 7: North America Saccharin Revenue Share (%), by Country 2025 & 2033
- Figure 8: South America Saccharin Revenue (million), by Application 2025 & 2033
- Figure 9: South America Saccharin Revenue Share (%), by Application 2025 & 2033
- Figure 10: South America Saccharin Revenue (million), by Type 2025 & 2033
- Figure 11: South America Saccharin Revenue Share (%), by Type 2025 & 2033
- Figure 12: South America Saccharin Revenue (million), by Country 2025 & 2033
- Figure 13: South America Saccharin Revenue Share (%), by Country 2025 & 2033
- Figure 14: Europe Saccharin Revenue (million), by Application 2025 & 2033
- Figure 15: Europe Saccharin Revenue Share (%), by Application 2025 & 2033
- Figure 16: Europe Saccharin Revenue (million), by Type 2025 & 2033
- Figure 17: Europe Saccharin Revenue Share (%), by Type 2025 & 2033
- Figure 18: Europe Saccharin Revenue (million), by Country 2025 & 2033
- Figure 19: Europe Saccharin Revenue Share (%), by Country 2025 & 2033
- Figure 20: Middle East & Africa Saccharin Revenue (million), by Application 2025 & 2033
- Figure 21: Middle East & Africa Saccharin Revenue Share (%), by Application 2025 & 2033
- Figure 22: Middle East & Africa Saccharin Revenue (million), by Type 2025 & 2033
- Figure 23: Middle East & Africa Saccharin Revenue Share (%), by Type 2025 & 2033
- Figure 24: Middle East & Africa Saccharin Revenue (million), by Country 2025 & 2033
- Figure 25: Middle East & Africa Saccharin Revenue Share (%), by Country 2025 & 2033
- Figure 26: Asia Pacific Saccharin Revenue (million), by Application 2025 & 2033
- Figure 27: Asia Pacific Saccharin Revenue Share (%), by Application 2025 & 2033
- Figure 28: Asia Pacific Saccharin Revenue (million), by Type 2025 & 2033
- Figure 29: Asia Pacific Saccharin Revenue Share (%), by Type 2025 & 2033
- Figure 30: Asia Pacific Saccharin Revenue (million), by Country 2025 & 2033
- Figure 31: Asia Pacific Saccharin Revenue Share (%), by Country 2025 & 2033
List of Tables
- Table 1: Global Saccharin Revenue million Forecast, by Application 2020 & 2033
- Table 2: Global Saccharin Revenue million Forecast, by Type 2020 & 2033
- Table 3: Global Saccharin Revenue million Forecast, by Region 2020 & 2033
- Table 4: Global Saccharin Revenue million Forecast, by Application 2020 & 2033
- Table 5: Global Saccharin Revenue million Forecast, by Type 2020 & 2033
- Table 6: Global Saccharin Revenue million Forecast, by Country 2020 & 2033
- Table 7: United States Saccharin Revenue (million) Forecast, by Application 2020 & 2033
- Table 8: Canada Saccharin Revenue (million) Forecast, by Application 2020 & 2033
- Table 9: Mexico Saccharin Revenue (million) Forecast, by Application 2020 & 2033
- Table 10: Global Saccharin Revenue million Forecast, by Application 2020 & 2033
- Table 11: Global Saccharin Revenue million Forecast, by Type 2020 & 2033
- Table 12: Global Saccharin Revenue million Forecast, by Country 2020 & 2033
- Table 13: Brazil Saccharin Revenue (million) Forecast, by Application 2020 & 2033
- Table 14: Argentina Saccharin Revenue (million) Forecast, by Application 2020 & 2033
- Table 15: Rest of South America Saccharin Revenue (million) Forecast, by Application 2020 & 2033
- Table 16: Global Saccharin Revenue million Forecast, by Application 2020 & 2033
- Table 17: Global Saccharin Revenue million Forecast, by Type 2020 & 2033
- Table 18: Global Saccharin Revenue million Forecast, by Country 2020 & 2033
- Table 19: United Kingdom Saccharin Revenue (million) Forecast, by Application 2020 & 2033
- Table 20: Germany Saccharin Revenue (million) Forecast, by Application 2020 & 2033
- Table 21: France Saccharin Revenue (million) Forecast, by Application 2020 & 2033
- Table 22: Italy Saccharin Revenue (million) Forecast, by Application 2020 & 2033
- Table 23: Spain Saccharin Revenue (million) Forecast, by Application 2020 & 2033
- Table 24: Russia Saccharin Revenue (million) Forecast, by Application 2020 & 2033
- Table 25: Benelux Saccharin Revenue (million) Forecast, by Application 2020 & 2033
- Table 26: Nordics Saccharin Revenue (million) Forecast, by Application 2020 & 2033
- Table 27: Rest of Europe Saccharin Revenue (million) Forecast, by Application 2020 & 2033
- Table 28: Global Saccharin Revenue million Forecast, by Application 2020 & 2033
- Table 29: Global Saccharin Revenue million Forecast, by Type 2020 & 2033
- Table 30: Global Saccharin Revenue million Forecast, by Country 2020 & 2033
- Table 31: Turkey Saccharin Revenue (million) Forecast, by Application 2020 & 2033
- Table 32: Israel Saccharin Revenue (million) Forecast, by Application 2020 & 2033
- Table 33: GCC Saccharin Revenue (million) Forecast, by Application 2020 & 2033
- Table 34: North Africa Saccharin Revenue (million) Forecast, by Application 2020 & 2033
- Table 35: South Africa Saccharin Revenue (million) Forecast, by Application 2020 & 2033
- Table 36: Rest of Middle East & Africa Saccharin Revenue (million) Forecast, by Application 2020 & 2033
- Table 37: Global Saccharin Revenue million Forecast, by Application 2020 & 2033
- Table 38: Global Saccharin Revenue million Forecast, by Type 2020 & 2033
- Table 39: Global Saccharin Revenue million Forecast, by Country 2020 & 2033
- Table 40: China Saccharin Revenue (million) Forecast, by Application 2020 & 2033
- Table 41: India Saccharin Revenue (million) Forecast, by Application 2020 & 2033
- Table 42: Japan Saccharin Revenue (million) Forecast, by Application 2020 & 2033
- Table 43: South Korea Saccharin Revenue (million) Forecast, by Application 2020 & 2033
- Table 44: ASEAN Saccharin Revenue (million) Forecast, by Application 2020 & 2033
- Table 45: Oceania Saccharin Revenue (million) Forecast, by Application 2020 & 2033
- Table 46: Rest of Asia Pacific Saccharin Revenue (million) Forecast, by Application 2020 & 2033
Frequently Asked Questions
1. What is the projected Compound Annual Growth Rate (CAGR) of the Saccharin?
The projected CAGR is approximately 3%.
2. Which companies are prominent players in the Saccharin?
Key companies in the market include Kaifeng Xinghua, Tianjin Changjie, PMC Specialties, Tianjin North Food, Shanghai Fortune, Two Lions, Productos Aditivos, Salvichem, JMC, Shree Vardayini, Vishnuchrome, Aviditya Chemicals, D K, PT Bantang Alum, PT. GOLDEN SARI.
3. What are the main segments of the Saccharin?
The market segments include Application, Type.
4. Can you provide details about the market size?
The market size is estimated to be USD 98 million as of 2022.
5. What are some drivers contributing to market growth?
N/A
6. What are the notable trends driving market growth?
N/A
7. Are there any restraints impacting market growth?
N/A
8. Can you provide examples of recent developments in the market?
N/A
9. What pricing options are available for accessing the report?
Pricing options include single-user, multi-user, and enterprise licenses priced at USD 5900.00, USD 8850.00, and USD 11800.00 respectively.
10. Is the market size provided in terms of value or volume?
The market size is provided in terms of value, measured in million.
11. Are there any specific market keywords associated with the report?
Yes, the market keyword associated with the report is "Saccharin," which aids in identifying and referencing the specific market segment covered.
12. How do I determine which pricing option suits my needs best?
The pricing options vary based on user requirements and access needs. Individual users may opt for single-user licenses, while businesses requiring broader access may choose multi-user or enterprise licenses for cost-effective access to the report.
13. Are there any additional resources or data provided in the Saccharin report?
While the report offers comprehensive insights, it's advisable to review the specific contents or supplementary materials provided to ascertain if additional resources or data are available.
14. How can I stay updated on further developments or reports in the Saccharin?
To stay informed about further developments, trends, and reports in the Saccharin, consider subscribing to industry newsletters, following relevant companies and organizations, or regularly checking reputable industry news sources and publications.
Methodology
Step 1 - Identification of Relevant Samples Size from Population Database


Step 2 - Approaches for Defining Global Market Size (Value, Volume* & Price*)

Note*: In applicable scenarios
Step 3 - Data Sources
Primary Research
- Web Analytics
- Survey Reports
- Research Institute
- Latest Research Reports
- Opinion Leaders
Secondary Research
- Annual Reports
- White Paper
- Latest Press Release
- Industry Association
- Paid Database
- Investor Presentations

Step 4 - Data Triangulation
Involves using different sources of information in order to increase the validity of a study
These sources are likely to be stakeholders in a program - participants, other researchers, program staff, other community members, and so on.
Then we put all data in single framework & apply various statistical tools to find out the dynamic on the market.
During the analysis stage, feedback from the stakeholder groups would be compared to determine areas of agreement as well as areas of divergence