


Key Insights
The Virtual Reality In Automotive Market is experiencing robust expansion, driven by the imperative for accelerated product development cycles, enhanced design fidelity, and immersive customer engagement strategies. Valued at $6926 million as of the base year, the market is projected to demonstrate an impressive Compound Annual Growth Rate (CAGR) of 20.1% through to 2034. This growth is underpinned by the automotive industry's increasing reliance on advanced visualization and simulation tools to reduce time-to-market, minimize physical prototyping costs, and elevate the overall engineering and manufacturing efficiency. Key demand drivers include the escalating complexity of vehicle systems, the necessity for collaborative global design workflows, and the emergence of hyper-realistic training environments for factory workers and technicians. The convergence of high-performance computing, advanced rendering engines, and sophisticated Haptics Technology Market integration is transforming how vehicles are conceived, developed, and marketed. Furthermore, the strategic adoption of VR in showrooms and for virtual test drives is revolutionizing the customer experience, allowing for unparalleled customization and interactive exploration of vehicle features. Macro tailwinds, such as sustained investment in digital transformation across the automotive value chain and the declining cost-to-performance ratio of VR hardware, are expected to fuel this trajectory. While the initial investment in VR infrastructure can be substantial, the long-term returns in terms of cost savings, design optimization, and market responsiveness are proving to be compelling for OEMs and Tier 1 suppliers alike. The forward-looking outlook indicates sustained innovation in the Virtual Reality In Automotive Market, particularly in areas of cloud-based VR platforms and the integration of AI-driven analytics to further refine design iterations and predictive maintenance applications. The continued evolution of the Automotive Software Market will be pivotal in shaping these advancements.
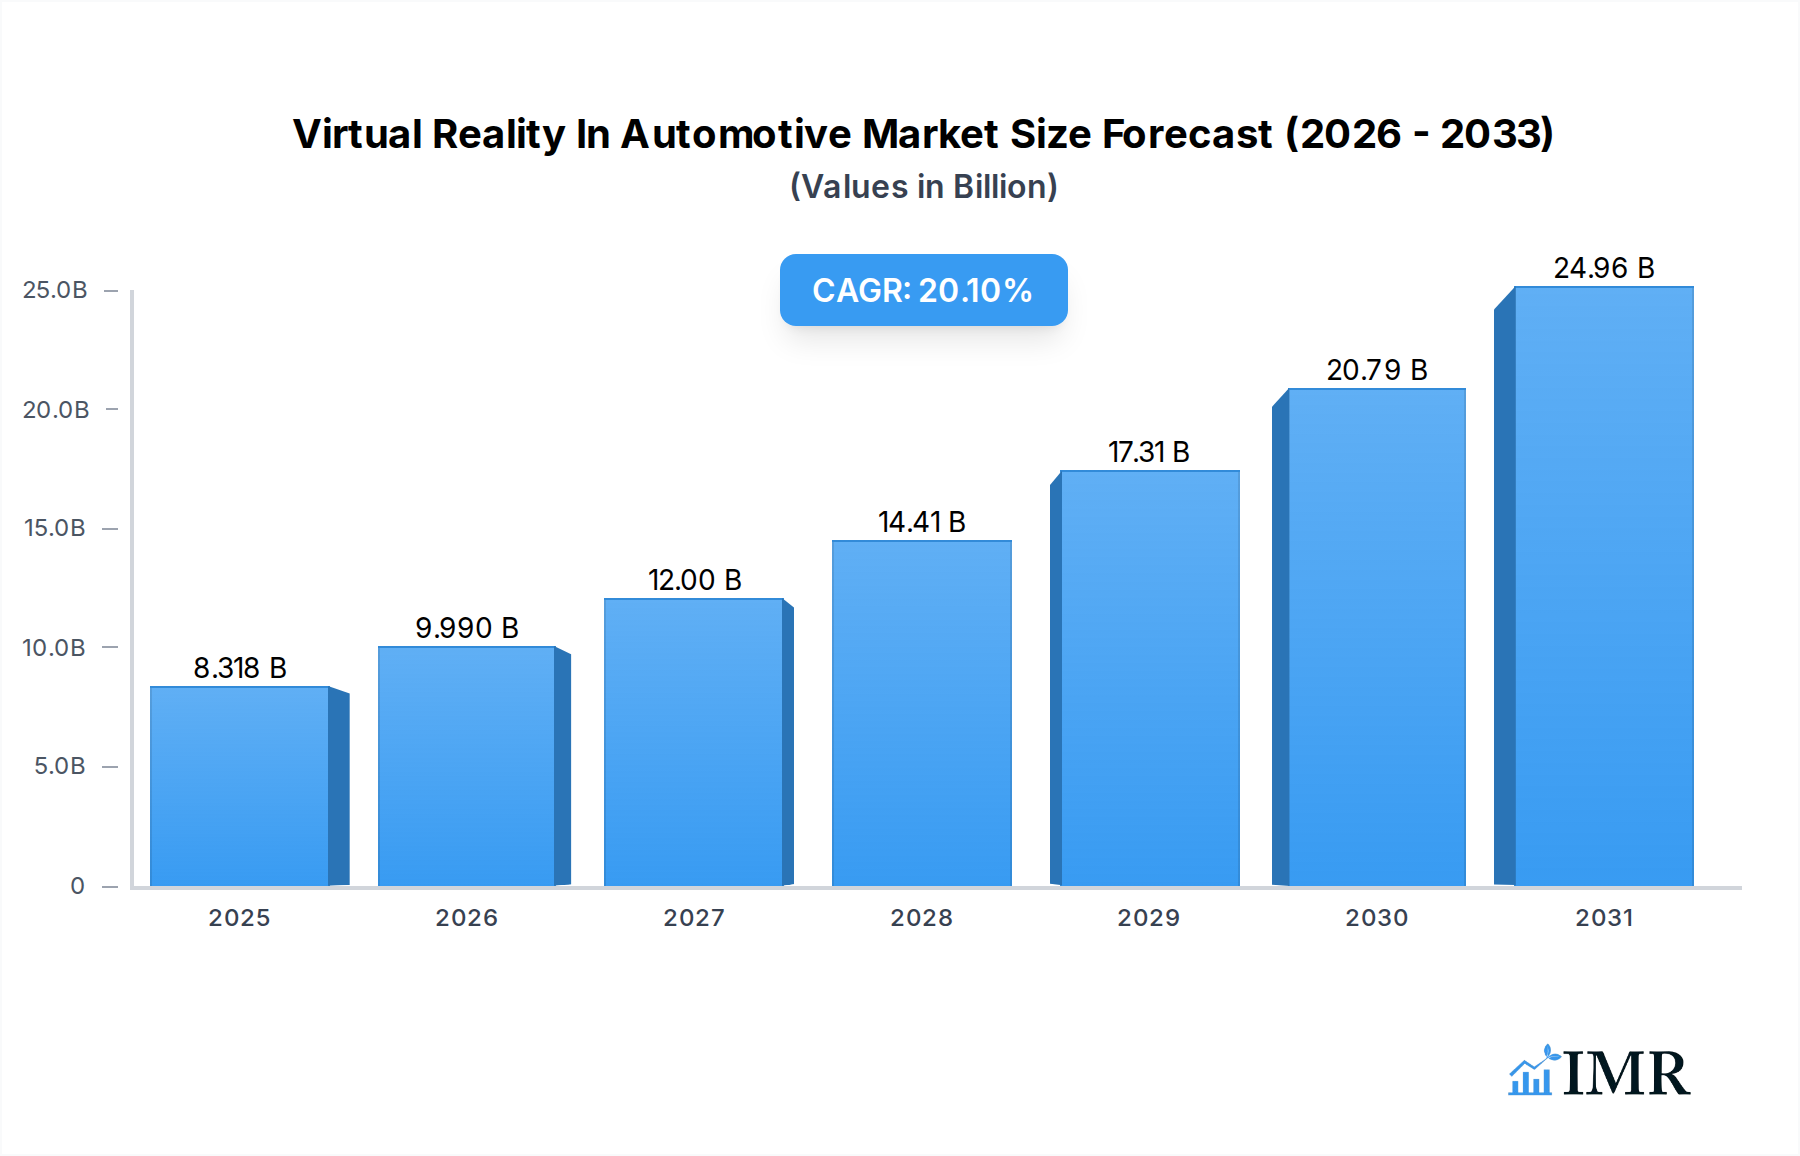
Virtual Reality In Automotive Market Size (In Billion)

Offering: Software Segment Dominance in Virtual Reality In Automotive Market
The 'Software' segment, under the 'Offering' category, currently holds the dominant revenue share within the Virtual Reality In Automotive Market and is projected to maintain its lead throughout the forecast period. This preeminence stems from several critical factors. VR hardware, while essential, represents a one-time capital expenditure; software, conversely, encompasses recurring licenses, continuous updates, custom development, and integration services, generating sustained revenue streams. The complexity of automotive design, engineering, and manufacturing workflows necessitates highly specialized software solutions that can accurately render CAD models, simulate physical properties, and facilitate collaborative design reviews. Companies like Unity Technologies and Autodesk provide foundational platforms that are extensively customized and integrated into OEM pipelines for sophisticated Automotive Design Market and Automotive Simulation Market applications. This software enables real-time interaction with digital mock-ups, allowing engineers and designers to identify flaws, test ergonomics, and iterate rapidly without the need for expensive physical prototypes, thereby directly addressing the core needs of the Automotive Prototyping Market. Furthermore, the 'Software' segment extends beyond core design to encompass VR-based training modules for assembly line workers, virtual sales configurators for dealerships, and immersive testing environments for autonomous driving systems. The value proposition of VR software lies not just in visualization but in its capability to process, analyze, and present complex data in an intuitive, immersive format, significantly enhancing decision-making. The segment's dominance is further solidified by the continuous innovation in rendering algorithms, physics engines, and collaborative tools that make VR experiences more realistic and productive. As the industry moves towards the adoption of the Industrial Metaverse Market concepts, the demand for robust, scalable, and interconnected VR software platforms will only intensify, solidifying this segment's leading position.
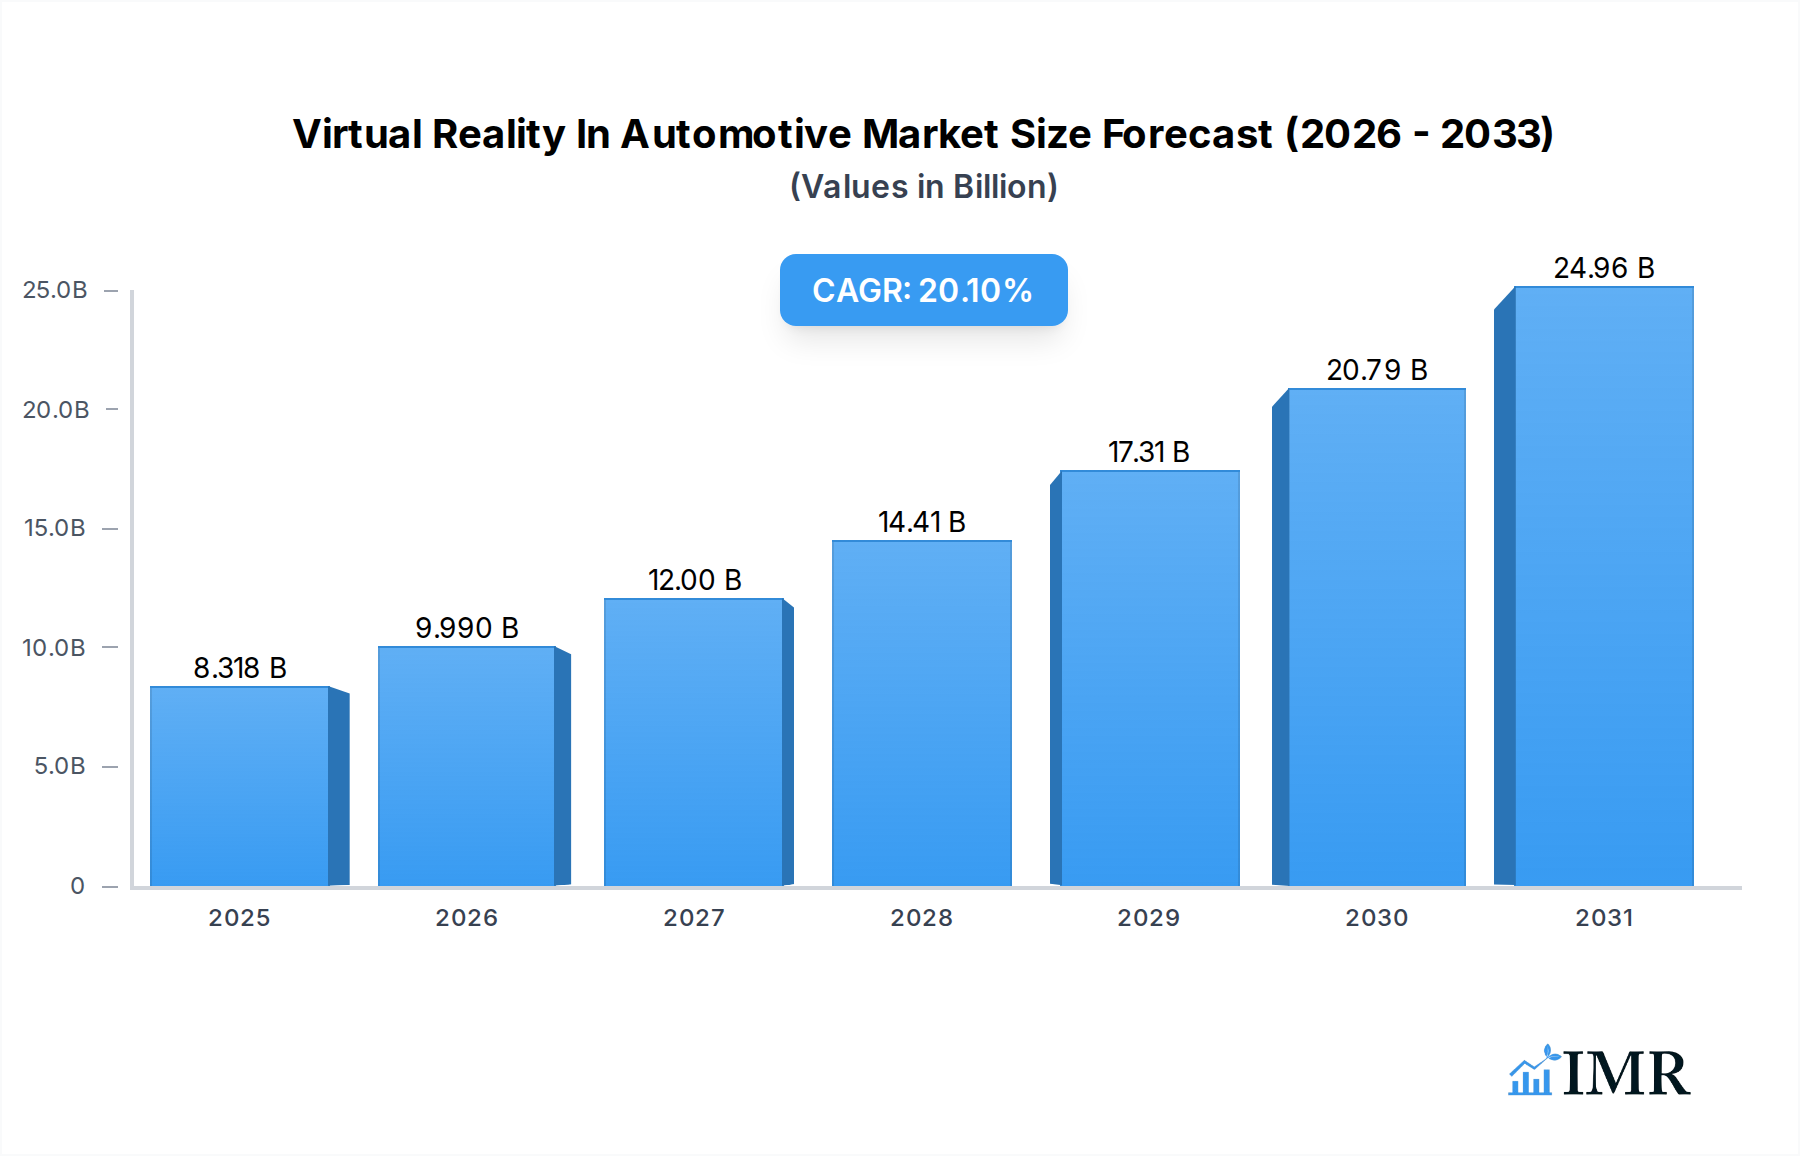
Virtual Reality In Automotive Company Market Share
Key Market Drivers in Virtual Reality In Automotive Market
The expansion of the Virtual Reality In Automotive Market is primarily propelled by several data-centric drivers:
- Accelerated Product Development Cycles: The automotive industry faces intense pressure to reduce time-to-market for new models, with development cycles typically ranging from 3-5 years. VR technology significantly compresses the design and prototyping phases by allowing simultaneous engineering, reducing the need for multiple physical prototypes. Studies indicate VR integration can cut physical prototyping stages by 30% to 50%, translating directly into faster product launches and substantial cost savings for OEMs.
- Enhanced Design & Prototyping Efficiency: VR facilitates highly iterative design reviews and engineering simulations. Designers can explore multiple iterations of a vehicle's interior and exterior in real-time, making changes on the fly within a virtual environment. This process can reduce the material and labor costs associated with physical mock-ups by an estimated $50,000 to $100,000 per design iteration for complex components, showcasing a tangible return on investment.
- Growing Demand for Immersive Customer Experiences: Virtual reality is transforming vehicle marketing and sales. OEMs are deploying VR configurators in showrooms and online platforms, allowing prospective buyers to customize vehicles and experience them in diverse virtual scenarios. Dealerships utilizing advanced VR solutions have reported up to 15-25% higher conversion rates for new vehicle sales, demonstrating the technology's direct impact on revenue generation and customer engagement. This is critical in the increasingly competitive Connected Car Market.
- Complexity of Modern Vehicle Systems: Modern vehicles integrate highly sophisticated Advanced Driver-Assistance Systems (ADAS), infotainment systems, and electric powertrains. Designing and testing these complex systems requires advanced visualization and simulation capabilities. VR provides an ideal platform for engineers to interact with digital representations of these systems, identify integration issues early, and refine HMI designs. This approach can reduce post-production modifications by 10-15%, mitigating costly recalls and rework.
Competitive Ecosystem of Virtual Reality In Automotive Market
The competitive landscape of the Virtual Reality In Automotive Market is characterized by a blend of dedicated VR/XR technology providers, established automotive software developers, and major automotive OEMs integrating VR capabilities in-house.
- Vection Technologies Ltd.**: This company provides integrated XR solutions for various industries, including automotive, focusing on creating collaborative design and training platforms that enhance operational efficiency.
- Wear Studio**: Specializes in crafting bespoke immersive experiences and visualization tools, offering tailored VR applications that cater to specific automotive design, marketing, and training requirements.
- Unity Technologies**: A foundational player, offering a powerful real-time 3D development platform widely adopted across the automotive sector for creating interactive design reviews, simulations, and virtual showrooms.
- XR Labs: Focuses on developing enterprise-grade extended reality solutions, providing custom VR applications for industrial clients, particularly in automotive manufacturing, quality inspection, and employee training.
- NVIDIA: A critical enabler in the VR ecosystem, supplying high-performance GPUs and software SDKs that are essential for rendering complex virtual automotive environments and powering advanced simulation tools.
- Bosch GmbH**: A global technology and service provider, Bosch leverages VR for internal training, production planning, and developing new automotive components, demonstrating its commitment to digital innovation.
- Meta Platforms, Inc.: While known for consumer VR, Meta's underlying Quest hardware and software platforms influence broader VR technology adoption, including potential future applications in automotive user experiences.
- Tecknotrove: Delivers a range of simulation and training products, including advanced VR-based driving simulators and technical maintenance training solutions specifically for the automotive industry.
- Volkswagen AG: This major OEM is a significant end-user and internal developer of VR applications, extensively integrating VR into its global design, engineering, and manufacturing processes to streamline operations and foster innovation.
- BMW M GmbH: Actively utilizes VR for high-performance vehicle design, driver dynamics simulation, and advanced engineering, pushing the boundaries of immersive development for premium automotive experiences.
- WayRay AG: Specializes in holographic Augmented Reality Market displays for vehicles, an adjacent technology that enhances the driving experience by projecting virtual information onto the real-world view.
- Autodesk: A leading provider of 3D design, engineering, and entertainment software, Autodesk's tools are crucial for automotive CAD and integrate seamlessly with VR workflows for visualization and prototyping.
Recent Developments & Milestones in Virtual Reality In Automotive Market
The Virtual Reality In Automotive Market has seen a series of strategic advancements and collaborations underscoring its pivotal role in the industry's digital transformation:
- January 2024: Volkswagen AG announced an expanded partnership with NVIDIA, aiming to further integrate advanced VR technologies into its global design and prototyping workflows. This collaboration focuses on leveraging NVIDIA's Omniverse platform to create a more cohesive and efficient Virtual Reality In Automotive Market development pipeline.
- November 2023: Unity Technologies released a significant update to its industry-specific SDKs, including new features tailored for the automotive sector. These enhancements improve real-time rendering capabilities, enable more robust multi-user collaborative VR design reviews, and streamline the creation of virtual configurators for OEMs.
- August 2023: BMW M GmbH unveiled a new state-of-the-art VR driving simulator facility, designed to accelerate the testing and refinement of vehicle dynamics, HMI systems, and advanced driver assistance features. This investment highlights the growing importance of immersive simulation in high-performance vehicle development within the Virtual Reality In Automotive Market.
- April 2023: XR Labs secured a substantial Series A funding round to expand its enterprise VR solutions, particularly focusing on industrial applications within automotive manufacturing and assembly training. The funding aims to enhance their platform's ability to create realistic training environments and digital work instructions, addressing critical skills gaps in the Industrial Metaverse Market.
- February 2023: A leading Tier 1 supplier partnered with Vection Technologies Ltd. to implement a new VR-based platform for supply chain visualization and collaborative design review of component integration, aiming to reduce lead times and improve overall quality control.
Regional Market Breakdown for Virtual Reality In Automotive Market
The Virtual Reality In Automotive Market exhibits distinct regional dynamics, influenced by varying levels of automotive production, technological adoption, and investment in R&D.
- North America: This region commands a significant revenue share, primarily driven by the strong presence of major automotive OEMs and a highly innovative technology ecosystem. The United States, in particular, leads in the adoption of VR for cutting-edge Automotive Design Market, engineering simulation, and advanced driver training. Investment in startups specializing in Digital Twin Market solutions for automotive applications is also prevalent here. The projected CAGR for North America is approximately 19.5%, reflecting sustained R&D expenditure and the rapid integration of VR in electric vehicle (EV) development.
- Europe: A mature automotive market, Europe holds a substantial share, fueled by stringent regulatory standards for vehicle safety and emissions, which necessitate advanced simulation and prototyping. Germany, with its robust automotive manufacturing base, and the UK, with its strong design heritage, are key contributors. European OEMs are investing heavily in VR for manufacturing planning, quality control, and the deployment of advanced Automotive Software Market for collaborative design. The region is expected to grow at a CAGR of around 20.0%, driven by initiatives promoting Industry 4.0 and digital transformation.
- Asia Pacific: This region is identified as the fastest-growing market for Virtual Reality In Automotive Market, projected with a CAGR exceeding 22.0%. This rapid expansion is propelled by burgeoning automotive production in China, India, and Japan, coupled with government support for digital manufacturing and smart factory initiatives. High demand for efficient Automotive Prototyping Market solutions and immersive customer experience centers is boosting VR adoption. Furthermore, the increasing disposable income and willingness to embrace new technologies in countries like South Korea contribute significantly to market expansion.
- Middle East & Africa: While smaller in absolute value, this region is witnessing gradual adoption of VR, primarily driven by automotive assembly operations and nascent R&D centers in the GCC countries. The focus is on leveraging VR for employee training, maintenance, and basic visualization, with a projected moderate growth trajectory as digital infrastructure improves.
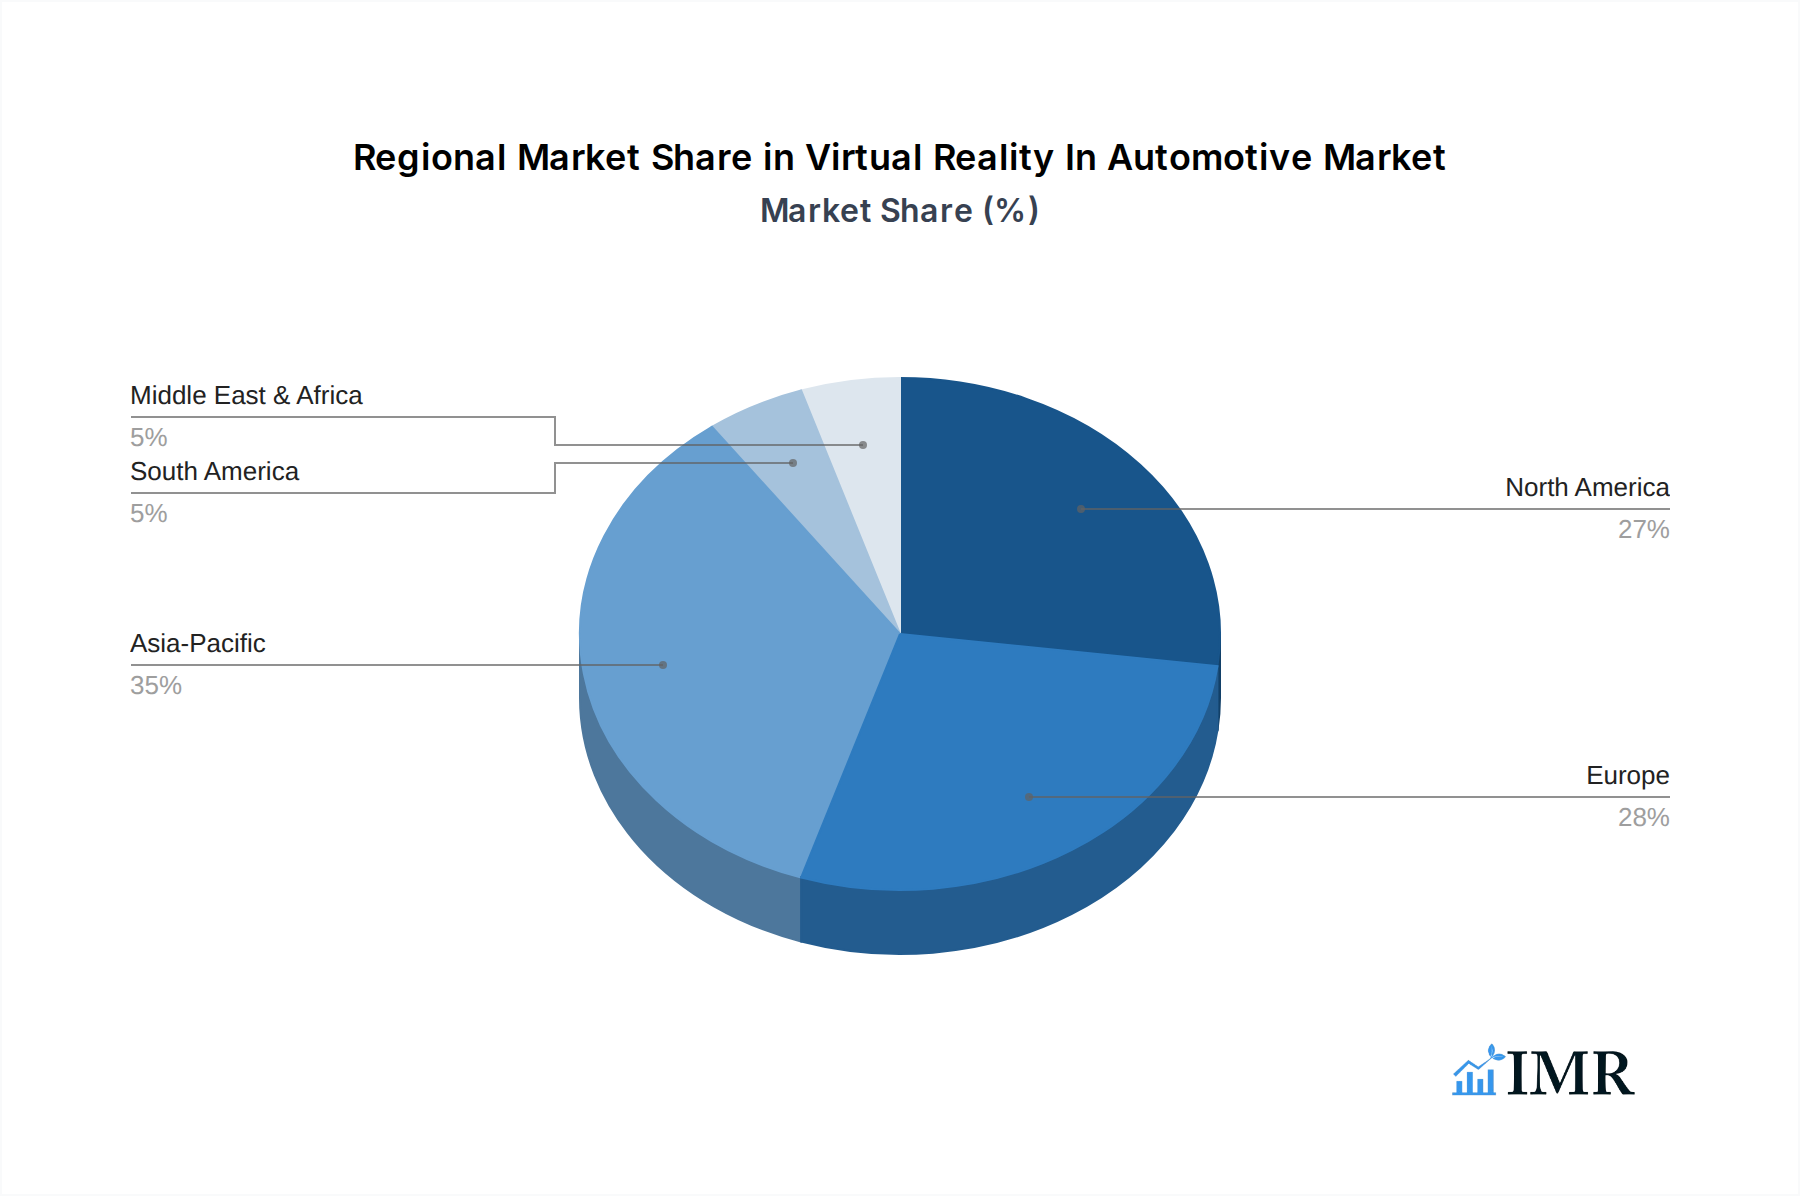
Virtual Reality In Automotive Regional Market Share
Investment & Funding Activity in Virtual Reality In Automotive Market
Investment and funding activity within the Virtual Reality In Automotive Market has been robust over the past two to three years, reflecting the industry's strategic shift towards digital transformation. Venture capital firms and corporate venture arms of major OEMs have shown keen interest in startups developing specialized VR software and hardware components. Significant capital has been directed towards companies offering advanced Automotive Simulation Market platforms, particularly those integrating AI and machine learning for predictive modeling and design optimization. For instance, several Series B and C funding rounds have closed for firms specializing in multi-user VR collaboration tools, facilitating remote design reviews across global teams. Mergers and acquisitions have also played a role, with larger tech companies acquiring niche VR solution providers to bolster their offerings in industrial XR. Notably, companies focusing on the Digital Twin Market within automotive applications have attracted substantial funding, as these technologies promise end-to-end lifecycle management from design to maintenance. Furthermore, investments are flowing into haptic feedback systems, contributing to the growth of the Haptics Technology Market, aimed at enhancing the realism and immersion of virtual prototyping and training. Strategic partnerships between VR platform developers and automotive component manufacturers are also common, pooling resources to create integrated solutions. This sustained investment indicates a strong belief in VR's long-term value proposition for enhancing efficiency, reducing costs, and accelerating innovation in the automotive sector.
Regulatory & Policy Landscape Shaping Virtual Reality In Automotive Market
The regulatory and policy landscape for the Virtual Reality In Automotive Market is evolving, with key geographies beginning to address concerns related to data privacy, interoperability, and safety. While no overarching global VR-specific automotive regulation exists, several frameworks indirectly influence market development.
In Europe, the General Data Protection Regulation (GDPR) impacts how personal data, potentially gathered through VR user interactions or biometrics during training simulations, is collected, processed, and stored. Automotive companies deploying VR solutions must ensure compliance, especially when customer data is involved in virtual configurators or personalized experiences. The forthcoming AI Act in the EU could also bear relevance, particularly for AI-driven VR simulation platforms used in autonomous vehicle development, requiring transparency and risk assessment.
North America, particularly the United States, sees a fragmented approach. The National Highway Traffic Safety Administration (NHTSA) primarily focuses on vehicle safety, but as in-car VR experiences and Connected Car Market features proliferate, safety guidelines for driver distraction and passenger entertainment will likely emerge. Standards bodies like ISO are crucial, with ISO 26262 for functional safety of automotive electrical/electronic systems influencing the development of VR tools used in safety-critical engineering processes. There's also a growing emphasis on cybersecurity standards (e.g., ISO/SAE 21434) to protect VR platforms integrated into vehicle development networks from cyber threats.
In Asia Pacific, countries like China and Japan are actively promoting standards for VR/AR hardware and software, often driven by industrial application needs. Government initiatives supporting smart manufacturing and Industrial Metaverse Market concepts indirectly encourage the development and adoption of interoperable VR solutions. For instance, policies promoting digital transformation in manufacturing often include grants for companies adopting advanced visualization and simulation technologies. A key trend across all regions is the push for interoperability standards to ensure seamless integration of VR hardware and Automotive Software Market from different vendors, reducing fragmentation and fostering broader adoption. Lack of universal standards for VR content creation and platform compatibility currently poses a minor challenge, prompting industry alliances to work towards common protocols.
Virtual Reality In Automotive Segmentation
-
1. Offering
- 1.1. Hardware
- 1.2. Software
- 1.3. Service
-
2. Vehicle Type
- 2.1. Passenger Vehicles
- 2.2. Light Commercial Vehicles
- 2.3. Heavy Commercial Vehicles
-
3. Application
- 3.1. Design & Styling
- 3.2. Engineering & Simulation
- 3.3. Prototyping & Digital Mock-ups
- 3.4. Advanced Visualization
- 3.5. Manufacturing & Assembly Planning
- 3.6. Others
-
4. End User
- 4.1. OEMs
- 4.2. Tier 1 & Tier 2 Suppliers
- 4.3. Aftermarket & Service Providers
- 4.4. Research & Development Centers
- 4.5. Others
Virtual Reality In Automotive Segmentation By Geography
-
1. North America
- 1.1. United States
- 1.2. Canada
- 1.3. Mexico
-
2. South America
- 2.1. Brazil
- 2.2. Argentina
- 2.3. Rest of South America
-
3. Europe
- 3.1. United Kingdom
- 3.2. Germany
- 3.3. France
- 3.4. Italy
- 3.5. Spain
- 3.6. Russia
- 3.7. Benelux
- 3.8. Nordics
- 3.9. Rest of Europe
-
4. Middle East & Africa
- 4.1. Turkey
- 4.2. Israel
- 4.3. GCC
- 4.4. North Africa
- 4.5. South Africa
- 4.6. Rest of Middle East & Africa
-
5. Asia Pacific
- 5.1. China
- 5.2. India
- 5.3. Japan
- 5.4. South Korea
- 5.5. ASEAN
- 5.6. Oceania
- 5.7. Rest of Asia Pacific
Virtual Reality In Automotive Regional Market Share
Geographic Coverage of Virtual Reality In Automotive
Virtual Reality In Automotive REPORT HIGHLIGHTS
| Aspects | Details |
|---|---|
| Study Period | 2020-2034 |
| Base Year | 2025 |
| Estimated Year | 2026 |
| Forecast Period | 2026-2034 |
| Historical Period | 2020-2025 |
| Growth Rate | CAGR of 20.1% from 2020-2034 |
| Segmentation |
|
Table of Contents
- 1. Introduction
- 1.1. Research Scope
- 1.2. Market Segmentation
- 1.3. Research Objective
- 1.4. Definitions and Assumptions
- 2. Executive Summary
- 2.1. Market Snapshot
- 3. Market Dynamics
- 3.1. Market Drivers
- 3.2. Market Restrains
- 3.3. Market Trends
- 3.4. Market Opportunities
- 4. Market Factor Analysis
- 4.1. Porters Five Forces
- 4.1.1. Bargaining Power of Suppliers
- 4.1.2. Bargaining Power of Buyers
- 4.1.3. Threat of New Entrants
- 4.1.4. Threat of Substitutes
- 4.1.5. Competitive Rivalry
- 4.2. PESTEL analysis
- 4.3. BCG Analysis
- 4.3.1. Stars (High Growth, High Market Share)
- 4.3.2. Cash Cows (Low Growth, High Market Share)
- 4.3.3. Question Mark (High Growth, Low Market Share)
- 4.3.4. Dogs (Low Growth, Low Market Share)
- 4.4. Ansoff Matrix Analysis
- 4.5. Supply Chain Analysis
- 4.6. Regulatory Landscape
- 4.7. Current Market Potential and Opportunity Assessment (TAM–SAM–SOM Framework)
- 4.8. IMR Analyst Note
- 4.1. Porters Five Forces
- 5. Market Analysis, Insights and Forecast 2021-2033
- 5.1. Market Analysis, Insights and Forecast - by Offering
- 5.1.1. Hardware
- 5.1.2. Software
- 5.1.3. Service
- 5.2. Market Analysis, Insights and Forecast - by Vehicle Type
- 5.2.1. Passenger Vehicles
- 5.2.2. Light Commercial Vehicles
- 5.2.3. Heavy Commercial Vehicles
- 5.3. Market Analysis, Insights and Forecast - by Application
- 5.3.1. Design & Styling
- 5.3.2. Engineering & Simulation
- 5.3.3. Prototyping & Digital Mock-ups
- 5.3.4. Advanced Visualization
- 5.3.5. Manufacturing & Assembly Planning
- 5.3.6. Others
- 5.4. Market Analysis, Insights and Forecast - by End User
- 5.4.1. OEMs
- 5.4.2. Tier 1 & Tier 2 Suppliers
- 5.4.3. Aftermarket & Service Providers
- 5.4.4. Research & Development Centers
- 5.4.5. Others
- 5.5. Market Analysis, Insights and Forecast - by Region
- 5.5.1. North America
- 5.5.2. South America
- 5.5.3. Europe
- 5.5.4. Middle East & Africa
- 5.5.5. Asia Pacific
- 5.1. Market Analysis, Insights and Forecast - by Offering
- 6. Global Virtual Reality In Automotive Analysis, Insights and Forecast, 2021-2033
- 6.1. Market Analysis, Insights and Forecast - by Offering
- 6.1.1. Hardware
- 6.1.2. Software
- 6.1.3. Service
- 6.2. Market Analysis, Insights and Forecast - by Vehicle Type
- 6.2.1. Passenger Vehicles
- 6.2.2. Light Commercial Vehicles
- 6.2.3. Heavy Commercial Vehicles
- 6.3. Market Analysis, Insights and Forecast - by Application
- 6.3.1. Design & Styling
- 6.3.2. Engineering & Simulation
- 6.3.3. Prototyping & Digital Mock-ups
- 6.3.4. Advanced Visualization
- 6.3.5. Manufacturing & Assembly Planning
- 6.3.6. Others
- 6.4. Market Analysis, Insights and Forecast - by End User
- 6.4.1. OEMs
- 6.4.2. Tier 1 & Tier 2 Suppliers
- 6.4.3. Aftermarket & Service Providers
- 6.4.4. Research & Development Centers
- 6.4.5. Others
- 6.1. Market Analysis, Insights and Forecast - by Offering
- 7. North America Virtual Reality In Automotive Analysis, Insights and Forecast, 2020-2032
- 7.1. Market Analysis, Insights and Forecast - by Offering
- 7.1.1. Hardware
- 7.1.2. Software
- 7.1.3. Service
- 7.2. Market Analysis, Insights and Forecast - by Vehicle Type
- 7.2.1. Passenger Vehicles
- 7.2.2. Light Commercial Vehicles
- 7.2.3. Heavy Commercial Vehicles
- 7.3. Market Analysis, Insights and Forecast - by Application
- 7.3.1. Design & Styling
- 7.3.2. Engineering & Simulation
- 7.3.3. Prototyping & Digital Mock-ups
- 7.3.4. Advanced Visualization
- 7.3.5. Manufacturing & Assembly Planning
- 7.3.6. Others
- 7.4. Market Analysis, Insights and Forecast - by End User
- 7.4.1. OEMs
- 7.4.2. Tier 1 & Tier 2 Suppliers
- 7.4.3. Aftermarket & Service Providers
- 7.4.4. Research & Development Centers
- 7.4.5. Others
- 7.1. Market Analysis, Insights and Forecast - by Offering
- 8. South America Virtual Reality In Automotive Analysis, Insights and Forecast, 2020-2032
- 8.1. Market Analysis, Insights and Forecast - by Offering
- 8.1.1. Hardware
- 8.1.2. Software
- 8.1.3. Service
- 8.2. Market Analysis, Insights and Forecast - by Vehicle Type
- 8.2.1. Passenger Vehicles
- 8.2.2. Light Commercial Vehicles
- 8.2.3. Heavy Commercial Vehicles
- 8.3. Market Analysis, Insights and Forecast - by Application
- 8.3.1. Design & Styling
- 8.3.2. Engineering & Simulation
- 8.3.3. Prototyping & Digital Mock-ups
- 8.3.4. Advanced Visualization
- 8.3.5. Manufacturing & Assembly Planning
- 8.3.6. Others
- 8.4. Market Analysis, Insights and Forecast - by End User
- 8.4.1. OEMs
- 8.4.2. Tier 1 & Tier 2 Suppliers
- 8.4.3. Aftermarket & Service Providers
- 8.4.4. Research & Development Centers
- 8.4.5. Others
- 8.1. Market Analysis, Insights and Forecast - by Offering
- 9. Europe Virtual Reality In Automotive Analysis, Insights and Forecast, 2020-2032
- 9.1. Market Analysis, Insights and Forecast - by Offering
- 9.1.1. Hardware
- 9.1.2. Software
- 9.1.3. Service
- 9.2. Market Analysis, Insights and Forecast - by Vehicle Type
- 9.2.1. Passenger Vehicles
- 9.2.2. Light Commercial Vehicles
- 9.2.3. Heavy Commercial Vehicles
- 9.3. Market Analysis, Insights and Forecast - by Application
- 9.3.1. Design & Styling
- 9.3.2. Engineering & Simulation
- 9.3.3. Prototyping & Digital Mock-ups
- 9.3.4. Advanced Visualization
- 9.3.5. Manufacturing & Assembly Planning
- 9.3.6. Others
- 9.4. Market Analysis, Insights and Forecast - by End User
- 9.4.1. OEMs
- 9.4.2. Tier 1 & Tier 2 Suppliers
- 9.4.3. Aftermarket & Service Providers
- 9.4.4. Research & Development Centers
- 9.4.5. Others
- 9.1. Market Analysis, Insights and Forecast - by Offering
- 10. Middle East & Africa Virtual Reality In Automotive Analysis, Insights and Forecast, 2020-2032
- 10.1. Market Analysis, Insights and Forecast - by Offering
- 10.1.1. Hardware
- 10.1.2. Software
- 10.1.3. Service
- 10.2. Market Analysis, Insights and Forecast - by Vehicle Type
- 10.2.1. Passenger Vehicles
- 10.2.2. Light Commercial Vehicles
- 10.2.3. Heavy Commercial Vehicles
- 10.3. Market Analysis, Insights and Forecast - by Application
- 10.3.1. Design & Styling
- 10.3.2. Engineering & Simulation
- 10.3.3. Prototyping & Digital Mock-ups
- 10.3.4. Advanced Visualization
- 10.3.5. Manufacturing & Assembly Planning
- 10.3.6. Others
- 10.4. Market Analysis, Insights and Forecast - by End User
- 10.4.1. OEMs
- 10.4.2. Tier 1 & Tier 2 Suppliers
- 10.4.3. Aftermarket & Service Providers
- 10.4.4. Research & Development Centers
- 10.4.5. Others
- 10.1. Market Analysis, Insights and Forecast - by Offering
- 11. Asia Pacific Virtual Reality In Automotive Analysis, Insights and Forecast, 2020-2032
- 11.1. Market Analysis, Insights and Forecast - by Offering
- 11.1.1. Hardware
- 11.1.2. Software
- 11.1.3. Service
- 11.2. Market Analysis, Insights and Forecast - by Vehicle Type
- 11.2.1. Passenger Vehicles
- 11.2.2. Light Commercial Vehicles
- 11.2.3. Heavy Commercial Vehicles
- 11.3. Market Analysis, Insights and Forecast - by Application
- 11.3.1. Design & Styling
- 11.3.2. Engineering & Simulation
- 11.3.3. Prototyping & Digital Mock-ups
- 11.3.4. Advanced Visualization
- 11.3.5. Manufacturing & Assembly Planning
- 11.3.6. Others
- 11.4. Market Analysis, Insights and Forecast - by End User
- 11.4.1. OEMs
- 11.4.2. Tier 1 & Tier 2 Suppliers
- 11.4.3. Aftermarket & Service Providers
- 11.4.4. Research & Development Centers
- 11.4.5. Others
- 11.1. Market Analysis, Insights and Forecast - by Offering
- 12. Competitive Analysis
- 12.1. Company Profiles
- 12.1.1 Vection Technologies Ltd.
- 12.1.1.1. Company Overview
- 12.1.1.2. Products
- 12.1.1.3. Company Financials
- 12.1.1.4. SWOT Analysis
- 12.1.2 Wear Studio
- 12.1.2.1. Company Overview
- 12.1.2.2. Products
- 12.1.2.3. Company Financials
- 12.1.2.4. SWOT Analysis
- 12.1.3 Unity Technologies
- 12.1.3.1. Company Overview
- 12.1.3.2. Products
- 12.1.3.3. Company Financials
- 12.1.3.4. SWOT Analysis
- 12.1.4 XR Labs
- 12.1.4.1. Company Overview
- 12.1.4.2. Products
- 12.1.4.3. Company Financials
- 12.1.4.4. SWOT Analysis
- 12.1.5 NVIDIA
- 12.1.5.1. Company Overview
- 12.1.5.2. Products
- 12.1.5.3. Company Financials
- 12.1.5.4. SWOT Analysis
- 12.1.6 Bosch GmbH
- 12.1.6.1. Company Overview
- 12.1.6.2. Products
- 12.1.6.3. Company Financials
- 12.1.6.4. SWOT Analysis
- 12.1.7 Meta Platforms Inc.
- 12.1.7.1. Company Overview
- 12.1.7.2. Products
- 12.1.7.3. Company Financials
- 12.1.7.4. SWOT Analysis
- 12.1.8 Tecknotrove
- 12.1.8.1. Company Overview
- 12.1.8.2. Products
- 12.1.8.3. Company Financials
- 12.1.8.4. SWOT Analysis
- 12.1.9 Volkswagen AG
- 12.1.9.1. Company Overview
- 12.1.9.2. Products
- 12.1.9.3. Company Financials
- 12.1.9.4. SWOT Analysis
- 12.1.10 BMW M GmbH
- 12.1.10.1. Company Overview
- 12.1.10.2. Products
- 12.1.10.3. Company Financials
- 12.1.10.4. SWOT Analysis
- 12.1.11 WayRay AG
- 12.1.11.1. Company Overview
- 12.1.11.2. Products
- 12.1.11.3. Company Financials
- 12.1.11.4. SWOT Analysis
- 12.1.12 Autodesk
- 12.1.12.1. Company Overview
- 12.1.12.2. Products
- 12.1.12.3. Company Financials
- 12.1.12.4. SWOT Analysis
- 12.1.13 Others
- 12.1.13.1. Company Overview
- 12.1.13.2. Products
- 12.1.13.3. Company Financials
- 12.1.13.4. SWOT Analysis
- 12.1.1 Vection Technologies Ltd.
- 12.2. Market Entropy
- 12.2.1 Company's Key Areas Served
- 12.2.2 Recent Developments
- 12.3. Company Market Share Analysis 2025
- 12.3.1 Top 5 Companies Market Share Analysis
- 12.3.2 Top 3 Companies Market Share Analysis
- 12.4. List of Potential Customers
- 13. Research Methodology
List of Figures
- Figure 1: Global Virtual Reality In Automotive Revenue Breakdown (million, %) by Region 2025 & 2033
- Figure 2: North America Virtual Reality In Automotive Revenue (million), by Offering 2025 & 2033
- Figure 3: North America Virtual Reality In Automotive Revenue Share (%), by Offering 2025 & 2033
- Figure 4: North America Virtual Reality In Automotive Revenue (million), by Vehicle Type 2025 & 2033
- Figure 5: North America Virtual Reality In Automotive Revenue Share (%), by Vehicle Type 2025 & 2033
- Figure 6: North America Virtual Reality In Automotive Revenue (million), by Application 2025 & 2033
- Figure 7: North America Virtual Reality In Automotive Revenue Share (%), by Application 2025 & 2033
- Figure 8: North America Virtual Reality In Automotive Revenue (million), by End User 2025 & 2033
- Figure 9: North America Virtual Reality In Automotive Revenue Share (%), by End User 2025 & 2033
- Figure 10: North America Virtual Reality In Automotive Revenue (million), by Country 2025 & 2033
- Figure 11: North America Virtual Reality In Automotive Revenue Share (%), by Country 2025 & 2033
- Figure 12: South America Virtual Reality In Automotive Revenue (million), by Offering 2025 & 2033
- Figure 13: South America Virtual Reality In Automotive Revenue Share (%), by Offering 2025 & 2033
- Figure 14: South America Virtual Reality In Automotive Revenue (million), by Vehicle Type 2025 & 2033
- Figure 15: South America Virtual Reality In Automotive Revenue Share (%), by Vehicle Type 2025 & 2033
- Figure 16: South America Virtual Reality In Automotive Revenue (million), by Application 2025 & 2033
- Figure 17: South America Virtual Reality In Automotive Revenue Share (%), by Application 2025 & 2033
- Figure 18: South America Virtual Reality In Automotive Revenue (million), by End User 2025 & 2033
- Figure 19: South America Virtual Reality In Automotive Revenue Share (%), by End User 2025 & 2033
- Figure 20: South America Virtual Reality In Automotive Revenue (million), by Country 2025 & 2033
- Figure 21: South America Virtual Reality In Automotive Revenue Share (%), by Country 2025 & 2033
- Figure 22: Europe Virtual Reality In Automotive Revenue (million), by Offering 2025 & 2033
- Figure 23: Europe Virtual Reality In Automotive Revenue Share (%), by Offering 2025 & 2033
- Figure 24: Europe Virtual Reality In Automotive Revenue (million), by Vehicle Type 2025 & 2033
- Figure 25: Europe Virtual Reality In Automotive Revenue Share (%), by Vehicle Type 2025 & 2033
- Figure 26: Europe Virtual Reality In Automotive Revenue (million), by Application 2025 & 2033
- Figure 27: Europe Virtual Reality In Automotive Revenue Share (%), by Application 2025 & 2033
- Figure 28: Europe Virtual Reality In Automotive Revenue (million), by End User 2025 & 2033
- Figure 29: Europe Virtual Reality In Automotive Revenue Share (%), by End User 2025 & 2033
- Figure 30: Europe Virtual Reality In Automotive Revenue (million), by Country 2025 & 2033
- Figure 31: Europe Virtual Reality In Automotive Revenue Share (%), by Country 2025 & 2033
- Figure 32: Middle East & Africa Virtual Reality In Automotive Revenue (million), by Offering 2025 & 2033
- Figure 33: Middle East & Africa Virtual Reality In Automotive Revenue Share (%), by Offering 2025 & 2033
- Figure 34: Middle East & Africa Virtual Reality In Automotive Revenue (million), by Vehicle Type 2025 & 2033
- Figure 35: Middle East & Africa Virtual Reality In Automotive Revenue Share (%), by Vehicle Type 2025 & 2033
- Figure 36: Middle East & Africa Virtual Reality In Automotive Revenue (million), by Application 2025 & 2033
- Figure 37: Middle East & Africa Virtual Reality In Automotive Revenue Share (%), by Application 2025 & 2033
- Figure 38: Middle East & Africa Virtual Reality In Automotive Revenue (million), by End User 2025 & 2033
- Figure 39: Middle East & Africa Virtual Reality In Automotive Revenue Share (%), by End User 2025 & 2033
- Figure 40: Middle East & Africa Virtual Reality In Automotive Revenue (million), by Country 2025 & 2033
- Figure 41: Middle East & Africa Virtual Reality In Automotive Revenue Share (%), by Country 2025 & 2033
- Figure 42: Asia Pacific Virtual Reality In Automotive Revenue (million), by Offering 2025 & 2033
- Figure 43: Asia Pacific Virtual Reality In Automotive Revenue Share (%), by Offering 2025 & 2033
- Figure 44: Asia Pacific Virtual Reality In Automotive Revenue (million), by Vehicle Type 2025 & 2033
- Figure 45: Asia Pacific Virtual Reality In Automotive Revenue Share (%), by Vehicle Type 2025 & 2033
- Figure 46: Asia Pacific Virtual Reality In Automotive Revenue (million), by Application 2025 & 2033
- Figure 47: Asia Pacific Virtual Reality In Automotive Revenue Share (%), by Application 2025 & 2033
- Figure 48: Asia Pacific Virtual Reality In Automotive Revenue (million), by End User 2025 & 2033
- Figure 49: Asia Pacific Virtual Reality In Automotive Revenue Share (%), by End User 2025 & 2033
- Figure 50: Asia Pacific Virtual Reality In Automotive Revenue (million), by Country 2025 & 2033
- Figure 51: Asia Pacific Virtual Reality In Automotive Revenue Share (%), by Country 2025 & 2033
List of Tables
- Table 1: Global Virtual Reality In Automotive Revenue million Forecast, by Offering 2020 & 2033
- Table 2: Global Virtual Reality In Automotive Revenue million Forecast, by Vehicle Type 2020 & 2033
- Table 3: Global Virtual Reality In Automotive Revenue million Forecast, by Application 2020 & 2033
- Table 4: Global Virtual Reality In Automotive Revenue million Forecast, by End User 2020 & 2033
- Table 5: Global Virtual Reality In Automotive Revenue million Forecast, by Region 2020 & 2033
- Table 6: Global Virtual Reality In Automotive Revenue million Forecast, by Offering 2020 & 2033
- Table 7: Global Virtual Reality In Automotive Revenue million Forecast, by Vehicle Type 2020 & 2033
- Table 8: Global Virtual Reality In Automotive Revenue million Forecast, by Application 2020 & 2033
- Table 9: Global Virtual Reality In Automotive Revenue million Forecast, by End User 2020 & 2033
- Table 10: Global Virtual Reality In Automotive Revenue million Forecast, by Country 2020 & 2033
- Table 11: United States Virtual Reality In Automotive Revenue (million) Forecast, by Application 2020 & 2033
- Table 12: Canada Virtual Reality In Automotive Revenue (million) Forecast, by Application 2020 & 2033
- Table 13: Mexico Virtual Reality In Automotive Revenue (million) Forecast, by Application 2020 & 2033
- Table 14: Global Virtual Reality In Automotive Revenue million Forecast, by Offering 2020 & 2033
- Table 15: Global Virtual Reality In Automotive Revenue million Forecast, by Vehicle Type 2020 & 2033
- Table 16: Global Virtual Reality In Automotive Revenue million Forecast, by Application 2020 & 2033
- Table 17: Global Virtual Reality In Automotive Revenue million Forecast, by End User 2020 & 2033
- Table 18: Global Virtual Reality In Automotive Revenue million Forecast, by Country 2020 & 2033
- Table 19: Brazil Virtual Reality In Automotive Revenue (million) Forecast, by Application 2020 & 2033
- Table 20: Argentina Virtual Reality In Automotive Revenue (million) Forecast, by Application 2020 & 2033
- Table 21: Rest of South America Virtual Reality In Automotive Revenue (million) Forecast, by Application 2020 & 2033
- Table 22: Global Virtual Reality In Automotive Revenue million Forecast, by Offering 2020 & 2033
- Table 23: Global Virtual Reality In Automotive Revenue million Forecast, by Vehicle Type 2020 & 2033
- Table 24: Global Virtual Reality In Automotive Revenue million Forecast, by Application 2020 & 2033
- Table 25: Global Virtual Reality In Automotive Revenue million Forecast, by End User 2020 & 2033
- Table 26: Global Virtual Reality In Automotive Revenue million Forecast, by Country 2020 & 2033
- Table 27: United Kingdom Virtual Reality In Automotive Revenue (million) Forecast, by Application 2020 & 2033
- Table 28: Germany Virtual Reality In Automotive Revenue (million) Forecast, by Application 2020 & 2033
- Table 29: France Virtual Reality In Automotive Revenue (million) Forecast, by Application 2020 & 2033
- Table 30: Italy Virtual Reality In Automotive Revenue (million) Forecast, by Application 2020 & 2033
- Table 31: Spain Virtual Reality In Automotive Revenue (million) Forecast, by Application 2020 & 2033
- Table 32: Russia Virtual Reality In Automotive Revenue (million) Forecast, by Application 2020 & 2033
- Table 33: Benelux Virtual Reality In Automotive Revenue (million) Forecast, by Application 2020 & 2033
- Table 34: Nordics Virtual Reality In Automotive Revenue (million) Forecast, by Application 2020 & 2033
- Table 35: Rest of Europe Virtual Reality In Automotive Revenue (million) Forecast, by Application 2020 & 2033
- Table 36: Global Virtual Reality In Automotive Revenue million Forecast, by Offering 2020 & 2033
- Table 37: Global Virtual Reality In Automotive Revenue million Forecast, by Vehicle Type 2020 & 2033
- Table 38: Global Virtual Reality In Automotive Revenue million Forecast, by Application 2020 & 2033
- Table 39: Global Virtual Reality In Automotive Revenue million Forecast, by End User 2020 & 2033
- Table 40: Global Virtual Reality In Automotive Revenue million Forecast, by Country 2020 & 2033
- Table 41: Turkey Virtual Reality In Automotive Revenue (million) Forecast, by Application 2020 & 2033
- Table 42: Israel Virtual Reality In Automotive Revenue (million) Forecast, by Application 2020 & 2033
- Table 43: GCC Virtual Reality In Automotive Revenue (million) Forecast, by Application 2020 & 2033
- Table 44: North Africa Virtual Reality In Automotive Revenue (million) Forecast, by Application 2020 & 2033
- Table 45: South Africa Virtual Reality In Automotive Revenue (million) Forecast, by Application 2020 & 2033
- Table 46: Rest of Middle East & Africa Virtual Reality In Automotive Revenue (million) Forecast, by Application 2020 & 2033
- Table 47: Global Virtual Reality In Automotive Revenue million Forecast, by Offering 2020 & 2033
- Table 48: Global Virtual Reality In Automotive Revenue million Forecast, by Vehicle Type 2020 & 2033
- Table 49: Global Virtual Reality In Automotive Revenue million Forecast, by Application 2020 & 2033
- Table 50: Global Virtual Reality In Automotive Revenue million Forecast, by End User 2020 & 2033
- Table 51: Global Virtual Reality In Automotive Revenue million Forecast, by Country 2020 & 2033
- Table 52: China Virtual Reality In Automotive Revenue (million) Forecast, by Application 2020 & 2033
- Table 53: India Virtual Reality In Automotive Revenue (million) Forecast, by Application 2020 & 2033
- Table 54: Japan Virtual Reality In Automotive Revenue (million) Forecast, by Application 2020 & 2033
- Table 55: South Korea Virtual Reality In Automotive Revenue (million) Forecast, by Application 2020 & 2033
- Table 56: ASEAN Virtual Reality In Automotive Revenue (million) Forecast, by Application 2020 & 2033
- Table 57: Oceania Virtual Reality In Automotive Revenue (million) Forecast, by Application 2020 & 2033
- Table 58: Rest of Asia Pacific Virtual Reality In Automotive Revenue (million) Forecast, by Application 2020 & 2033
Frequently Asked Questions
1. What is the projected Compound Annual Growth Rate (CAGR) of the Virtual Reality In Automotive?
The projected CAGR is approximately 20.1%.
2. Which companies are prominent players in the Virtual Reality In Automotive?
Key companies in the market include Vection Technologies Ltd., Wear Studio, Unity Technologies, XR Labs, NVIDIA, Bosch GmbH, Meta Platforms, Inc., Tecknotrove, Volkswagen AG, BMW M GmbH, WayRay AG, Autodesk, Others.
3. What are the main segments of the Virtual Reality In Automotive?
The market segments include Offering, Vehicle Type, Application, End User.
4. Can you provide details about the market size?
The market size is estimated to be USD 6926 million as of 2022.
5. What are some drivers contributing to market growth?
N/A
6. What are the notable trends driving market growth?
N/A
7. Are there any restraints impacting market growth?
N/A
8. Can you provide examples of recent developments in the market?
N/A
9. What pricing options are available for accessing the report?
Pricing options include single-user, multi-user, and enterprise licenses priced at USD 3950.00, USD 5925.00, and USD 7900.00 respectively.
10. Is the market size provided in terms of value or volume?
The market size is provided in terms of value, measured in million.
11. Are there any specific market keywords associated with the report?
Yes, the market keyword associated with the report is "Virtual Reality In Automotive," which aids in identifying and referencing the specific market segment covered.
12. How do I determine which pricing option suits my needs best?
The pricing options vary based on user requirements and access needs. Individual users may opt for single-user licenses, while businesses requiring broader access may choose multi-user or enterprise licenses for cost-effective access to the report.
13. Are there any additional resources or data provided in the Virtual Reality In Automotive report?
While the report offers comprehensive insights, it's advisable to review the specific contents or supplementary materials provided to ascertain if additional resources or data are available.
14. How can I stay updated on further developments or reports in the Virtual Reality In Automotive?
To stay informed about further developments, trends, and reports in the Virtual Reality In Automotive, consider subscribing to industry newsletters, following relevant companies and organizations, or regularly checking reputable industry news sources and publications.
Methodology
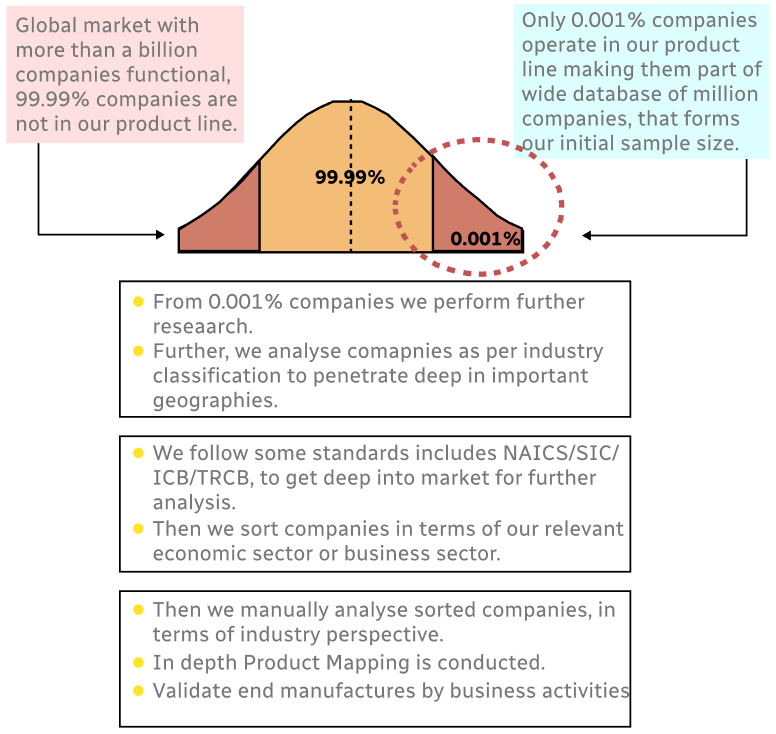
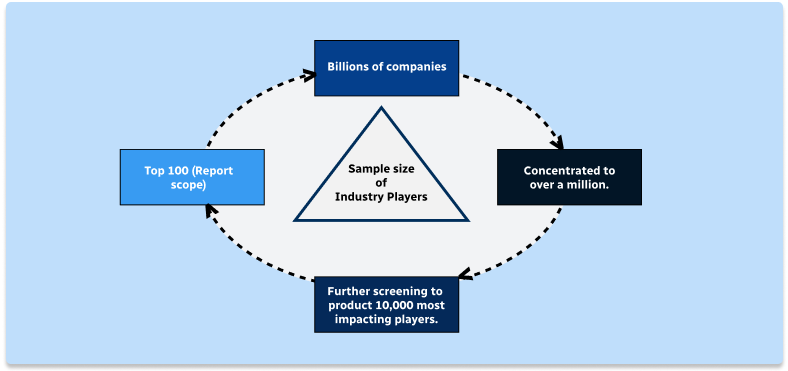
Step 1 - Identification of Relevant Samples Size from Population Database
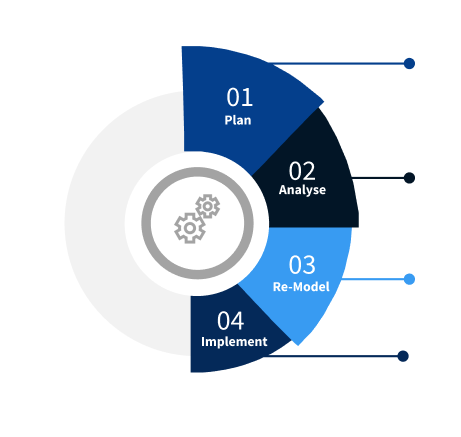
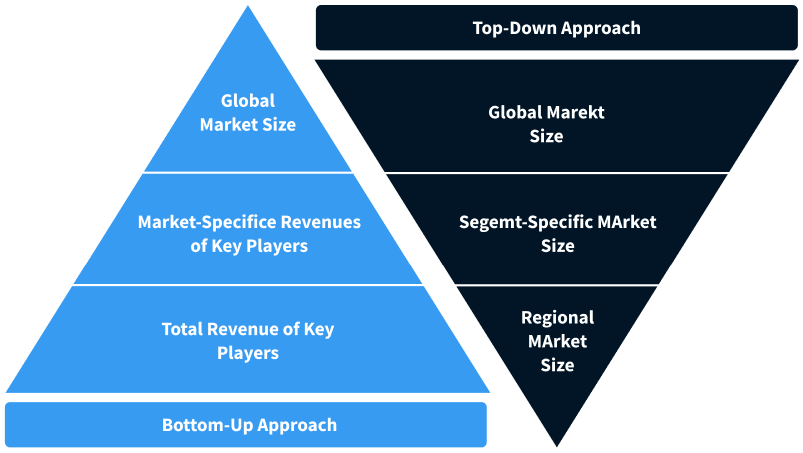
Step 2 - Approaches for Defining Global Market Size (Value, Volume* & Price*)
Note*: In applicable scenarios
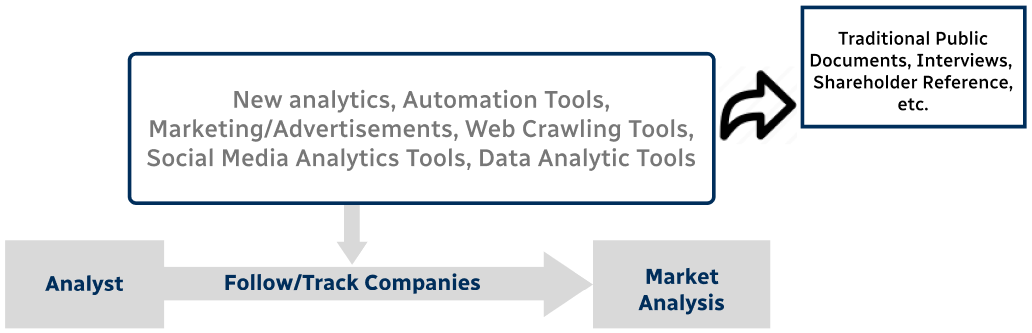
Step 3 - Data Sources
Primary Research
- Web Analytics
- Survey Reports
- Research Institute
- Latest Research Reports
- Opinion Leaders
Secondary Research
- Annual Reports
- White Paper
- Latest Press Release
- Industry Association
- Paid Database
- Investor Presentations
Step 4 - Data Triangulation
Involves using different sources of information in order to increase the validity of a study
These sources are likely to be stakeholders in a program - participants, other researchers, program staff, other community members, and so on.
Then we put all data in single framework & apply various statistical tools to find out the dynamic on the market.
During the analysis stage, feedback from the stakeholder groups would be compared to determine areas of agreement as well as areas of divergence