

Key Insights
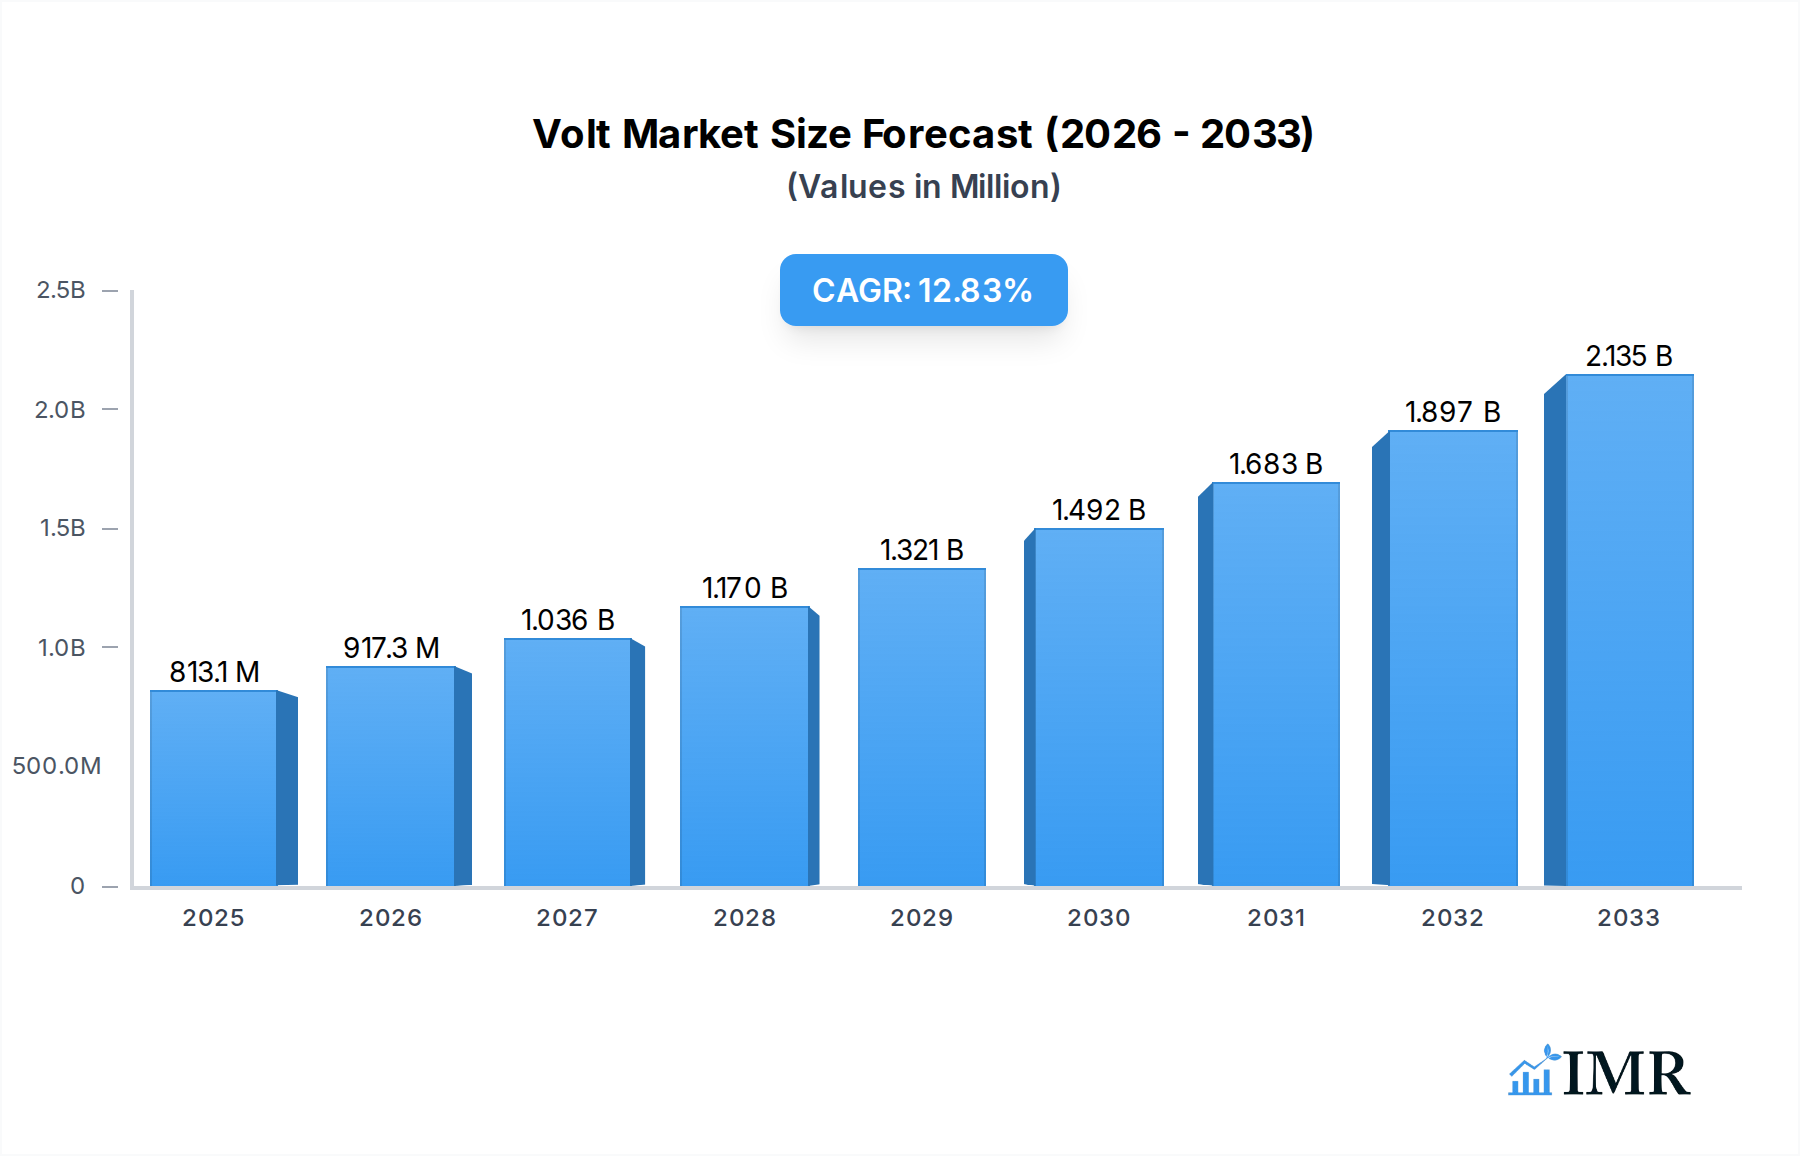
The global Volt & VAr Management market is poised for significant expansion, projected to reach $813.1 million by 2025, demonstrating a robust compound annual growth rate (CAGR) of 12.9% through 2033. This dynamic growth is propelled by an escalating demand for enhanced grid stability and efficiency, driven by increasing renewable energy integration and the growing complexity of power grids. The proliferation of smart grid technologies, coupled with stringent regulatory mandates for optimized power quality and reduced energy losses, are key catalysts for market acceleration. Furthermore, the increasing adoption of advanced software solutions for real-time monitoring and control, alongside specialized hardware and comprehensive services, underscores the multifaceted nature of this market's expansion.

Volt & VAr Management Market Size (In Million)
The market's growth trajectory is further supported by critical drivers such as the imperative to reduce energy wastage in transmission and distribution networks and the need for reliable power supply to meet the demands of industrial and commercial sectors. While the adoption of sophisticated Volt & VAr management systems presents an investment, the long-term benefits of improved operational efficiency, reduced downtime, and enhanced power quality are compelling. Key players like ABB, Eaton, and Schneider Electric are at the forefront, investing in innovative solutions to address the evolving challenges of grid management. The Asia Pacific region, particularly China and India, is expected to emerge as a significant growth hub due to rapid industrialization and infrastructure development, further bolstering the overall market expansion.
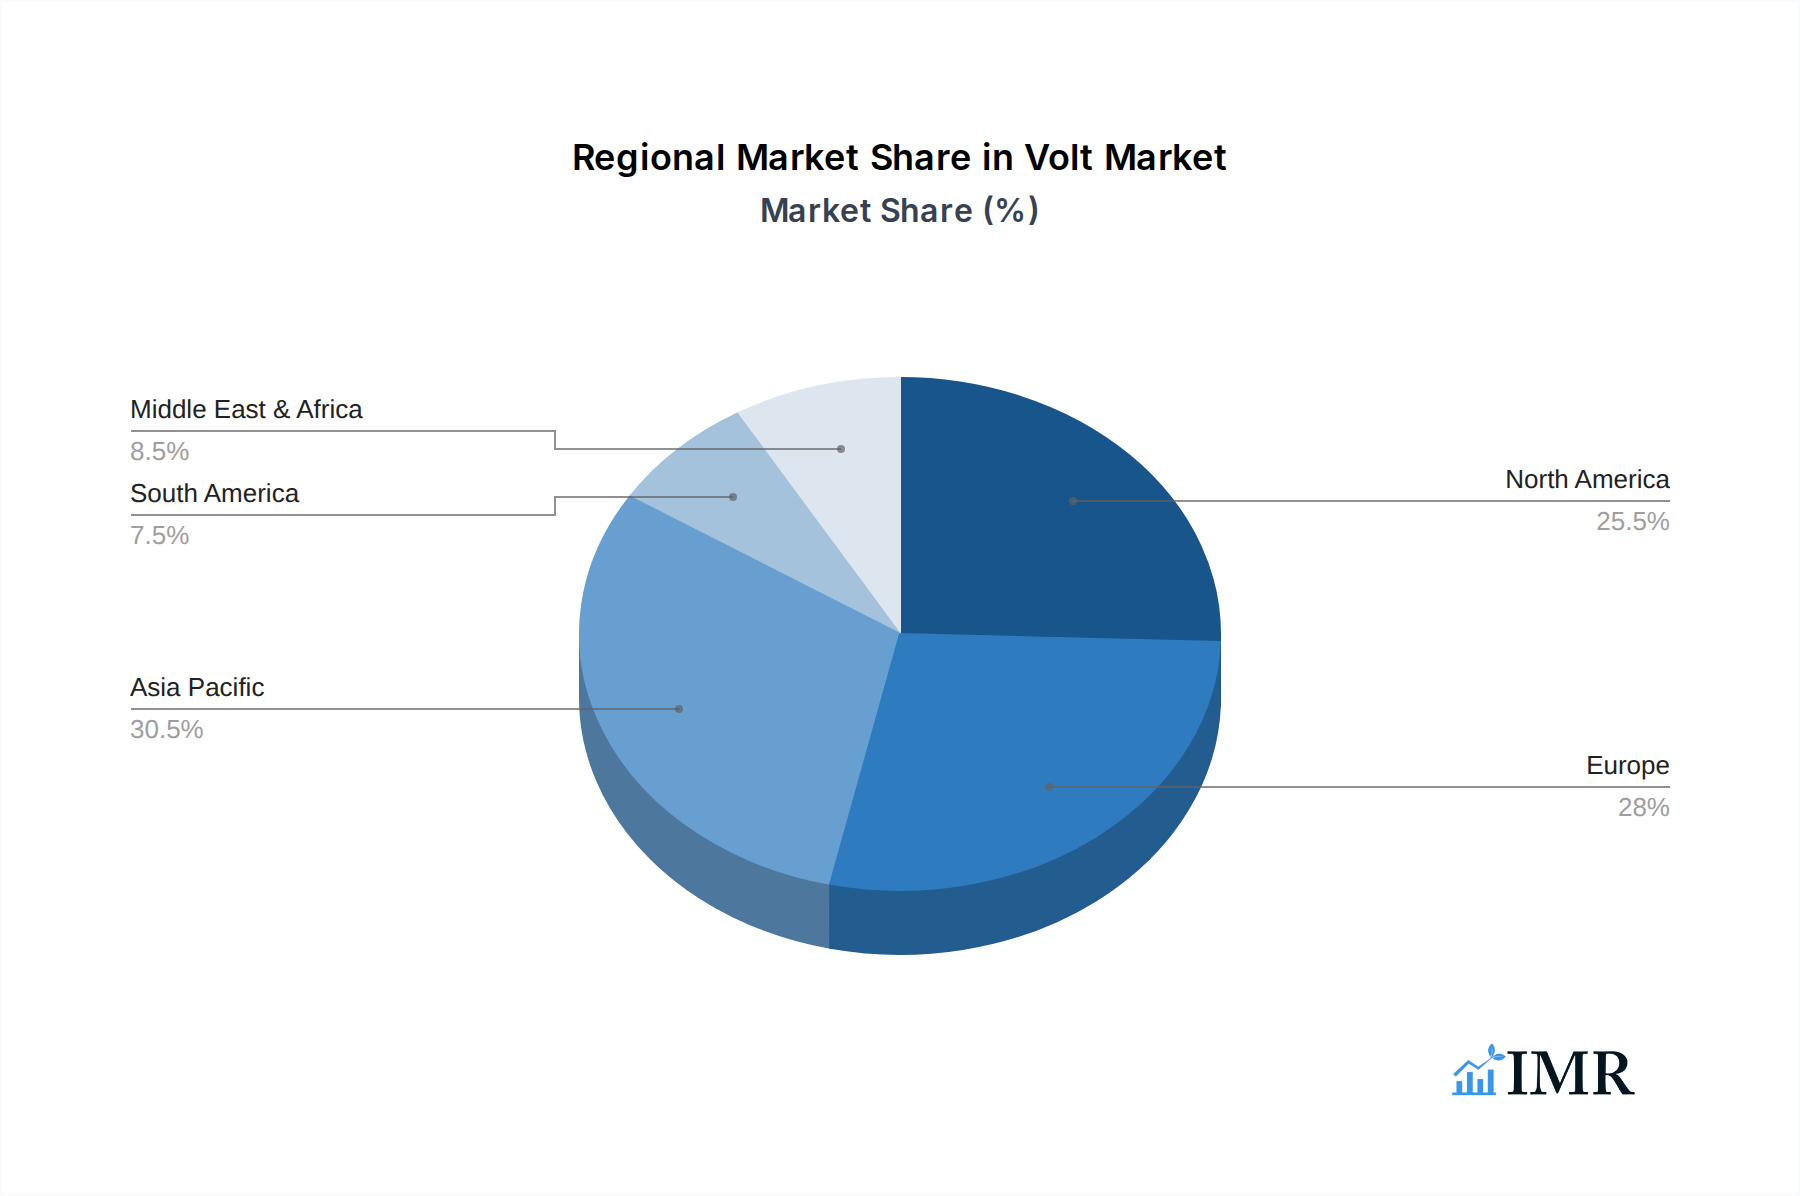
Volt & VAr Management Company Market Share
This comprehensive Volt & VAr Management market report provides an in-depth analysis of the global power quality solutions landscape, crucial for optimizing grid stability and efficiency. Spanning from 2019 to 2033, with a detailed focus on the 2025 base and estimated year, this report offers unparalleled insights into the transmission, distribution, and generation sectors. We delve into the evolving hardware, software, and services segments, identifying key market drivers, growth trends, and the strategic maneuvers of leading players. Maximize your understanding of reactive power compensation, voltage regulation, and grid modernization initiatives with this definitive guide.
Volt & VAr Management Market Dynamics & Structure
The Volt & VAr Management market is characterized by a dynamic and moderately concentrated structure, driven by a confluence of technological innovation and stringent regulatory frameworks. The increasing integration of renewable energy sources, with their inherent intermittency, amplifies the demand for sophisticated Volt & VAr control to maintain grid stability. Technological innovation, particularly in areas like advanced metering infrastructure (AMI) and smart grid technologies, acts as a primary catalyst, enabling real-time monitoring and automated adjustments.
- Market Concentration: Leading players like ABB, Eaton, and Schneider Electric hold significant market share, but a growing number of specialized firms are emerging, fostering healthy competition.
- Technological Innovation Drivers: AI-powered analytics for predictive maintenance, enhanced power electronic devices for faster response times, and IoT integration for seamless data flow are key innovation areas.
- Regulatory Frameworks: Mandates for grid reliability, efficiency improvements, and the integration of distributed energy resources (DERs) are shaping market demand and product development.
- Competitive Product Substitutes: While dedicated Volt & VAr solutions are dominant, some functionalities can be achieved through broader grid automation systems, creating a nuanced competitive landscape.
- End-User Demographics: Utilities, industrial facilities, and large commercial entities are the primary end-users, each with distinct needs and priorities regarding power quality and grid performance.
- M&A Trends: Strategic acquisitions are prevalent as larger companies seek to expand their portfolios and technological capabilities, with an estimated XX deal volumes observed during the historical period.
Volt & VAr Management Growth Trends & Insights
The Volt & VAr Management market is poised for robust expansion, fueled by the global imperative for a more resilient, efficient, and sustainable power grid. The market size is projected to witness a significant upward trajectory, with a projected Compound Annual Growth Rate (CAGR) of xx% from 2025 to 2033. This growth is underpinned by increasing investments in grid modernization initiatives worldwide. The adoption rates of advanced Volt & VAr solutions are accelerating as utilities and industrial consumers recognize the tangible benefits of improved power quality, including reduced energy losses, enhanced equipment longevity, and greater operational reliability.
Technological disruptions are playing a pivotal role. The advent of sophisticated software platforms offering real-time data analytics and predictive capabilities is transforming how Volt & VAr is managed. These digital solutions enable proactive rather than reactive control, allowing for finer adjustments to voltage and reactive power flow, thereby optimizing grid performance and minimizing disturbances. Furthermore, the increasing penetration of distributed energy resources (DERs) such as solar and wind power presents both a challenge and an opportunity. While these sources can introduce variability, advanced Volt & VAr management systems are essential for their seamless integration and for mitigating their impact on grid stability.
Consumer behavior shifts are also contributing to market growth. There's a growing awareness among industrial and commercial consumers about the economic implications of poor power quality, leading to increased demand for solutions that guarantee consistent and reliable power supply. This heightened demand translates into greater market penetration for sophisticated Volt & VAr hardware, intelligent software, and comprehensive service offerings. The transition towards smart grids further mandates the deployment of these technologies, creating a fertile ground for sustained market growth. The global market value is estimated to reach approximately $XX billion by 2033, up from $XX billion in 2025. This substantial growth indicates a strong market appetite for advanced Volt & VAr solutions as grid infrastructure evolves.
Dominant Regions, Countries, or Segments in Volt & VAr Management
The Distribution application segment is currently the most dominant driver of the Volt & VAr Management market, accounting for an estimated xx% of the global market share in 2025. This dominance is primarily attributed to the sheer scale and complexity of distribution networks, which are often the first point of impact for voltage fluctuations and reactive power imbalances. Factors such as the increasing integration of distributed generation, the aging infrastructure in many regions, and the growing demand for reliable power in urban and suburban areas all contribute to the heightened need for effective Volt & VAr management at this level. Economic policies that encourage grid modernization and incentivize utilities to improve power quality further bolster this segment.
North America, particularly the United States and Canada, stands out as the leading region, driven by significant investments in smart grid technologies and a proactive regulatory environment that emphasizes grid reliability. The country's robust industrial base also necessitates advanced power quality solutions to protect sensitive equipment and optimize energy consumption. In Europe, Germany and the United Kingdom are key markets, propelled by strong renewable energy integration targets and a focus on energy efficiency. Asia-Pacific, led by China and India, presents the highest growth potential due to rapid industrialization, expanding electricity demand, and ongoing large-scale grid infrastructure development projects.
Within the Hardware type, advanced reactive power compensation devices and voltage regulators continue to hold a significant market share due to their fundamental role in maintaining grid stability. However, the Software segment is experiencing the most rapid growth. This surge is driven by the proliferation of IoT-enabled sensors, AI-driven analytics platforms for predictive maintenance and optimal control, and sophisticated grid management software. The ability of software solutions to provide real-time insights, enable remote monitoring, and facilitate automated adjustments is making them indispensable for modern grid operations. Services, including installation, maintenance, and consulting, are also crucial, supporting the deployment and optimization of both hardware and software solutions, and are expected to grow at a CAGR of xx% during the forecast period.
Volt & VAr Management Product Landscape
The Volt & VAr Management product landscape is characterized by a continuous stream of innovations aimed at enhancing grid efficiency and reliability. Advanced Static Var Compensators (SVCs) and Synchronous Condensers are evolving with faster response times and improved controllability, offering dynamic reactive power support. Modern intelligent electronic devices (IEDs) are integrating sophisticated algorithms for precise voltage regulation and harmonic filtering. Software solutions are at the forefront of innovation, with AI-powered platforms offering predictive analytics for fault detection and optimization of reactive power dispatch. Cloud-based solutions are emerging, providing enhanced scalability and accessibility for utilities of all sizes.
Key Drivers, Barriers & Challenges in Volt & VAr Management
Key Drivers:
- Growing Demand for Grid Stability: The increasing integration of renewable energy sources necessitates sophisticated Volt & VAr management to maintain grid reliability.
- Aging Infrastructure Modernization: Utilities are investing in upgrading existing grids with smart technologies, including advanced Volt & VAr solutions, to improve efficiency and performance.
- Technological Advancements: Innovations in power electronics, AI, and IoT are enabling more precise and automated Volt & VAr control.
- Regulatory Mandates: Government regulations promoting energy efficiency and grid stability are driving market adoption.
- Cost Savings: Optimized Volt & VAr management leads to reduced energy losses and enhanced equipment lifespan, offering significant economic benefits.
Barriers & Challenges:
- High Initial Investment Costs: Implementing advanced Volt & VAr systems can require substantial upfront capital expenditure, particularly for smaller utilities.
- Cybersecurity Concerns: The increasing reliance on software and connected devices raises concerns about data security and potential cyber threats.
- Interoperability Issues: Ensuring seamless integration of new Volt & VAr solutions with existing grid infrastructure can be complex.
- Skilled Workforce Shortage: A lack of adequately trained personnel to operate and maintain sophisticated Volt & VAr systems can hinder adoption.
- Supply Chain Disruptions: Global supply chain issues can impact the availability and cost of critical components, affecting project timelines.
Emerging Opportunities in Volt & VAr Management
Emerging opportunities in the Volt & VAr Management sector lie in the increasing adoption of microgrids and distributed energy resource management systems (DERMS). These decentralized energy systems require sophisticated Volt & VAr control to ensure stability and seamless integration of various power sources. Furthermore, the development of advanced AI and machine learning algorithms for predictive Volt & VAr optimization presents a significant avenue for growth. The expansion of electric vehicle (EV) charging infrastructure also creates a new demand for managing the reactive power loads associated with high-power charging stations, opening up niche market opportunities.
Growth Accelerators in the Volt & VAr Management Industry
Growth accelerators in the Volt & VAr Management industry include the strategic partnerships between traditional power equipment manufacturers and innovative software companies. These collaborations are crucial for developing integrated solutions that combine robust hardware with intelligent control systems. Market expansion into emerging economies with rapidly developing power grids also presents a substantial growth catalyst. Furthermore, continued technological breakthroughs in areas like solid-state transformers and advanced energy storage systems, which can inherently provide Volt & VAr support, are expected to further drive market expansion and innovation.
Key Players Shaping the Volt & VAr Management Market
- ABB
- Eaton
- Schneider Electric
- DVI
- Landis+Gyr
- Open Systems International
- VArentec
- Beckwith Electric
- Dc Systems
- S and C Electric
Notable Milestones in Volt & VAr Management Sector
- 2019: Launch of advanced AI-powered analytics platforms for grid optimization, enhancing predictive capabilities for Volt & VAr management.
- 2020: Increased deployment of hybrid SVC solutions combining traditional and power electronic technologies for faster response times.
- 2021: Significant growth in demand for cloud-based Volt & VAr management software, offering enhanced scalability and accessibility for utilities.
- 2022: Major investments by utilities in smart grid infrastructure, leading to increased adoption of intelligent Volt & VAr control devices.
- 2023: Emergence of specialized solutions for microgrid Volt & VAr management to support energy independence and resilience.
- 2024: Increased focus on cybersecurity features within Volt & VAr management systems to protect critical grid infrastructure.
In-Depth Volt & VAr Management Market Outlook
The future of the Volt & VAr Management market is exceptionally promising, driven by the relentless pursuit of grid modernization and the increasing complexity of power systems. Growth accelerators such as the ongoing digital transformation of utilities, the widespread adoption of renewable energy, and the electrification of transportation will continue to fuel demand for advanced Volt & VAr solutions. Strategic opportunities lie in developing integrated platforms that offer end-to-end grid management capabilities, including predictive analytics, automated control, and enhanced cybersecurity. The market is expected to witness sustained innovation, with a particular emphasis on intelligent software and flexible hardware solutions that can adapt to evolving grid dynamics.
Volt & VAr Management Segmentation
-
1. Application
- 1.1. Distribution
- 1.2. Transmission
- 1.3. Generation
-
2. Types
- 2.1. Hardware
- 2.2. Software
- 2.3. Services
Volt & VAr Management Segmentation By Geography
-
1. North America
- 1.1. United States
- 1.2. Canada
- 1.3. Mexico
-
2. South America
- 2.1. Brazil
- 2.2. Argentina
- 2.3. Rest of South America
-
3. Europe
- 3.1. United Kingdom
- 3.2. Germany
- 3.3. France
- 3.4. Italy
- 3.5. Spain
- 3.6. Russia
- 3.7. Benelux
- 3.8. Nordics
- 3.9. Rest of Europe
-
4. Middle East & Africa
- 4.1. Turkey
- 4.2. Israel
- 4.3. GCC
- 4.4. North Africa
- 4.5. South Africa
- 4.6. Rest of Middle East & Africa
-
5. Asia Pacific
- 5.1. China
- 5.2. India
- 5.3. Japan
- 5.4. South Korea
- 5.5. ASEAN
- 5.6. Oceania
- 5.7. Rest of Asia Pacific
Volt & VAr Management Regional Market Share
Geographic Coverage of Volt & VAr Management
Volt & VAr Management REPORT HIGHLIGHTS
| Aspects | Details |
|---|---|
| Study Period | 2020-2034 |
| Base Year | 2025 |
| Estimated Year | 2026 |
| Forecast Period | 2026-2034 |
| Historical Period | 2020-2025 |
| Growth Rate | CAGR of 12.9% from 2020-2034 |
| Segmentation |
|
Table of Contents
- 1. Introduction
- 1.1. Research Scope
- 1.2. Market Segmentation
- 1.3. Research Methodology
- 1.4. Definitions and Assumptions
- 2. Executive Summary
- 2.1. Introduction
- 3. Market Dynamics
- 3.1. Introduction
- 3.2. Market Drivers
- 3.3. Market Restrains
- 3.4. Market Trends
- 4. Market Factor Analysis
- 4.1. Porters Five Forces
- 4.2. Supply/Value Chain
- 4.3. PESTEL analysis
- 4.4. Market Entropy
- 4.5. Patent/Trademark Analysis
- 5. Global Volt & VAr Management Analysis, Insights and Forecast, 2020-2032
- 5.1. Market Analysis, Insights and Forecast - by Application
- 5.1.1. Distribution
- 5.1.2. Transmission
- 5.1.3. Generation
- 5.2. Market Analysis, Insights and Forecast - by Types
- 5.2.1. Hardware
- 5.2.2. Software
- 5.2.3. Services
- 5.3. Market Analysis, Insights and Forecast - by Region
- 5.3.1. North America
- 5.3.2. South America
- 5.3.3. Europe
- 5.3.4. Middle East & Africa
- 5.3.5. Asia Pacific
- 5.1. Market Analysis, Insights and Forecast - by Application
- 6. North America Volt & VAr Management Analysis, Insights and Forecast, 2020-2032
- 6.1. Market Analysis, Insights and Forecast - by Application
- 6.1.1. Distribution
- 6.1.2. Transmission
- 6.1.3. Generation
- 6.2. Market Analysis, Insights and Forecast - by Types
- 6.2.1. Hardware
- 6.2.2. Software
- 6.2.3. Services
- 6.1. Market Analysis, Insights and Forecast - by Application
- 7. South America Volt & VAr Management Analysis, Insights and Forecast, 2020-2032
- 7.1. Market Analysis, Insights and Forecast - by Application
- 7.1.1. Distribution
- 7.1.2. Transmission
- 7.1.3. Generation
- 7.2. Market Analysis, Insights and Forecast - by Types
- 7.2.1. Hardware
- 7.2.2. Software
- 7.2.3. Services
- 7.1. Market Analysis, Insights and Forecast - by Application
- 8. Europe Volt & VAr Management Analysis, Insights and Forecast, 2020-2032
- 8.1. Market Analysis, Insights and Forecast - by Application
- 8.1.1. Distribution
- 8.1.2. Transmission
- 8.1.3. Generation
- 8.2. Market Analysis, Insights and Forecast - by Types
- 8.2.1. Hardware
- 8.2.2. Software
- 8.2.3. Services
- 8.1. Market Analysis, Insights and Forecast - by Application
- 9. Middle East & Africa Volt & VAr Management Analysis, Insights and Forecast, 2020-2032
- 9.1. Market Analysis, Insights and Forecast - by Application
- 9.1.1. Distribution
- 9.1.2. Transmission
- 9.1.3. Generation
- 9.2. Market Analysis, Insights and Forecast - by Types
- 9.2.1. Hardware
- 9.2.2. Software
- 9.2.3. Services
- 9.1. Market Analysis, Insights and Forecast - by Application
- 10. Asia Pacific Volt & VAr Management Analysis, Insights and Forecast, 2020-2032
- 10.1. Market Analysis, Insights and Forecast - by Application
- 10.1.1. Distribution
- 10.1.2. Transmission
- 10.1.3. Generation
- 10.2. Market Analysis, Insights and Forecast - by Types
- 10.2.1. Hardware
- 10.2.2. Software
- 10.2.3. Services
- 10.1. Market Analysis, Insights and Forecast - by Application
- 11. Competitive Analysis
- 11.1. Global Market Share Analysis 2025
- 11.2. Company Profiles
- 11.2.1 ABB
- 11.2.1.1. Overview
- 11.2.1.2. Products
- 11.2.1.3. SWOT Analysis
- 11.2.1.4. Recent Developments
- 11.2.1.5. Financials (Based on Availability)
- 11.2.2 Eaton
- 11.2.2.1. Overview
- 11.2.2.2. Products
- 11.2.2.3. SWOT Analysis
- 11.2.2.4. Recent Developments
- 11.2.2.5. Financials (Based on Availability)
- 11.2.3 Schneider Electric
- 11.2.3.1. Overview
- 11.2.3.2. Products
- 11.2.3.3. SWOT Analysis
- 11.2.3.4. Recent Developments
- 11.2.3.5. Financials (Based on Availability)
- 11.2.4 DVI
- 11.2.4.1. Overview
- 11.2.4.2. Products
- 11.2.4.3. SWOT Analysis
- 11.2.4.4. Recent Developments
- 11.2.4.5. Financials (Based on Availability)
- 11.2.5 Landis+Gyr
- 11.2.5.1. Overview
- 11.2.5.2. Products
- 11.2.5.3. SWOT Analysis
- 11.2.5.4. Recent Developments
- 11.2.5.5. Financials (Based on Availability)
- 11.2.6 Open Systems International
- 11.2.6.1. Overview
- 11.2.6.2. Products
- 11.2.6.3. SWOT Analysis
- 11.2.6.4. Recent Developments
- 11.2.6.5. Financials (Based on Availability)
- 11.2.7 VArentec
- 11.2.7.1. Overview
- 11.2.7.2. Products
- 11.2.7.3. SWOT Analysis
- 11.2.7.4. Recent Developments
- 11.2.7.5. Financials (Based on Availability)
- 11.2.8 Beckwith Electric
- 11.2.8.1. Overview
- 11.2.8.2. Products
- 11.2.8.3. SWOT Analysis
- 11.2.8.4. Recent Developments
- 11.2.8.5. Financials (Based on Availability)
- 11.2.9 Dc Systems
- 11.2.9.1. Overview
- 11.2.9.2. Products
- 11.2.9.3. SWOT Analysis
- 11.2.9.4. Recent Developments
- 11.2.9.5. Financials (Based on Availability)
- 11.2.10 S and C Electric
- 11.2.10.1. Overview
- 11.2.10.2. Products
- 11.2.10.3. SWOT Analysis
- 11.2.10.4. Recent Developments
- 11.2.10.5. Financials (Based on Availability)
- 11.2.1 ABB
List of Figures
- Figure 1: Global Volt & VAr Management Revenue Breakdown (million, %) by Region 2025 & 2033
- Figure 2: North America Volt & VAr Management Revenue (million), by Application 2025 & 2033
- Figure 3: North America Volt & VAr Management Revenue Share (%), by Application 2025 & 2033
- Figure 4: North America Volt & VAr Management Revenue (million), by Types 2025 & 2033
- Figure 5: North America Volt & VAr Management Revenue Share (%), by Types 2025 & 2033
- Figure 6: North America Volt & VAr Management Revenue (million), by Country 2025 & 2033
- Figure 7: North America Volt & VAr Management Revenue Share (%), by Country 2025 & 2033
- Figure 8: South America Volt & VAr Management Revenue (million), by Application 2025 & 2033
- Figure 9: South America Volt & VAr Management Revenue Share (%), by Application 2025 & 2033
- Figure 10: South America Volt & VAr Management Revenue (million), by Types 2025 & 2033
- Figure 11: South America Volt & VAr Management Revenue Share (%), by Types 2025 & 2033
- Figure 12: South America Volt & VAr Management Revenue (million), by Country 2025 & 2033
- Figure 13: South America Volt & VAr Management Revenue Share (%), by Country 2025 & 2033
- Figure 14: Europe Volt & VAr Management Revenue (million), by Application 2025 & 2033
- Figure 15: Europe Volt & VAr Management Revenue Share (%), by Application 2025 & 2033
- Figure 16: Europe Volt & VAr Management Revenue (million), by Types 2025 & 2033
- Figure 17: Europe Volt & VAr Management Revenue Share (%), by Types 2025 & 2033
- Figure 18: Europe Volt & VAr Management Revenue (million), by Country 2025 & 2033
- Figure 19: Europe Volt & VAr Management Revenue Share (%), by Country 2025 & 2033
- Figure 20: Middle East & Africa Volt & VAr Management Revenue (million), by Application 2025 & 2033
- Figure 21: Middle East & Africa Volt & VAr Management Revenue Share (%), by Application 2025 & 2033
- Figure 22: Middle East & Africa Volt & VAr Management Revenue (million), by Types 2025 & 2033
- Figure 23: Middle East & Africa Volt & VAr Management Revenue Share (%), by Types 2025 & 2033
- Figure 24: Middle East & Africa Volt & VAr Management Revenue (million), by Country 2025 & 2033
- Figure 25: Middle East & Africa Volt & VAr Management Revenue Share (%), by Country 2025 & 2033
- Figure 26: Asia Pacific Volt & VAr Management Revenue (million), by Application 2025 & 2033
- Figure 27: Asia Pacific Volt & VAr Management Revenue Share (%), by Application 2025 & 2033
- Figure 28: Asia Pacific Volt & VAr Management Revenue (million), by Types 2025 & 2033
- Figure 29: Asia Pacific Volt & VAr Management Revenue Share (%), by Types 2025 & 2033
- Figure 30: Asia Pacific Volt & VAr Management Revenue (million), by Country 2025 & 2033
- Figure 31: Asia Pacific Volt & VAr Management Revenue Share (%), by Country 2025 & 2033
List of Tables
- Table 1: Global Volt & VAr Management Revenue million Forecast, by Application 2020 & 2033
- Table 2: Global Volt & VAr Management Revenue million Forecast, by Types 2020 & 2033
- Table 3: Global Volt & VAr Management Revenue million Forecast, by Region 2020 & 2033
- Table 4: Global Volt & VAr Management Revenue million Forecast, by Application 2020 & 2033
- Table 5: Global Volt & VAr Management Revenue million Forecast, by Types 2020 & 2033
- Table 6: Global Volt & VAr Management Revenue million Forecast, by Country 2020 & 2033
- Table 7: United States Volt & VAr Management Revenue (million) Forecast, by Application 2020 & 2033
- Table 8: Canada Volt & VAr Management Revenue (million) Forecast, by Application 2020 & 2033
- Table 9: Mexico Volt & VAr Management Revenue (million) Forecast, by Application 2020 & 2033
- Table 10: Global Volt & VAr Management Revenue million Forecast, by Application 2020 & 2033
- Table 11: Global Volt & VAr Management Revenue million Forecast, by Types 2020 & 2033
- Table 12: Global Volt & VAr Management Revenue million Forecast, by Country 2020 & 2033
- Table 13: Brazil Volt & VAr Management Revenue (million) Forecast, by Application 2020 & 2033
- Table 14: Argentina Volt & VAr Management Revenue (million) Forecast, by Application 2020 & 2033
- Table 15: Rest of South America Volt & VAr Management Revenue (million) Forecast, by Application 2020 & 2033
- Table 16: Global Volt & VAr Management Revenue million Forecast, by Application 2020 & 2033
- Table 17: Global Volt & VAr Management Revenue million Forecast, by Types 2020 & 2033
- Table 18: Global Volt & VAr Management Revenue million Forecast, by Country 2020 & 2033
- Table 19: United Kingdom Volt & VAr Management Revenue (million) Forecast, by Application 2020 & 2033
- Table 20: Germany Volt & VAr Management Revenue (million) Forecast, by Application 2020 & 2033
- Table 21: France Volt & VAr Management Revenue (million) Forecast, by Application 2020 & 2033
- Table 22: Italy Volt & VAr Management Revenue (million) Forecast, by Application 2020 & 2033
- Table 23: Spain Volt & VAr Management Revenue (million) Forecast, by Application 2020 & 2033
- Table 24: Russia Volt & VAr Management Revenue (million) Forecast, by Application 2020 & 2033
- Table 25: Benelux Volt & VAr Management Revenue (million) Forecast, by Application 2020 & 2033
- Table 26: Nordics Volt & VAr Management Revenue (million) Forecast, by Application 2020 & 2033
- Table 27: Rest of Europe Volt & VAr Management Revenue (million) Forecast, by Application 2020 & 2033
- Table 28: Global Volt & VAr Management Revenue million Forecast, by Application 2020 & 2033
- Table 29: Global Volt & VAr Management Revenue million Forecast, by Types 2020 & 2033
- Table 30: Global Volt & VAr Management Revenue million Forecast, by Country 2020 & 2033
- Table 31: Turkey Volt & VAr Management Revenue (million) Forecast, by Application 2020 & 2033
- Table 32: Israel Volt & VAr Management Revenue (million) Forecast, by Application 2020 & 2033
- Table 33: GCC Volt & VAr Management Revenue (million) Forecast, by Application 2020 & 2033
- Table 34: North Africa Volt & VAr Management Revenue (million) Forecast, by Application 2020 & 2033
- Table 35: South Africa Volt & VAr Management Revenue (million) Forecast, by Application 2020 & 2033
- Table 36: Rest of Middle East & Africa Volt & VAr Management Revenue (million) Forecast, by Application 2020 & 2033
- Table 37: Global Volt & VAr Management Revenue million Forecast, by Application 2020 & 2033
- Table 38: Global Volt & VAr Management Revenue million Forecast, by Types 2020 & 2033
- Table 39: Global Volt & VAr Management Revenue million Forecast, by Country 2020 & 2033
- Table 40: China Volt & VAr Management Revenue (million) Forecast, by Application 2020 & 2033
- Table 41: India Volt & VAr Management Revenue (million) Forecast, by Application 2020 & 2033
- Table 42: Japan Volt & VAr Management Revenue (million) Forecast, by Application 2020 & 2033
- Table 43: South Korea Volt & VAr Management Revenue (million) Forecast, by Application 2020 & 2033
- Table 44: ASEAN Volt & VAr Management Revenue (million) Forecast, by Application 2020 & 2033
- Table 45: Oceania Volt & VAr Management Revenue (million) Forecast, by Application 2020 & 2033
- Table 46: Rest of Asia Pacific Volt & VAr Management Revenue (million) Forecast, by Application 2020 & 2033
Frequently Asked Questions
1. What is the projected Compound Annual Growth Rate (CAGR) of the Volt & VAr Management?
The projected CAGR is approximately 12.9%.
2. Which companies are prominent players in the Volt & VAr Management?
Key companies in the market include ABB, Eaton, Schneider Electric, DVI, Landis+Gyr, Open Systems International, VArentec, Beckwith Electric, Dc Systems, S and C Electric.
3. What are the main segments of the Volt & VAr Management?
The market segments include Application, Types.
4. Can you provide details about the market size?
The market size is estimated to be USD 813.1 million as of 2022.
5. What are some drivers contributing to market growth?
N/A
6. What are the notable trends driving market growth?
N/A
7. Are there any restraints impacting market growth?
N/A
8. Can you provide examples of recent developments in the market?
N/A
9. What pricing options are available for accessing the report?
Pricing options include single-user, multi-user, and enterprise licenses priced at USD 4900.00, USD 7350.00, and USD 9800.00 respectively.
10. Is the market size provided in terms of value or volume?
The market size is provided in terms of value, measured in million.
11. Are there any specific market keywords associated with the report?
Yes, the market keyword associated with the report is "Volt & VAr Management," which aids in identifying and referencing the specific market segment covered.
12. How do I determine which pricing option suits my needs best?
The pricing options vary based on user requirements and access needs. Individual users may opt for single-user licenses, while businesses requiring broader access may choose multi-user or enterprise licenses for cost-effective access to the report.
13. Are there any additional resources or data provided in the Volt & VAr Management report?
While the report offers comprehensive insights, it's advisable to review the specific contents or supplementary materials provided to ascertain if additional resources or data are available.
14. How can I stay updated on further developments or reports in the Volt & VAr Management?
To stay informed about further developments, trends, and reports in the Volt & VAr Management, consider subscribing to industry newsletters, following relevant companies and organizations, or regularly checking reputable industry news sources and publications.
Methodology
Step 1 - Identification of Relevant Samples Size from Population Database


Step 2 - Approaches for Defining Global Market Size (Value, Volume* & Price*)

Note*: In applicable scenarios
Step 3 - Data Sources
Primary Research
- Web Analytics
- Survey Reports
- Research Institute
- Latest Research Reports
- Opinion Leaders
Secondary Research
- Annual Reports
- White Paper
- Latest Press Release
- Industry Association
- Paid Database
- Investor Presentations

Step 4 - Data Triangulation
Involves using different sources of information in order to increase the validity of a study
These sources are likely to be stakeholders in a program - participants, other researchers, program staff, other community members, and so on.
Then we put all data in single framework & apply various statistical tools to find out the dynamic on the market.
During the analysis stage, feedback from the stakeholder groups would be compared to determine areas of agreement as well as areas of divergence