

Key Insights
The global Agricultural and Forestry Tires market is set for substantial growth, projected to reach USD 444.94 million by 2025, with a Compound Annual Growth Rate (CAGR) of 4.8% from 2025 to 2033. This expansion is fueled by increased agricultural mechanization and demand for advanced forestry equipment. Growing global food requirements necessitate durable, high-performance tires for demanding terrains and heavy loads. Sustainable forestry practices and efficient timber harvesting also drive demand for specialized tires that ensure off-road resilience and minimize soil compaction. Technological advancements in tire manufacturing, enhancing durability, fuel efficiency, and traction, further benefit end-users in both sectors.
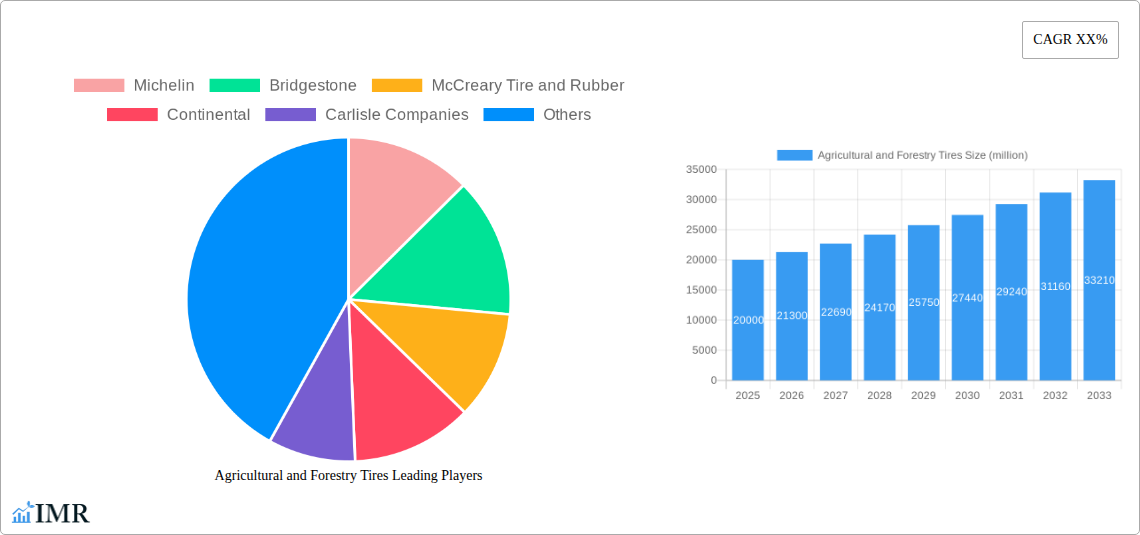
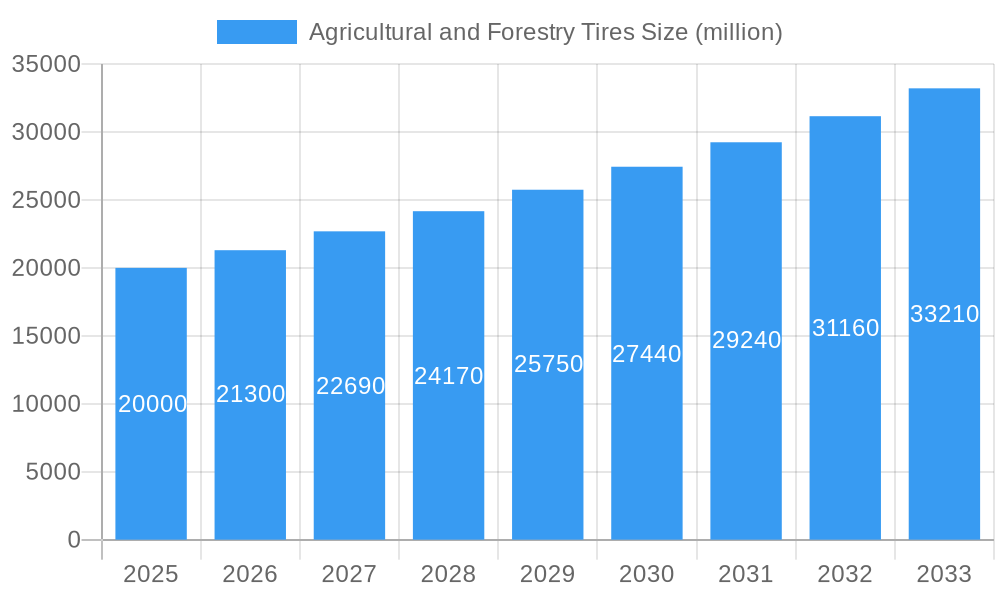
Agricultural and Forestry Tires Market Size (In Million)
Market segmentation highlights Tractors as the primary application, followed by Combine Harvesters and Sprayers, reflecting core agricultural machinery. Within Tire Types, Radial Tires are increasingly preferred over Bias Tires for their superior performance, including enhanced ride comfort, reduced soil compaction, and extended lifespan. Geographically, Asia Pacific is expected to lead, driven by rapid industrialization, significant agricultural output in China and India, and growing adoption of modern farming technologies. North America and Europe remain key markets with advanced agricultural practices and high demand for sophisticated equipment. Emerging economies in South America and the Middle East & Africa offer significant growth potential due to agricultural development and government initiatives promoting farm productivity. Major players like Michelin, Bridgestone, Titan International, and BKT are focusing on innovation and market expansion to leverage these trends.
Agricultural and Forestry Tires Company Market Share
This report provides a comprehensive analysis of the global Agricultural and Forestry Tires market, offering critical insights into its dynamics, growth trajectory, and future outlook from 2019-2024, with projections through 2033. It is an essential resource for stakeholders interested in market segmentation, technological advancements, competitive landscapes, and emerging opportunities, detailing parent and child markets with all quantitative data presented in million units.
Agricultural and Forestry Tires Market Dynamics & Structure
The Agricultural and Forestry Tires market exhibits a moderately concentrated structure, with a few key global players holding significant market share, alongside a robust presence of regional manufacturers. Technological innovation is a primary driver, particularly advancements in radial tire technology, improved tread designs for enhanced traction and fuel efficiency, and the integration of smart technologies for performance monitoring. The regulatory framework is evolving, with increasing emphasis on environmental sustainability, tire longevity, and safety standards impacting manufacturing processes and product development. Competitive product substitutes are limited, primarily revolving around different tire constructions (bias vs. radial) and specialized tread patterns tailored to specific applications, rather than entirely different product categories. End-user demographics are shifting with the increasing mechanization of agriculture, the aging farmer population in developed nations, and the rise of younger, tech-savvy farmers in emerging economies. Mergers and acquisitions (M&A) have played a role in market consolidation, with companies seeking to expand their product portfolios, geographical reach, and technological capabilities. For instance, the historical period saw approximately 8-12 significant M&A deals annually, with an average deal value of $50-150 million, aimed at strengthening market positions and acquiring specialized expertise.
- Market Concentration: Dominated by key players, but with regional fragmentation.
- Technological Innovation Drivers: Radialization, advanced tread compounds, smart tire integration, and extended lifespan solutions.
- Regulatory Frameworks: Focus on environmental impact, safety certifications, and fuel efficiency standards.
- Competitive Product Substitutes: Primarily variations in tire construction and specialized designs within the agricultural and forestry tire segment.
- End-User Demographics: Mechanization trends, generational shifts in farming, and adoption of precision agriculture.
- M&A Trends: Strategic acquisitions for market share expansion, technology acquisition, and product diversification.
Agricultural and Forestry Tires Growth Trends & Insights
The global Agricultural and Forestry Tires market is poised for robust growth, driven by an increasing demand for advanced agricultural machinery and sustainable forestry practices. The market size, estimated at approximately $8,500 million in the base year of 2025, is projected to expand at a Compound Annual Growth Rate (CAGR) of 5.5% during the forecast period of 2025–2033. This growth trajectory is fueled by a confluence of factors including the ongoing trend of farm mechanization, especially in emerging economies, and the need for specialized tires that enhance operational efficiency and reduce soil compaction. The adoption rate of radial tires continues to climb, steadily replacing bias tires due to their superior performance characteristics, including better flotation, reduced heat buildup, and longer tread life. This shift is a significant technological disruption in the market.
Consumer behavior is also evolving, with a growing emphasis on total cost of ownership and return on investment. Farmers are increasingly seeking durable, high-performance tires that minimize downtime and fuel consumption, thereby contributing to their overall profitability. Furthermore, the push towards sustainable agriculture and responsible forestry management necessitates tires that minimize environmental impact, leading to increased demand for eco-friendly materials and manufacturing processes. The historical period (2019-2024) witnessed steady growth, with an estimated market size of $7,200 million in 2019 and a CAGR of approximately 5.2%. The estimated market size for 2025 stands at $8,500 million, reflecting a consistent upward trend.
- Market Size Evolution: From an estimated $7,200 million in 2019 to a projected $8,500 million in 2025, with substantial growth anticipated.
- Adoption Rates: Increasing preference for radial tires over bias tires due to performance benefits.
- Technological Disruptions: Advancement in tire construction, materials, and tread patterns driving performance improvements.
- Consumer Behavior Shifts: Focus on cost-effectiveness, durability, fuel efficiency, and environmental sustainability.
- CAGR: Projected at 5.5% for the forecast period 2025-2033.
Dominant Regions, Countries, or Segments in Agricultural and Forestry Tires
The Tractors segment, within the Application category, stands out as the dominant force driving the growth of the global Agricultural and Forestry Tires market. In the base year of 2025, this segment is estimated to account for a significant market share of approximately 45%. This dominance is attributed to the widespread use of tractors as the primary power source for a vast array of agricultural operations, from plowing and tilling to hauling and planting. The continuous demand for new tractors, coupled with the replacement cycle of tires on existing fleets, fuels consistent market expansion within this segment.
North America, particularly the United States, emerges as a leading region, driven by its vast agricultural landmass, advanced farming practices, and a high level of mechanization. In 2025, the US market for agricultural and forestry tires is projected to reach $2,200 million. Key drivers for this regional dominance include supportive government policies promoting agricultural productivity, substantial investments in modern farming equipment, and a strong emphasis on precision agriculture. The prevalence of large-scale farming operations necessitates robust and reliable tires that can withstand demanding conditions and long operating hours.
Within the Types of tires, Radial Tires are progressively gaining market share, projected to capture 65% of the market by 2025, surpassing Bias Tires. This shift is driven by their superior performance, including better traction, reduced soil compaction, improved fuel efficiency, and longer lifespan, all of which contribute to higher operational efficiency and cost savings for farmers.
- Dominant Application Segment: Tractors (estimated 45% market share in 2025) – essential for a wide range of farm operations.
- Leading Region: North America, with the United States as a key market (projected $2,200 million in 2025).
- Key Drivers in the US: Extensive agricultural land, advanced mechanization, supportive government policies, and precision farming adoption.
- Dominant Tire Type: Radial Tires (projected 65% market share in 2025) – offering superior performance and durability.
- Other Significant Segments: Combine Harvesters and Trailers also contribute significantly to market demand.
Agricultural and Forestry Tires Product Landscape
The Agricultural and Forestry Tires market is characterized by continuous product innovation focused on enhancing durability, performance, and sustainability. Key advancements include the development of specialized tread patterns for improved grip on diverse terrains and reduced soil compaction, innovative rubber compounds for extended wear life and resistance to punctures, and the growing integration of radial tire technology offering superior flotation and reduced heat buildup. Michelin's AxioBib and Bridgestone's VT-Tractor series exemplify the sophisticated radial tire offerings. Furthermore, manufacturers are exploring eco-friendly materials and manufacturing processes to align with growing environmental concerns.
- Product Innovations: Advanced tread designs, durable rubber compounds, and enhanced radial constructions.
- Performance Metrics: Focus on traction, flotation, fuel efficiency, and puncture resistance.
- Unique Selling Propositions: Extended lifespan, reduced environmental impact, and optimized performance for specific agricultural and forestry applications.
- Technological Advancements: Increased adoption of radial technology, development of self-cleaning tread patterns, and exploration of sustainable materials.
Key Drivers, Barriers & Challenges in Agricultural and Forestry Tires
Key Drivers:
- Increasing Mechanization of Agriculture: Growing demand for advanced machinery globally, especially in emerging economies, fuels tire demand.
- Technological Advancements: Innovations in radial tire technology and tread designs enhance efficiency and durability.
- Government Support and Subsidies: Policies promoting agricultural modernization and efficiency indirectly boost tire sales.
- Rising Food Demand: A growing global population necessitates increased agricultural output, driving the need for more productive farming practices and equipment.
Key Barriers & Challenges:
- High Manufacturing Costs: Specialized materials and complex production processes can lead to higher tire prices.
- Fluctuating Raw Material Prices: Volatility in rubber and petrochemical prices impacts production costs and profit margins.
- Economic Downturns: Reduced disposable income for farmers during economic slumps can lead to delayed equipment and tire purchases.
- Counterfeit Products: The presence of counterfeit tires poses a threat to market integrity and brand reputation.
- Supply Chain Disruptions: Geopolitical events and logistical challenges can impact the availability of raw materials and finished goods, with potential delays of 4-8 weeks and cost increases of 10-20% impacting global distribution.
Emerging Opportunities in Agricultural and Forestry Tires
Emerging opportunities in the Agricultural and Forestry Tires sector lie in the development of "smart tires" equipped with sensors for real-time performance monitoring, tire pressure management, and predictive maintenance. The growing adoption of precision agriculture creates demand for specialized, low-compaction tires that minimize soil disturbance. Furthermore, the increasing focus on sustainability and circular economy principles presents opportunities for manufacturers to develop tires using recycled materials and implement tire retreading and recycling programs. The expansion of forestry operations in regions like Southeast Asia and South America also offers untapped market potential for specialized forestry tires.
- Smart Tire Technology: Integration of sensors for performance monitoring and data analytics.
- Precision Agriculture Solutions: Demand for low-compaction and highly maneuverable tires.
- Sustainable Materials and Processes: Development of eco-friendly tires and circular economy initiatives.
- Emerging Market Expansion: Tapping into the growing agricultural and forestry sectors in Asia-Pacific and Latin America.
Growth Accelerators in the Agricultural and Forestry Tires Industry
The Agricultural and Forestry Tires industry is propelled by significant growth accelerators. Technological breakthroughs in radial tire design, such as self-supporting sidewall technology and advanced tread compounds, are continually enhancing tire performance, fuel efficiency, and longevity, directly impacting farmer profitability. Strategic partnerships and collaborations between tire manufacturers and agricultural equipment OEMs (Original Equipment Manufacturers) ensure that tires are optimized for new machinery models, accelerating adoption and market penetration. Furthermore, government initiatives and incentives aimed at modernizing agricultural practices and promoting sustainable land management actively stimulate demand for advanced and efficient tire solutions. The growing global focus on food security will also continue to drive investments in agricultural productivity, a key factor for sustained growth.
- Technological Breakthroughs: Innovations in radial tire design and material science.
- Strategic Partnerships: Collaborations with agricultural equipment manufacturers.
- Government Initiatives: Policies supporting agricultural modernization and sustainability.
- Global Food Security: Increased demand for agricultural productivity.
Key Players Shaping the Agricultural and Forestry Tires Market
- Michelin
- Bridgestone
- McCreary Tire and Rubber
- Continental
- Carlisle Companies
- Titan International
- Trelleborg
- Yokohama Tire
- Nokian
- Apollo Tyres
- Cooper Tire
- Goodyear
- Balkrishna lndustries Limited
- TUTRIC
- BKT
- Guizhou Tyre
- Taishan Tyre
- Shandong Zhentai
- Xugong Tyres
- Alliance Tyre Group
- Firestone
- Harvest King Tires
- Mitas Tires
- Double Coin
- CEAT
- Qingdao Qizhou Rubber
Notable Milestones in Agricultural and Forestry Tires Sector
- 2019: Michelin launches the Xarion family of tires, offering advanced radial technology for high-horsepower tractors.
- 2020: Trelleborg invests in expanding its production capacity for agricultural tires in Europe.
- 2021: Titan International acquires Firestone's agricultural tire business, strengthening its market position.
- 2022: Bridgestone introduces new VT-Tractor tires with improved soil protection and fuel efficiency.
- 2023: Apollo Tyres expands its Vredestein brand offerings for specialized agricultural applications.
- 2024: Goodyear announces advancements in sustainable rubber compounds for its agricultural tire lines.
In-Depth Agricultural and Forestry Tires Market Outlook
The Agricultural and Forestry Tires market is on an upward trajectory, driven by a synergistic interplay of technological innovation, increasing global agricultural demands, and evolving sustainability imperatives. The projected market growth of approximately 5.5% CAGR from 2025 to 2033 highlights a robust future for manufacturers and suppliers. Strategic opportunities lie in capitalizing on the growing adoption of smart tire technology and precision agriculture solutions, which will redefine operational efficiency. Furthermore, the increasing emphasis on environmental responsibility presents a fertile ground for developing and marketing eco-friendly tire options and robust recycling programs. Companies that can effectively navigate the evolving regulatory landscape and consistently deliver high-performance, durable, and sustainable tire solutions will be best positioned to thrive in this dynamic market.
Agricultural and Forestry Tires Segmentation
-
1. Application
- 1.1. Tractors
- 1.2. Combine Harvester
- 1.3. Sprayer
- 1.4. Trailers
- 1.5. Compact line
- 1.6. Others
-
2. Types
- 2.1. Bias Tires
- 2.2. Radial Tires
Agricultural and Forestry Tires Segmentation By Geography
-
1. North America
- 1.1. United States
- 1.2. Canada
- 1.3. Mexico
-
2. South America
- 2.1. Brazil
- 2.2. Argentina
- 2.3. Rest of South America
-
3. Europe
- 3.1. United Kingdom
- 3.2. Germany
- 3.3. France
- 3.4. Italy
- 3.5. Spain
- 3.6. Russia
- 3.7. Benelux
- 3.8. Nordics
- 3.9. Rest of Europe
-
4. Middle East & Africa
- 4.1. Turkey
- 4.2. Israel
- 4.3. GCC
- 4.4. North Africa
- 4.5. South Africa
- 4.6. Rest of Middle East & Africa
-
5. Asia Pacific
- 5.1. China
- 5.2. India
- 5.3. Japan
- 5.4. South Korea
- 5.5. ASEAN
- 5.6. Oceania
- 5.7. Rest of Asia Pacific
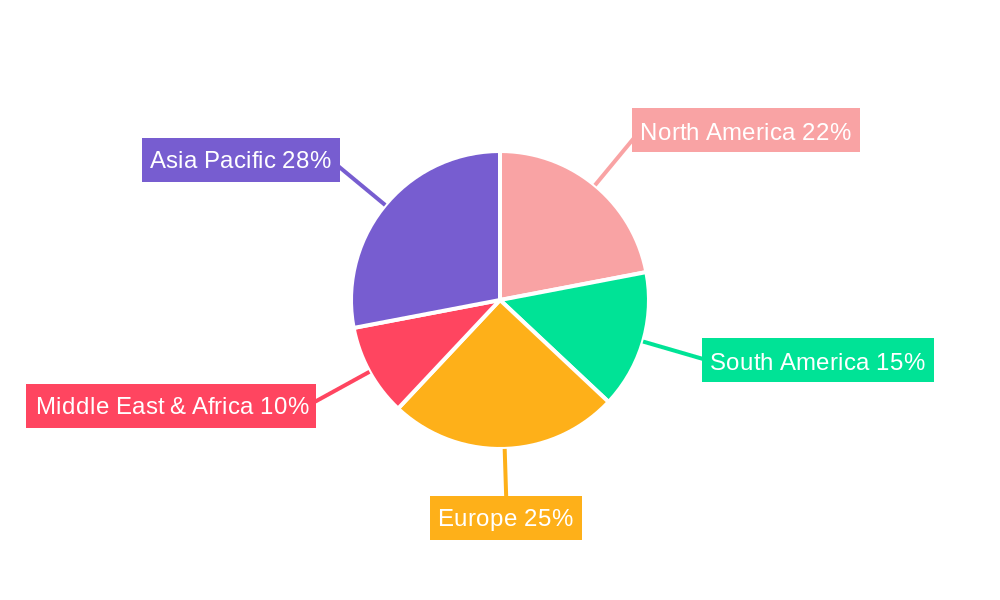
Agricultural and Forestry Tires Regional Market Share
Geographic Coverage of Agricultural and Forestry Tires
Agricultural and Forestry Tires REPORT HIGHLIGHTS
| Aspects | Details |
|---|---|
| Study Period | 2020-2034 |
| Base Year | 2025 |
| Estimated Year | 2026 |
| Forecast Period | 2026-2034 |
| Historical Period | 2020-2025 |
| Growth Rate | CAGR of 4.8% from 2020-2034 |
| Segmentation |
|
Table of Contents
- 1. Introduction
- 1.1. Research Scope
- 1.2. Market Segmentation
- 1.3. Research Objective
- 1.4. Definitions and Assumptions
- 2. Executive Summary
- 2.1. Market Snapshot
- 3. Market Dynamics
- 3.1. Market Drivers
- 3.2. Market Restrains
- 3.3. Market Trends
- 3.4. Market Opportunities
- 4. Market Factor Analysis
- 4.1. Porters Five Forces
- 4.1.1. Bargaining Power of Suppliers
- 4.1.2. Bargaining Power of Buyers
- 4.1.3. Threat of New Entrants
- 4.1.4. Threat of Substitutes
- 4.1.5. Competitive Rivalry
- 4.2. PESTEL analysis
- 4.3. BCG Analysis
- 4.3.1. Stars (High Growth, High Market Share)
- 4.3.2. Cash Cows (Low Growth, High Market Share)
- 4.3.3. Question Mark (High Growth, Low Market Share)
- 4.3.4. Dogs (Low Growth, Low Market Share)
- 4.4. Ansoff Matrix Analysis
- 4.5. Supply Chain Analysis
- 4.6. Regulatory Landscape
- 4.7. Current Market Potential and Opportunity Assessment (TAM–SAM–SOM Framework)
- 4.8. IMR Analyst Note
- 4.1. Porters Five Forces
- 5. Market Analysis, Insights and Forecast 2021-2033
- 5.1. Market Analysis, Insights and Forecast - by Application
- 5.1.1. Tractors
- 5.1.2. Combine Harvester
- 5.1.3. Sprayer
- 5.1.4. Trailers
- 5.1.5. Compact line
- 5.1.6. Others
- 5.2. Market Analysis, Insights and Forecast - by Types
- 5.2.1. Bias Tires
- 5.2.2. Radial Tires
- 5.3. Market Analysis, Insights and Forecast - by Region
- 5.3.1. North America
- 5.3.2. South America
- 5.3.3. Europe
- 5.3.4. Middle East & Africa
- 5.3.5. Asia Pacific
- 5.1. Market Analysis, Insights and Forecast - by Application
- 6. Global Agricultural and Forestry Tires Analysis, Insights and Forecast, 2021-2033
- 6.1. Market Analysis, Insights and Forecast - by Application
- 6.1.1. Tractors
- 6.1.2. Combine Harvester
- 6.1.3. Sprayer
- 6.1.4. Trailers
- 6.1.5. Compact line
- 6.1.6. Others
- 6.2. Market Analysis, Insights and Forecast - by Types
- 6.2.1. Bias Tires
- 6.2.2. Radial Tires
- 6.1. Market Analysis, Insights and Forecast - by Application
- 7. North America Agricultural and Forestry Tires Analysis, Insights and Forecast, 2020-2032
- 7.1. Market Analysis, Insights and Forecast - by Application
- 7.1.1. Tractors
- 7.1.2. Combine Harvester
- 7.1.3. Sprayer
- 7.1.4. Trailers
- 7.1.5. Compact line
- 7.1.6. Others
- 7.2. Market Analysis, Insights and Forecast - by Types
- 7.2.1. Bias Tires
- 7.2.2. Radial Tires
- 7.1. Market Analysis, Insights and Forecast - by Application
- 8. South America Agricultural and Forestry Tires Analysis, Insights and Forecast, 2020-2032
- 8.1. Market Analysis, Insights and Forecast - by Application
- 8.1.1. Tractors
- 8.1.2. Combine Harvester
- 8.1.3. Sprayer
- 8.1.4. Trailers
- 8.1.5. Compact line
- 8.1.6. Others
- 8.2. Market Analysis, Insights and Forecast - by Types
- 8.2.1. Bias Tires
- 8.2.2. Radial Tires
- 8.1. Market Analysis, Insights and Forecast - by Application
- 9. Europe Agricultural and Forestry Tires Analysis, Insights and Forecast, 2020-2032
- 9.1. Market Analysis, Insights and Forecast - by Application
- 9.1.1. Tractors
- 9.1.2. Combine Harvester
- 9.1.3. Sprayer
- 9.1.4. Trailers
- 9.1.5. Compact line
- 9.1.6. Others
- 9.2. Market Analysis, Insights and Forecast - by Types
- 9.2.1. Bias Tires
- 9.2.2. Radial Tires
- 9.1. Market Analysis, Insights and Forecast - by Application
- 10. Middle East & Africa Agricultural and Forestry Tires Analysis, Insights and Forecast, 2020-2032
- 10.1. Market Analysis, Insights and Forecast - by Application
- 10.1.1. Tractors
- 10.1.2. Combine Harvester
- 10.1.3. Sprayer
- 10.1.4. Trailers
- 10.1.5. Compact line
- 10.1.6. Others
- 10.2. Market Analysis, Insights and Forecast - by Types
- 10.2.1. Bias Tires
- 10.2.2. Radial Tires
- 10.1. Market Analysis, Insights and Forecast - by Application
- 11. Asia Pacific Agricultural and Forestry Tires Analysis, Insights and Forecast, 2020-2032
- 11.1. Market Analysis, Insights and Forecast - by Application
- 11.1.1. Tractors
- 11.1.2. Combine Harvester
- 11.1.3. Sprayer
- 11.1.4. Trailers
- 11.1.5. Compact line
- 11.1.6. Others
- 11.2. Market Analysis, Insights and Forecast - by Types
- 11.2.1. Bias Tires
- 11.2.2. Radial Tires
- 11.1. Market Analysis, Insights and Forecast - by Application
- 12. Competitive Analysis
- 12.1. Company Profiles
- 12.1.1 Michelin
- 12.1.1.1. Company Overview
- 12.1.1.2. Products
- 12.1.1.3. Company Financials
- 12.1.1.4. SWOT Analysis
- 12.1.2 Bridgestone
- 12.1.2.1. Company Overview
- 12.1.2.2. Products
- 12.1.2.3. Company Financials
- 12.1.2.4. SWOT Analysis
- 12.1.3 McCreary Tire and Rubber
- 12.1.3.1. Company Overview
- 12.1.3.2. Products
- 12.1.3.3. Company Financials
- 12.1.3.4. SWOT Analysis
- 12.1.4 Continental
- 12.1.4.1. Company Overview
- 12.1.4.2. Products
- 12.1.4.3. Company Financials
- 12.1.4.4. SWOT Analysis
- 12.1.5 Carlisle Companies
- 12.1.5.1. Company Overview
- 12.1.5.2. Products
- 12.1.5.3. Company Financials
- 12.1.5.4. SWOT Analysis
- 12.1.6 Titan International
- 12.1.6.1. Company Overview
- 12.1.6.2. Products
- 12.1.6.3. Company Financials
- 12.1.6.4. SWOT Analysis
- 12.1.7 Trelleborg
- 12.1.7.1. Company Overview
- 12.1.7.2. Products
- 12.1.7.3. Company Financials
- 12.1.7.4. SWOT Analysis
- 12.1.8 Yokohama Tire
- 12.1.8.1. Company Overview
- 12.1.8.2. Products
- 12.1.8.3. Company Financials
- 12.1.8.4. SWOT Analysis
- 12.1.9 Nokian
- 12.1.9.1. Company Overview
- 12.1.9.2. Products
- 12.1.9.3. Company Financials
- 12.1.9.4. SWOT Analysis
- 12.1.10 Apollo Tyres
- 12.1.10.1. Company Overview
- 12.1.10.2. Products
- 12.1.10.3. Company Financials
- 12.1.10.4. SWOT Analysis
- 12.1.11 Cooper Tire
- 12.1.11.1. Company Overview
- 12.1.11.2. Products
- 12.1.11.3. Company Financials
- 12.1.11.4. SWOT Analysis
- 12.1.12 Goodyear
- 12.1.12.1. Company Overview
- 12.1.12.2. Products
- 12.1.12.3. Company Financials
- 12.1.12.4. SWOT Analysis
- 12.1.13 Balkrishna lndustries Limited
- 12.1.13.1. Company Overview
- 12.1.13.2. Products
- 12.1.13.3. Company Financials
- 12.1.13.4. SWOT Analysis
- 12.1.14 TUTRIC
- 12.1.14.1. Company Overview
- 12.1.14.2. Products
- 12.1.14.3. Company Financials
- 12.1.14.4. SWOT Analysis
- 12.1.15 BKT
- 12.1.15.1. Company Overview
- 12.1.15.2. Products
- 12.1.15.3. Company Financials
- 12.1.15.4. SWOT Analysis
- 12.1.16 Guizhou Tyre
- 12.1.16.1. Company Overview
- 12.1.16.2. Products
- 12.1.16.3. Company Financials
- 12.1.16.4. SWOT Analysis
- 12.1.17 Taishan Tyre
- 12.1.17.1. Company Overview
- 12.1.17.2. Products
- 12.1.17.3. Company Financials
- 12.1.17.4. SWOT Analysis
- 12.1.18 Shandong Zhentai
- 12.1.18.1. Company Overview
- 12.1.18.2. Products
- 12.1.18.3. Company Financials
- 12.1.18.4. SWOT Analysis
- 12.1.19 Xugong Tyres
- 12.1.19.1. Company Overview
- 12.1.19.2. Products
- 12.1.19.3. Company Financials
- 12.1.19.4. SWOT Analysis
- 12.1.20 Alliance Tyre Group
- 12.1.20.1. Company Overview
- 12.1.20.2. Products
- 12.1.20.3. Company Financials
- 12.1.20.4. SWOT Analysis
- 12.1.21 Firestone
- 12.1.21.1. Company Overview
- 12.1.21.2. Products
- 12.1.21.3. Company Financials
- 12.1.21.4. SWOT Analysis
- 12.1.22 Harvest King Tires
- 12.1.22.1. Company Overview
- 12.1.22.2. Products
- 12.1.22.3. Company Financials
- 12.1.22.4. SWOT Analysis
- 12.1.23 Mitas Tires
- 12.1.23.1. Company Overview
- 12.1.23.2. Products
- 12.1.23.3. Company Financials
- 12.1.23.4. SWOT Analysis
- 12.1.24 Double Coin
- 12.1.24.1. Company Overview
- 12.1.24.2. Products
- 12.1.24.3. Company Financials
- 12.1.24.4. SWOT Analysis
- 12.1.25 CEAT
- 12.1.25.1. Company Overview
- 12.1.25.2. Products
- 12.1.25.3. Company Financials
- 12.1.25.4. SWOT Analysis
- 12.1.26 Qingdao Qizhou Rubber
- 12.1.26.1. Company Overview
- 12.1.26.2. Products
- 12.1.26.3. Company Financials
- 12.1.26.4. SWOT Analysis
- 12.1.1 Michelin
- 12.2. Market Entropy
- 12.2.1 Company's Key Areas Served
- 12.2.2 Recent Developments
- 12.3. Company Market Share Analysis 2025
- 12.3.1 Top 5 Companies Market Share Analysis
- 12.3.2 Top 3 Companies Market Share Analysis
- 12.4. List of Potential Customers
- 13. Research Methodology
List of Figures
- Figure 1: Global Agricultural and Forestry Tires Revenue Breakdown (million, %) by Region 2025 & 2033
- Figure 2: Global Agricultural and Forestry Tires Volume Breakdown (K, %) by Region 2025 & 2033
- Figure 3: North America Agricultural and Forestry Tires Revenue (million), by Application 2025 & 2033
- Figure 4: North America Agricultural and Forestry Tires Volume (K), by Application 2025 & 2033
- Figure 5: North America Agricultural and Forestry Tires Revenue Share (%), by Application 2025 & 2033
- Figure 6: North America Agricultural and Forestry Tires Volume Share (%), by Application 2025 & 2033
- Figure 7: North America Agricultural and Forestry Tires Revenue (million), by Types 2025 & 2033
- Figure 8: North America Agricultural and Forestry Tires Volume (K), by Types 2025 & 2033
- Figure 9: North America Agricultural and Forestry Tires Revenue Share (%), by Types 2025 & 2033
- Figure 10: North America Agricultural and Forestry Tires Volume Share (%), by Types 2025 & 2033
- Figure 11: North America Agricultural and Forestry Tires Revenue (million), by Country 2025 & 2033
- Figure 12: North America Agricultural and Forestry Tires Volume (K), by Country 2025 & 2033
- Figure 13: North America Agricultural and Forestry Tires Revenue Share (%), by Country 2025 & 2033
- Figure 14: North America Agricultural and Forestry Tires Volume Share (%), by Country 2025 & 2033
- Figure 15: South America Agricultural and Forestry Tires Revenue (million), by Application 2025 & 2033
- Figure 16: South America Agricultural and Forestry Tires Volume (K), by Application 2025 & 2033
- Figure 17: South America Agricultural and Forestry Tires Revenue Share (%), by Application 2025 & 2033
- Figure 18: South America Agricultural and Forestry Tires Volume Share (%), by Application 2025 & 2033
- Figure 19: South America Agricultural and Forestry Tires Revenue (million), by Types 2025 & 2033
- Figure 20: South America Agricultural and Forestry Tires Volume (K), by Types 2025 & 2033
- Figure 21: South America Agricultural and Forestry Tires Revenue Share (%), by Types 2025 & 2033
- Figure 22: South America Agricultural and Forestry Tires Volume Share (%), by Types 2025 & 2033
- Figure 23: South America Agricultural and Forestry Tires Revenue (million), by Country 2025 & 2033
- Figure 24: South America Agricultural and Forestry Tires Volume (K), by Country 2025 & 2033
- Figure 25: South America Agricultural and Forestry Tires Revenue Share (%), by Country 2025 & 2033
- Figure 26: South America Agricultural and Forestry Tires Volume Share (%), by Country 2025 & 2033
- Figure 27: Europe Agricultural and Forestry Tires Revenue (million), by Application 2025 & 2033
- Figure 28: Europe Agricultural and Forestry Tires Volume (K), by Application 2025 & 2033
- Figure 29: Europe Agricultural and Forestry Tires Revenue Share (%), by Application 2025 & 2033
- Figure 30: Europe Agricultural and Forestry Tires Volume Share (%), by Application 2025 & 2033
- Figure 31: Europe Agricultural and Forestry Tires Revenue (million), by Types 2025 & 2033
- Figure 32: Europe Agricultural and Forestry Tires Volume (K), by Types 2025 & 2033
- Figure 33: Europe Agricultural and Forestry Tires Revenue Share (%), by Types 2025 & 2033
- Figure 34: Europe Agricultural and Forestry Tires Volume Share (%), by Types 2025 & 2033
- Figure 35: Europe Agricultural and Forestry Tires Revenue (million), by Country 2025 & 2033
- Figure 36: Europe Agricultural and Forestry Tires Volume (K), by Country 2025 & 2033
- Figure 37: Europe Agricultural and Forestry Tires Revenue Share (%), by Country 2025 & 2033
- Figure 38: Europe Agricultural and Forestry Tires Volume Share (%), by Country 2025 & 2033
- Figure 39: Middle East & Africa Agricultural and Forestry Tires Revenue (million), by Application 2025 & 2033
- Figure 40: Middle East & Africa Agricultural and Forestry Tires Volume (K), by Application 2025 & 2033
- Figure 41: Middle East & Africa Agricultural and Forestry Tires Revenue Share (%), by Application 2025 & 2033
- Figure 42: Middle East & Africa Agricultural and Forestry Tires Volume Share (%), by Application 2025 & 2033
- Figure 43: Middle East & Africa Agricultural and Forestry Tires Revenue (million), by Types 2025 & 2033
- Figure 44: Middle East & Africa Agricultural and Forestry Tires Volume (K), by Types 2025 & 2033
- Figure 45: Middle East & Africa Agricultural and Forestry Tires Revenue Share (%), by Types 2025 & 2033
- Figure 46: Middle East & Africa Agricultural and Forestry Tires Volume Share (%), by Types 2025 & 2033
- Figure 47: Middle East & Africa Agricultural and Forestry Tires Revenue (million), by Country 2025 & 2033
- Figure 48: Middle East & Africa Agricultural and Forestry Tires Volume (K), by Country 2025 & 2033
- Figure 49: Middle East & Africa Agricultural and Forestry Tires Revenue Share (%), by Country 2025 & 2033
- Figure 50: Middle East & Africa Agricultural and Forestry Tires Volume Share (%), by Country 2025 & 2033
- Figure 51: Asia Pacific Agricultural and Forestry Tires Revenue (million), by Application 2025 & 2033
- Figure 52: Asia Pacific Agricultural and Forestry Tires Volume (K), by Application 2025 & 2033
- Figure 53: Asia Pacific Agricultural and Forestry Tires Revenue Share (%), by Application 2025 & 2033
- Figure 54: Asia Pacific Agricultural and Forestry Tires Volume Share (%), by Application 2025 & 2033
- Figure 55: Asia Pacific Agricultural and Forestry Tires Revenue (million), by Types 2025 & 2033
- Figure 56: Asia Pacific Agricultural and Forestry Tires Volume (K), by Types 2025 & 2033
- Figure 57: Asia Pacific Agricultural and Forestry Tires Revenue Share (%), by Types 2025 & 2033
- Figure 58: Asia Pacific Agricultural and Forestry Tires Volume Share (%), by Types 2025 & 2033
- Figure 59: Asia Pacific Agricultural and Forestry Tires Revenue (million), by Country 2025 & 2033
- Figure 60: Asia Pacific Agricultural and Forestry Tires Volume (K), by Country 2025 & 2033
- Figure 61: Asia Pacific Agricultural and Forestry Tires Revenue Share (%), by Country 2025 & 2033
- Figure 62: Asia Pacific Agricultural and Forestry Tires Volume Share (%), by Country 2025 & 2033
List of Tables
- Table 1: Global Agricultural and Forestry Tires Revenue million Forecast, by Application 2020 & 2033
- Table 2: Global Agricultural and Forestry Tires Volume K Forecast, by Application 2020 & 2033
- Table 3: Global Agricultural and Forestry Tires Revenue million Forecast, by Types 2020 & 2033
- Table 4: Global Agricultural and Forestry Tires Volume K Forecast, by Types 2020 & 2033
- Table 5: Global Agricultural and Forestry Tires Revenue million Forecast, by Region 2020 & 2033
- Table 6: Global Agricultural and Forestry Tires Volume K Forecast, by Region 2020 & 2033
- Table 7: Global Agricultural and Forestry Tires Revenue million Forecast, by Application 2020 & 2033
- Table 8: Global Agricultural and Forestry Tires Volume K Forecast, by Application 2020 & 2033
- Table 9: Global Agricultural and Forestry Tires Revenue million Forecast, by Types 2020 & 2033
- Table 10: Global Agricultural and Forestry Tires Volume K Forecast, by Types 2020 & 2033
- Table 11: Global Agricultural and Forestry Tires Revenue million Forecast, by Country 2020 & 2033
- Table 12: Global Agricultural and Forestry Tires Volume K Forecast, by Country 2020 & 2033
- Table 13: United States Agricultural and Forestry Tires Revenue (million) Forecast, by Application 2020 & 2033
- Table 14: United States Agricultural and Forestry Tires Volume (K) Forecast, by Application 2020 & 2033
- Table 15: Canada Agricultural and Forestry Tires Revenue (million) Forecast, by Application 2020 & 2033
- Table 16: Canada Agricultural and Forestry Tires Volume (K) Forecast, by Application 2020 & 2033
- Table 17: Mexico Agricultural and Forestry Tires Revenue (million) Forecast, by Application 2020 & 2033
- Table 18: Mexico Agricultural and Forestry Tires Volume (K) Forecast, by Application 2020 & 2033
- Table 19: Global Agricultural and Forestry Tires Revenue million Forecast, by Application 2020 & 2033
- Table 20: Global Agricultural and Forestry Tires Volume K Forecast, by Application 2020 & 2033
- Table 21: Global Agricultural and Forestry Tires Revenue million Forecast, by Types 2020 & 2033
- Table 22: Global Agricultural and Forestry Tires Volume K Forecast, by Types 2020 & 2033
- Table 23: Global Agricultural and Forestry Tires Revenue million Forecast, by Country 2020 & 2033
- Table 24: Global Agricultural and Forestry Tires Volume K Forecast, by Country 2020 & 2033
- Table 25: Brazil Agricultural and Forestry Tires Revenue (million) Forecast, by Application 2020 & 2033
- Table 26: Brazil Agricultural and Forestry Tires Volume (K) Forecast, by Application 2020 & 2033
- Table 27: Argentina Agricultural and Forestry Tires Revenue (million) Forecast, by Application 2020 & 2033
- Table 28: Argentina Agricultural and Forestry Tires Volume (K) Forecast, by Application 2020 & 2033
- Table 29: Rest of South America Agricultural and Forestry Tires Revenue (million) Forecast, by Application 2020 & 2033
- Table 30: Rest of South America Agricultural and Forestry Tires Volume (K) Forecast, by Application 2020 & 2033
- Table 31: Global Agricultural and Forestry Tires Revenue million Forecast, by Application 2020 & 2033
- Table 32: Global Agricultural and Forestry Tires Volume K Forecast, by Application 2020 & 2033
- Table 33: Global Agricultural and Forestry Tires Revenue million Forecast, by Types 2020 & 2033
- Table 34: Global Agricultural and Forestry Tires Volume K Forecast, by Types 2020 & 2033
- Table 35: Global Agricultural and Forestry Tires Revenue million Forecast, by Country 2020 & 2033
- Table 36: Global Agricultural and Forestry Tires Volume K Forecast, by Country 2020 & 2033
- Table 37: United Kingdom Agricultural and Forestry Tires Revenue (million) Forecast, by Application 2020 & 2033
- Table 38: United Kingdom Agricultural and Forestry Tires Volume (K) Forecast, by Application 2020 & 2033
- Table 39: Germany Agricultural and Forestry Tires Revenue (million) Forecast, by Application 2020 & 2033
- Table 40: Germany Agricultural and Forestry Tires Volume (K) Forecast, by Application 2020 & 2033
- Table 41: France Agricultural and Forestry Tires Revenue (million) Forecast, by Application 2020 & 2033
- Table 42: France Agricultural and Forestry Tires Volume (K) Forecast, by Application 2020 & 2033
- Table 43: Italy Agricultural and Forestry Tires Revenue (million) Forecast, by Application 2020 & 2033
- Table 44: Italy Agricultural and Forestry Tires Volume (K) Forecast, by Application 2020 & 2033
- Table 45: Spain Agricultural and Forestry Tires Revenue (million) Forecast, by Application 2020 & 2033
- Table 46: Spain Agricultural and Forestry Tires Volume (K) Forecast, by Application 2020 & 2033
- Table 47: Russia Agricultural and Forestry Tires Revenue (million) Forecast, by Application 2020 & 2033
- Table 48: Russia Agricultural and Forestry Tires Volume (K) Forecast, by Application 2020 & 2033
- Table 49: Benelux Agricultural and Forestry Tires Revenue (million) Forecast, by Application 2020 & 2033
- Table 50: Benelux Agricultural and Forestry Tires Volume (K) Forecast, by Application 2020 & 2033
- Table 51: Nordics Agricultural and Forestry Tires Revenue (million) Forecast, by Application 2020 & 2033
- Table 52: Nordics Agricultural and Forestry Tires Volume (K) Forecast, by Application 2020 & 2033
- Table 53: Rest of Europe Agricultural and Forestry Tires Revenue (million) Forecast, by Application 2020 & 2033
- Table 54: Rest of Europe Agricultural and Forestry Tires Volume (K) Forecast, by Application 2020 & 2033
- Table 55: Global Agricultural and Forestry Tires Revenue million Forecast, by Application 2020 & 2033
- Table 56: Global Agricultural and Forestry Tires Volume K Forecast, by Application 2020 & 2033
- Table 57: Global Agricultural and Forestry Tires Revenue million Forecast, by Types 2020 & 2033
- Table 58: Global Agricultural and Forestry Tires Volume K Forecast, by Types 2020 & 2033
- Table 59: Global Agricultural and Forestry Tires Revenue million Forecast, by Country 2020 & 2033
- Table 60: Global Agricultural and Forestry Tires Volume K Forecast, by Country 2020 & 2033
- Table 61: Turkey Agricultural and Forestry Tires Revenue (million) Forecast, by Application 2020 & 2033
- Table 62: Turkey Agricultural and Forestry Tires Volume (K) Forecast, by Application 2020 & 2033
- Table 63: Israel Agricultural and Forestry Tires Revenue (million) Forecast, by Application 2020 & 2033
- Table 64: Israel Agricultural and Forestry Tires Volume (K) Forecast, by Application 2020 & 2033
- Table 65: GCC Agricultural and Forestry Tires Revenue (million) Forecast, by Application 2020 & 2033
- Table 66: GCC Agricultural and Forestry Tires Volume (K) Forecast, by Application 2020 & 2033
- Table 67: North Africa Agricultural and Forestry Tires Revenue (million) Forecast, by Application 2020 & 2033
- Table 68: North Africa Agricultural and Forestry Tires Volume (K) Forecast, by Application 2020 & 2033
- Table 69: South Africa Agricultural and Forestry Tires Revenue (million) Forecast, by Application 2020 & 2033
- Table 70: South Africa Agricultural and Forestry Tires Volume (K) Forecast, by Application 2020 & 2033
- Table 71: Rest of Middle East & Africa Agricultural and Forestry Tires Revenue (million) Forecast, by Application 2020 & 2033
- Table 72: Rest of Middle East & Africa Agricultural and Forestry Tires Volume (K) Forecast, by Application 2020 & 2033
- Table 73: Global Agricultural and Forestry Tires Revenue million Forecast, by Application 2020 & 2033
- Table 74: Global Agricultural and Forestry Tires Volume K Forecast, by Application 2020 & 2033
- Table 75: Global Agricultural and Forestry Tires Revenue million Forecast, by Types 2020 & 2033
- Table 76: Global Agricultural and Forestry Tires Volume K Forecast, by Types 2020 & 2033
- Table 77: Global Agricultural and Forestry Tires Revenue million Forecast, by Country 2020 & 2033
- Table 78: Global Agricultural and Forestry Tires Volume K Forecast, by Country 2020 & 2033
- Table 79: China Agricultural and Forestry Tires Revenue (million) Forecast, by Application 2020 & 2033
- Table 80: China Agricultural and Forestry Tires Volume (K) Forecast, by Application 2020 & 2033
- Table 81: India Agricultural and Forestry Tires Revenue (million) Forecast, by Application 2020 & 2033
- Table 82: India Agricultural and Forestry Tires Volume (K) Forecast, by Application 2020 & 2033
- Table 83: Japan Agricultural and Forestry Tires Revenue (million) Forecast, by Application 2020 & 2033
- Table 84: Japan Agricultural and Forestry Tires Volume (K) Forecast, by Application 2020 & 2033
- Table 85: South Korea Agricultural and Forestry Tires Revenue (million) Forecast, by Application 2020 & 2033
- Table 86: South Korea Agricultural and Forestry Tires Volume (K) Forecast, by Application 2020 & 2033
- Table 87: ASEAN Agricultural and Forestry Tires Revenue (million) Forecast, by Application 2020 & 2033
- Table 88: ASEAN Agricultural and Forestry Tires Volume (K) Forecast, by Application 2020 & 2033
- Table 89: Oceania Agricultural and Forestry Tires Revenue (million) Forecast, by Application 2020 & 2033
- Table 90: Oceania Agricultural and Forestry Tires Volume (K) Forecast, by Application 2020 & 2033
- Table 91: Rest of Asia Pacific Agricultural and Forestry Tires Revenue (million) Forecast, by Application 2020 & 2033
- Table 92: Rest of Asia Pacific Agricultural and Forestry Tires Volume (K) Forecast, by Application 2020 & 2033
Frequently Asked Questions
1. What is the projected Compound Annual Growth Rate (CAGR) of the Agricultural and Forestry Tires?
The projected CAGR is approximately 4.8%.
2. Which companies are prominent players in the Agricultural and Forestry Tires?
Key companies in the market include Michelin, Bridgestone, McCreary Tire and Rubber, Continental, Carlisle Companies, Titan International, Trelleborg, Yokohama Tire, Nokian, Apollo Tyres, Cooper Tire, Goodyear, Balkrishna lndustries Limited, TUTRIC, BKT, Guizhou Tyre, Taishan Tyre, Shandong Zhentai, Xugong Tyres, Alliance Tyre Group, Firestone, Harvest King Tires, Mitas Tires, Double Coin, CEAT, Qingdao Qizhou Rubber.
3. What are the main segments of the Agricultural and Forestry Tires?
The market segments include Application, Types.
4. Can you provide details about the market size?
The market size is estimated to be USD 444.94 million as of 2022.
5. What are some drivers contributing to market growth?
N/A
6. What are the notable trends driving market growth?
N/A
7. Are there any restraints impacting market growth?
N/A
8. Can you provide examples of recent developments in the market?
N/A
9. What pricing options are available for accessing the report?
Pricing options include single-user, multi-user, and enterprise licenses priced at USD 4350.00, USD 6525.00, and USD 8700.00 respectively.
10. Is the market size provided in terms of value or volume?
The market size is provided in terms of value, measured in million and volume, measured in K.
11. Are there any specific market keywords associated with the report?
Yes, the market keyword associated with the report is "Agricultural and Forestry Tires," which aids in identifying and referencing the specific market segment covered.
12. How do I determine which pricing option suits my needs best?
The pricing options vary based on user requirements and access needs. Individual users may opt for single-user licenses, while businesses requiring broader access may choose multi-user or enterprise licenses for cost-effective access to the report.
13. Are there any additional resources or data provided in the Agricultural and Forestry Tires report?
While the report offers comprehensive insights, it's advisable to review the specific contents or supplementary materials provided to ascertain if additional resources or data are available.
14. How can I stay updated on further developments or reports in the Agricultural and Forestry Tires?
To stay informed about further developments, trends, and reports in the Agricultural and Forestry Tires, consider subscribing to industry newsletters, following relevant companies and organizations, or regularly checking reputable industry news sources and publications.
Methodology
Step 1 - Identification of Relevant Samples Size from Population Database


Step 2 - Approaches for Defining Global Market Size (Value, Volume* & Price*)

Note*: In applicable scenarios
Step 3 - Data Sources
Primary Research
- Web Analytics
- Survey Reports
- Research Institute
- Latest Research Reports
- Opinion Leaders
Secondary Research
- Annual Reports
- White Paper
- Latest Press Release
- Industry Association
- Paid Database
- Investor Presentations

Step 4 - Data Triangulation
Involves using different sources of information in order to increase the validity of a study
These sources are likely to be stakeholders in a program - participants, other researchers, program staff, other community members, and so on.
Then we put all data in single framework & apply various statistical tools to find out the dynamic on the market.
During the analysis stage, feedback from the stakeholder groups would be compared to determine areas of agreement as well as areas of divergence