

Key Insights
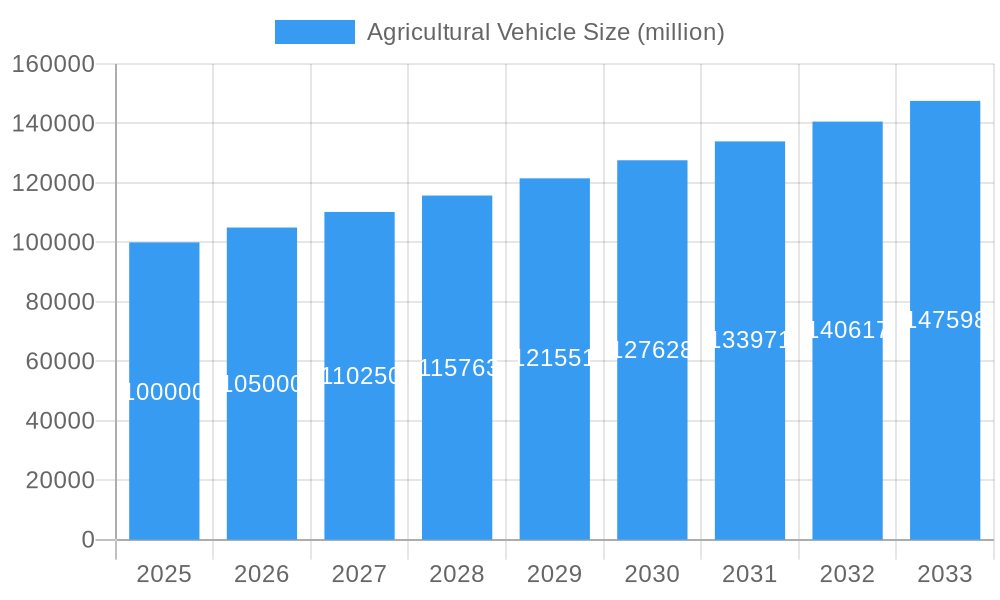
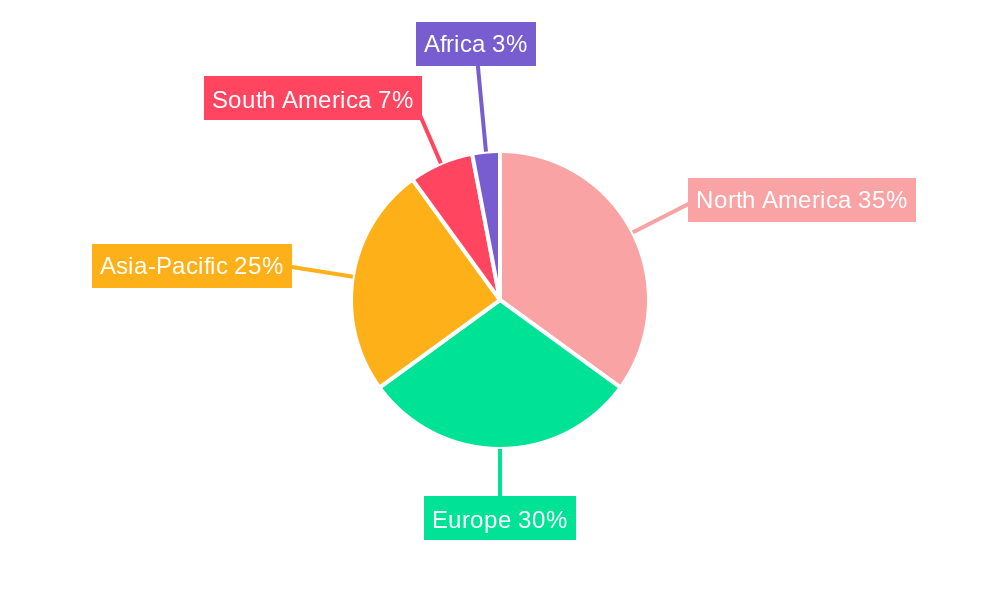
The global agricultural vehicle market is experiencing robust growth, driven by increasing global food demand, advancements in agricultural technology, and a rising focus on precision farming techniques. The market, estimated at $100 billion in 2025, is projected to exhibit a Compound Annual Growth Rate (CAGR) of 5% from 2025 to 2033, reaching an estimated $140 billion by 2033. This expansion is fueled by several key factors, including the rising adoption of automated and autonomous agricultural machinery to enhance efficiency and reduce labor costs. Furthermore, government initiatives promoting sustainable agriculture and investments in agricultural infrastructure are contributing significantly to market expansion. Key players like Deere, New Holland, AGCO, Kubota, Claas, Same Deutz-Fahr, and Kuhn are actively involved in developing innovative technologies and expanding their market reach through strategic partnerships and acquisitions. The market is segmented by vehicle type (tractors, harvesters, planters, sprayers etc.), application (crop farming, livestock farming etc.), and geography. North America and Europe currently hold significant market share, but emerging economies in Asia and South America are presenting lucrative growth opportunities due to increasing agricultural land under cultivation and rising farmer incomes.
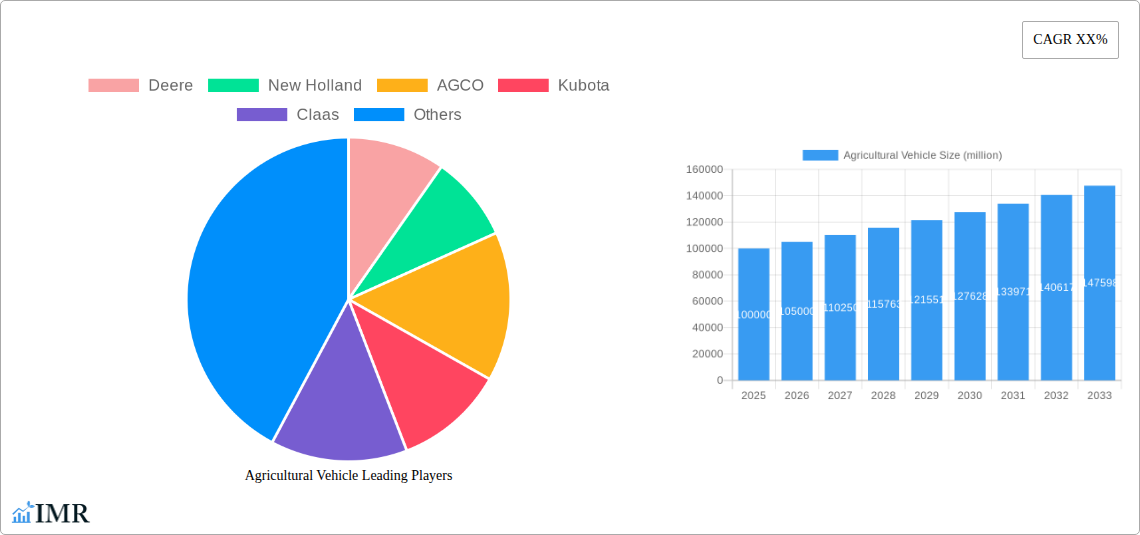
Agricultural Vehicle Market Size (In Billion)
However, the market faces challenges such as fluctuating commodity prices, volatile weather patterns impacting crop yields, and the high initial investment cost associated with advanced agricultural vehicles. These factors could potentially restrain market growth to some extent. Overcoming these hurdles will require a focus on developing cost-effective solutions, improving access to financing for farmers, and fostering collaboration between stakeholders across the agricultural value chain. The continued integration of precision farming technologies, such as GPS guidance systems and sensor-based monitoring, will be crucial in driving market growth and enhancing the efficiency and sustainability of agricultural practices in the coming years. The market is expected to witness increased competition among existing players, alongside the emergence of new entrants offering innovative solutions.
Agricultural Vehicle Company Market Share
Agricultural Vehicle Market Report: 2019-2033
This comprehensive report provides a detailed analysis of the global agricultural vehicle market, encompassing historical data (2019-2024), current estimations (2025), and future projections (2025-2033). The report covers key segments, dominant players, and emerging trends, offering invaluable insights for industry professionals, investors, and strategic decision-makers. The market is segmented by vehicle type (tractors, harvesters, planters, etc.) and application (crop farming, livestock farming, etc.). The study period is 2019-2033, with 2025 as the base year. The report projects a market size of xx million units by 2033.
Agricultural Vehicle Market Dynamics & Structure
The global agricultural vehicle market is characterized by moderate concentration, with key players like Deere, New Holland, AGCO, Kubota, Claas, Same Deutz-Fahr, and Kuhn holding significant market share. Technological innovation, driven by precision farming and automation, is a major growth driver. Stringent emission regulations and safety standards are shaping the market landscape. Competitive substitutes include manual labor and older, less efficient machinery, but technological advancements continually reduce their competitiveness. The end-user demographic encompasses large-scale commercial farms and smallholder farmers, with varying needs and purchasing power. M&A activity remains moderate, with approximately xx deals concluded annually in the past five years, representing an estimated xx% annual growth in deal value.
- Market Concentration: Moderately concentrated, with top 7 players holding approximately xx% market share in 2025.
- Technological Innovation: Precision farming technologies, autonomous vehicles, and data analytics are key drivers.
- Regulatory Framework: Emission standards (Tier 4/Stage V) and safety regulations are increasingly stringent.
- Competitive Substitutes: Manual labor and older machinery pose limited competition due to efficiency gaps.
- End-User Demographics: Diverse, ranging from large commercial farms to smallholder operations.
- M&A Trends: Moderate activity, with xx million USD in deal value annually (2020-2024).
Agricultural Vehicle Growth Trends & Insights
The global agricultural vehicle market experienced a CAGR of xx% during the historical period (2019-2024), reaching an estimated xx million units in 2025. Growth is fueled by rising global food demand, increasing farm mechanization rates in developing economies, and technological advancements enhancing farm productivity. Adoption rates of advanced technologies, such as GPS-guided tractors and automated harvesters, are increasing steadily, although penetration remains relatively low in certain regions. Consumer behavior shifts towards preference for fuel-efficient, high-performance, and technologically advanced vehicles are shaping market demand. The projected CAGR for the forecast period (2025-2033) is xx%, leading to a market size of xx million units by 2033. Market penetration of advanced technologies will increase significantly, reaching xx% by 2033.
Dominant Regions, Countries, or Segments in Agricultural Vehicle
North America and Europe currently dominate the agricultural vehicle market, driven by high agricultural output, advanced farming practices, and strong economies. However, the Asia-Pacific region exhibits the fastest growth rate, fueled by increasing farm mechanization, rising disposable incomes, and government support for agricultural development. Within the Asia-Pacific region, India and China are key drivers, experiencing significant growth in tractor and harvester sales.
- Key Drivers (North America & Europe): High agricultural output, advanced farming techniques, strong economies.
- Key Drivers (Asia-Pacific): Increasing farm mechanization, rising incomes, government support.
- Market Share: North America and Europe hold xx% market share, with Asia-Pacific projected to reach xx% by 2033.
- Growth Potential: Highest in Asia-Pacific, followed by Latin America and Africa.
Agricultural Vehicle Product Landscape
The agricultural vehicle market encompasses a wide range of products, including tractors (wheeled and tracked), harvesters (combines, forage harvesters), planters, sprayers, and other specialized equipment. Recent innovations focus on precision farming technologies, such as GPS guidance, auto-steer systems, variable rate technology, and sensor-based monitoring. These advancements enhance efficiency, reduce input costs, and improve crop yields. Unique selling propositions include fuel efficiency, enhanced operator comfort, and advanced automation features. Technological advancements in engine technology, materials science, and electronics are continually improving vehicle performance and durability.
Key Drivers, Barriers & Challenges in Agricultural Vehicle
Key Drivers: Increasing global food demand, rising farm incomes, government initiatives promoting agricultural modernization, and technological advancements boosting farm productivity.
Key Challenges: High initial investment costs, limited access to financing in developing countries, volatile commodity prices, supply chain disruptions, and regulatory hurdles regarding emissions and safety. The impact of supply chain disruptions on production and pricing is estimated at xx% in 2025.
Emerging Opportunities in Agricultural Vehicle
Emerging opportunities include the growth of precision farming technologies, the expansion of the market in developing economies, the increasing adoption of electric and autonomous vehicles, and the development of specialized equipment for niche applications, such as vertical farming and indoor agriculture. The untapped potential in precision farming is estimated at xx million units by 2033.
Growth Accelerators in the Agricultural Vehicle Industry
Technological breakthroughs, such as the development of AI-powered agricultural robots and drones, are accelerating market growth. Strategic partnerships between vehicle manufacturers and technology providers are fostering innovation and market expansion. Government policies supporting agricultural modernization and farm mechanization are also creating favorable conditions for growth.
Key Players Shaping the Agricultural Vehicle Market
Notable Milestones in Agricultural Vehicle Sector
- 2020: Deere launches fully autonomous tractor.
- 2021: AGCO introduces new precision planting technology.
- 2022: New Holland unveils electric tractor prototype.
- 2023: Kubota acquires a precision farming technology company.
- 2024: Claas and a tech partner develop advanced harvesting automation.
In-Depth Agricultural Vehicle Market Outlook
The agricultural vehicle market is poised for sustained growth over the next decade, driven by technological advancements, increasing food demand, and favorable government policies. Strategic opportunities exist in developing and emerging markets, where farm mechanization rates are low. Further innovations in automation, precision farming, and sustainable technologies will significantly shape future market dynamics. The market's long-term potential is substantial, with significant opportunities for market expansion and technological advancements.
Agricultural Vehicle Segmentation
-
1. Application
- 1.1. Agricultural
- 1.2. Forestry
- 1.3. Other
-
2. Types
- 2.1. Below 10 KW
- 2.2. 10-30 KW
- 2.3. 30-50KW
- 2.4. Above 50 KW
Agricultural Vehicle Segmentation By Geography
-
1. North America
- 1.1. United States
- 1.2. Canada
- 1.3. Mexico
-
2. South America
- 2.1. Brazil
- 2.2. Argentina
- 2.3. Rest of South America
-
3. Europe
- 3.1. United Kingdom
- 3.2. Germany
- 3.3. France
- 3.4. Italy
- 3.5. Spain
- 3.6. Russia
- 3.7. Benelux
- 3.8. Nordics
- 3.9. Rest of Europe
-
4. Middle East & Africa
- 4.1. Turkey
- 4.2. Israel
- 4.3. GCC
- 4.4. North Africa
- 4.5. South Africa
- 4.6. Rest of Middle East & Africa
-
5. Asia Pacific
- 5.1. China
- 5.2. India
- 5.3. Japan
- 5.4. South Korea
- 5.5. ASEAN
- 5.6. Oceania
- 5.7. Rest of Asia Pacific
Agricultural Vehicle Regional Market Share
Geographic Coverage of Agricultural Vehicle
Agricultural Vehicle REPORT HIGHLIGHTS
| Aspects | Details |
|---|---|
| Study Period | 2020-2034 |
| Base Year | 2025 |
| Estimated Year | 2026 |
| Forecast Period | 2026-2034 |
| Historical Period | 2020-2025 |
| Growth Rate | CAGR of XX% from 2020-2034 |
| Segmentation |
|
Table of Contents
- 1. Introduction
- 1.1. Research Scope
- 1.2. Market Segmentation
- 1.3. Research Objective
- 1.4. Definitions and Assumptions
- 2. Executive Summary
- 2.1. Market Snapshot
- 3. Market Dynamics
- 3.1. Market Drivers
- 3.2. Market Restrains
- 3.3. Market Trends
- 3.4. Market Opportunities
- 4. Market Factor Analysis
- 4.1. Porters Five Forces
- 4.1.1. Bargaining Power of Suppliers
- 4.1.2. Bargaining Power of Buyers
- 4.1.3. Threat of New Entrants
- 4.1.4. Threat of Substitutes
- 4.1.5. Competitive Rivalry
- 4.2. PESTEL analysis
- 4.3. BCG Analysis
- 4.3.1. Stars (High Growth, High Market Share)
- 4.3.2. Cash Cows (Low Growth, High Market Share)
- 4.3.3. Question Mark (High Growth, Low Market Share)
- 4.3.4. Dogs (Low Growth, Low Market Share)
- 4.4. Ansoff Matrix Analysis
- 4.5. Supply Chain Analysis
- 4.6. Regulatory Landscape
- 4.7. Current Market Potential and Opportunity Assessment (TAM–SAM–SOM Framework)
- 4.8. IMR Analyst Note
- 4.1. Porters Five Forces
- 5. Market Analysis, Insights and Forecast 2021-2033
- 5.1. Market Analysis, Insights and Forecast - by Application
- 5.1.1. Agricultural
- 5.1.2. Forestry
- 5.1.3. Other
- 5.2. Market Analysis, Insights and Forecast - by Types
- 5.2.1. Below 10 KW
- 5.2.2. 10-30 KW
- 5.2.3. 30-50KW
- 5.2.4. Above 50 KW
- 5.3. Market Analysis, Insights and Forecast - by Region
- 5.3.1. North America
- 5.3.2. South America
- 5.3.3. Europe
- 5.3.4. Middle East & Africa
- 5.3.5. Asia Pacific
- 5.1. Market Analysis, Insights and Forecast - by Application
- 6. Global Agricultural Vehicle Analysis, Insights and Forecast, 2021-2033
- 6.1. Market Analysis, Insights and Forecast - by Application
- 6.1.1. Agricultural
- 6.1.2. Forestry
- 6.1.3. Other
- 6.2. Market Analysis, Insights and Forecast - by Types
- 6.2.1. Below 10 KW
- 6.2.2. 10-30 KW
- 6.2.3. 30-50KW
- 6.2.4. Above 50 KW
- 6.1. Market Analysis, Insights and Forecast - by Application
- 7. North America Agricultural Vehicle Analysis, Insights and Forecast, 2020-2032
- 7.1. Market Analysis, Insights and Forecast - by Application
- 7.1.1. Agricultural
- 7.1.2. Forestry
- 7.1.3. Other
- 7.2. Market Analysis, Insights and Forecast - by Types
- 7.2.1. Below 10 KW
- 7.2.2. 10-30 KW
- 7.2.3. 30-50KW
- 7.2.4. Above 50 KW
- 7.1. Market Analysis, Insights and Forecast - by Application
- 8. South America Agricultural Vehicle Analysis, Insights and Forecast, 2020-2032
- 8.1. Market Analysis, Insights and Forecast - by Application
- 8.1.1. Agricultural
- 8.1.2. Forestry
- 8.1.3. Other
- 8.2. Market Analysis, Insights and Forecast - by Types
- 8.2.1. Below 10 KW
- 8.2.2. 10-30 KW
- 8.2.3. 30-50KW
- 8.2.4. Above 50 KW
- 8.1. Market Analysis, Insights and Forecast - by Application
- 9. Europe Agricultural Vehicle Analysis, Insights and Forecast, 2020-2032
- 9.1. Market Analysis, Insights and Forecast - by Application
- 9.1.1. Agricultural
- 9.1.2. Forestry
- 9.1.3. Other
- 9.2. Market Analysis, Insights and Forecast - by Types
- 9.2.1. Below 10 KW
- 9.2.2. 10-30 KW
- 9.2.3. 30-50KW
- 9.2.4. Above 50 KW
- 9.1. Market Analysis, Insights and Forecast - by Application
- 10. Middle East & Africa Agricultural Vehicle Analysis, Insights and Forecast, 2020-2032
- 10.1. Market Analysis, Insights and Forecast - by Application
- 10.1.1. Agricultural
- 10.1.2. Forestry
- 10.1.3. Other
- 10.2. Market Analysis, Insights and Forecast - by Types
- 10.2.1. Below 10 KW
- 10.2.2. 10-30 KW
- 10.2.3. 30-50KW
- 10.2.4. Above 50 KW
- 10.1. Market Analysis, Insights and Forecast - by Application
- 11. Asia Pacific Agricultural Vehicle Analysis, Insights and Forecast, 2020-2032
- 11.1. Market Analysis, Insights and Forecast - by Application
- 11.1.1. Agricultural
- 11.1.2. Forestry
- 11.1.3. Other
- 11.2. Market Analysis, Insights and Forecast - by Types
- 11.2.1. Below 10 KW
- 11.2.2. 10-30 KW
- 11.2.3. 30-50KW
- 11.2.4. Above 50 KW
- 11.1. Market Analysis, Insights and Forecast - by Application
- 12. Competitive Analysis
- 12.1. Company Profiles
- 12.1.1 Deere
- 12.1.1.1. Company Overview
- 12.1.1.2. Products
- 12.1.1.3. Company Financials
- 12.1.1.4. SWOT Analysis
- 12.1.2 New Holland
- 12.1.2.1. Company Overview
- 12.1.2.2. Products
- 12.1.2.3. Company Financials
- 12.1.2.4. SWOT Analysis
- 12.1.3 AGCO
- 12.1.3.1. Company Overview
- 12.1.3.2. Products
- 12.1.3.3. Company Financials
- 12.1.3.4. SWOT Analysis
- 12.1.4 Kubota
- 12.1.4.1. Company Overview
- 12.1.4.2. Products
- 12.1.4.3. Company Financials
- 12.1.4.4. SWOT Analysis
- 12.1.5 Claas
- 12.1.5.1. Company Overview
- 12.1.5.2. Products
- 12.1.5.3. Company Financials
- 12.1.5.4. SWOT Analysis
- 12.1.6 Same Deutz-Fahr
- 12.1.6.1. Company Overview
- 12.1.6.2. Products
- 12.1.6.3. Company Financials
- 12.1.6.4. SWOT Analysis
- 12.1.7 Kuhn
- 12.1.7.1. Company Overview
- 12.1.7.2. Products
- 12.1.7.3. Company Financials
- 12.1.7.4. SWOT Analysis
- 12.1.1 Deere
- 12.2. Market Entropy
- 12.2.1 Company's Key Areas Served
- 12.2.2 Recent Developments
- 12.3. Company Market Share Analysis 2025
- 12.3.1 Top 5 Companies Market Share Analysis
- 12.3.2 Top 3 Companies Market Share Analysis
- 12.4. List of Potential Customers
- 13. Research Methodology
List of Figures
- Figure 1: Global Agricultural Vehicle Revenue Breakdown (million, %) by Region 2025 & 2033
- Figure 2: North America Agricultural Vehicle Revenue (million), by Application 2025 & 2033
- Figure 3: North America Agricultural Vehicle Revenue Share (%), by Application 2025 & 2033
- Figure 4: North America Agricultural Vehicle Revenue (million), by Types 2025 & 2033
- Figure 5: North America Agricultural Vehicle Revenue Share (%), by Types 2025 & 2033
- Figure 6: North America Agricultural Vehicle Revenue (million), by Country 2025 & 2033
- Figure 7: North America Agricultural Vehicle Revenue Share (%), by Country 2025 & 2033
- Figure 8: South America Agricultural Vehicle Revenue (million), by Application 2025 & 2033
- Figure 9: South America Agricultural Vehicle Revenue Share (%), by Application 2025 & 2033
- Figure 10: South America Agricultural Vehicle Revenue (million), by Types 2025 & 2033
- Figure 11: South America Agricultural Vehicle Revenue Share (%), by Types 2025 & 2033
- Figure 12: South America Agricultural Vehicle Revenue (million), by Country 2025 & 2033
- Figure 13: South America Agricultural Vehicle Revenue Share (%), by Country 2025 & 2033
- Figure 14: Europe Agricultural Vehicle Revenue (million), by Application 2025 & 2033
- Figure 15: Europe Agricultural Vehicle Revenue Share (%), by Application 2025 & 2033
- Figure 16: Europe Agricultural Vehicle Revenue (million), by Types 2025 & 2033
- Figure 17: Europe Agricultural Vehicle Revenue Share (%), by Types 2025 & 2033
- Figure 18: Europe Agricultural Vehicle Revenue (million), by Country 2025 & 2033
- Figure 19: Europe Agricultural Vehicle Revenue Share (%), by Country 2025 & 2033
- Figure 20: Middle East & Africa Agricultural Vehicle Revenue (million), by Application 2025 & 2033
- Figure 21: Middle East & Africa Agricultural Vehicle Revenue Share (%), by Application 2025 & 2033
- Figure 22: Middle East & Africa Agricultural Vehicle Revenue (million), by Types 2025 & 2033
- Figure 23: Middle East & Africa Agricultural Vehicle Revenue Share (%), by Types 2025 & 2033
- Figure 24: Middle East & Africa Agricultural Vehicle Revenue (million), by Country 2025 & 2033
- Figure 25: Middle East & Africa Agricultural Vehicle Revenue Share (%), by Country 2025 & 2033
- Figure 26: Asia Pacific Agricultural Vehicle Revenue (million), by Application 2025 & 2033
- Figure 27: Asia Pacific Agricultural Vehicle Revenue Share (%), by Application 2025 & 2033
- Figure 28: Asia Pacific Agricultural Vehicle Revenue (million), by Types 2025 & 2033
- Figure 29: Asia Pacific Agricultural Vehicle Revenue Share (%), by Types 2025 & 2033
- Figure 30: Asia Pacific Agricultural Vehicle Revenue (million), by Country 2025 & 2033
- Figure 31: Asia Pacific Agricultural Vehicle Revenue Share (%), by Country 2025 & 2033
List of Tables
- Table 1: Global Agricultural Vehicle Revenue million Forecast, by Application 2020 & 2033
- Table 2: Global Agricultural Vehicle Revenue million Forecast, by Types 2020 & 2033
- Table 3: Global Agricultural Vehicle Revenue million Forecast, by Region 2020 & 2033
- Table 4: Global Agricultural Vehicle Revenue million Forecast, by Application 2020 & 2033
- Table 5: Global Agricultural Vehicle Revenue million Forecast, by Types 2020 & 2033
- Table 6: Global Agricultural Vehicle Revenue million Forecast, by Country 2020 & 2033
- Table 7: United States Agricultural Vehicle Revenue (million) Forecast, by Application 2020 & 2033
- Table 8: Canada Agricultural Vehicle Revenue (million) Forecast, by Application 2020 & 2033
- Table 9: Mexico Agricultural Vehicle Revenue (million) Forecast, by Application 2020 & 2033
- Table 10: Global Agricultural Vehicle Revenue million Forecast, by Application 2020 & 2033
- Table 11: Global Agricultural Vehicle Revenue million Forecast, by Types 2020 & 2033
- Table 12: Global Agricultural Vehicle Revenue million Forecast, by Country 2020 & 2033
- Table 13: Brazil Agricultural Vehicle Revenue (million) Forecast, by Application 2020 & 2033
- Table 14: Argentina Agricultural Vehicle Revenue (million) Forecast, by Application 2020 & 2033
- Table 15: Rest of South America Agricultural Vehicle Revenue (million) Forecast, by Application 2020 & 2033
- Table 16: Global Agricultural Vehicle Revenue million Forecast, by Application 2020 & 2033
- Table 17: Global Agricultural Vehicle Revenue million Forecast, by Types 2020 & 2033
- Table 18: Global Agricultural Vehicle Revenue million Forecast, by Country 2020 & 2033
- Table 19: United Kingdom Agricultural Vehicle Revenue (million) Forecast, by Application 2020 & 2033
- Table 20: Germany Agricultural Vehicle Revenue (million) Forecast, by Application 2020 & 2033
- Table 21: France Agricultural Vehicle Revenue (million) Forecast, by Application 2020 & 2033
- Table 22: Italy Agricultural Vehicle Revenue (million) Forecast, by Application 2020 & 2033
- Table 23: Spain Agricultural Vehicle Revenue (million) Forecast, by Application 2020 & 2033
- Table 24: Russia Agricultural Vehicle Revenue (million) Forecast, by Application 2020 & 2033
- Table 25: Benelux Agricultural Vehicle Revenue (million) Forecast, by Application 2020 & 2033
- Table 26: Nordics Agricultural Vehicle Revenue (million) Forecast, by Application 2020 & 2033
- Table 27: Rest of Europe Agricultural Vehicle Revenue (million) Forecast, by Application 2020 & 2033
- Table 28: Global Agricultural Vehicle Revenue million Forecast, by Application 2020 & 2033
- Table 29: Global Agricultural Vehicle Revenue million Forecast, by Types 2020 & 2033
- Table 30: Global Agricultural Vehicle Revenue million Forecast, by Country 2020 & 2033
- Table 31: Turkey Agricultural Vehicle Revenue (million) Forecast, by Application 2020 & 2033
- Table 32: Israel Agricultural Vehicle Revenue (million) Forecast, by Application 2020 & 2033
- Table 33: GCC Agricultural Vehicle Revenue (million) Forecast, by Application 2020 & 2033
- Table 34: North Africa Agricultural Vehicle Revenue (million) Forecast, by Application 2020 & 2033
- Table 35: South Africa Agricultural Vehicle Revenue (million) Forecast, by Application 2020 & 2033
- Table 36: Rest of Middle East & Africa Agricultural Vehicle Revenue (million) Forecast, by Application 2020 & 2033
- Table 37: Global Agricultural Vehicle Revenue million Forecast, by Application 2020 & 2033
- Table 38: Global Agricultural Vehicle Revenue million Forecast, by Types 2020 & 2033
- Table 39: Global Agricultural Vehicle Revenue million Forecast, by Country 2020 & 2033
- Table 40: China Agricultural Vehicle Revenue (million) Forecast, by Application 2020 & 2033
- Table 41: India Agricultural Vehicle Revenue (million) Forecast, by Application 2020 & 2033
- Table 42: Japan Agricultural Vehicle Revenue (million) Forecast, by Application 2020 & 2033
- Table 43: South Korea Agricultural Vehicle Revenue (million) Forecast, by Application 2020 & 2033
- Table 44: ASEAN Agricultural Vehicle Revenue (million) Forecast, by Application 2020 & 2033
- Table 45: Oceania Agricultural Vehicle Revenue (million) Forecast, by Application 2020 & 2033
- Table 46: Rest of Asia Pacific Agricultural Vehicle Revenue (million) Forecast, by Application 2020 & 2033
Frequently Asked Questions
1. What is the projected Compound Annual Growth Rate (CAGR) of the Agricultural Vehicle?
The projected CAGR is approximately XX%.
2. Which companies are prominent players in the Agricultural Vehicle?
Key companies in the market include Deere, New Holland, AGCO, Kubota, Claas, Same Deutz-Fahr, Kuhn.
3. What are the main segments of the Agricultural Vehicle?
The market segments include Application, Types.
4. Can you provide details about the market size?
The market size is estimated to be USD XXX million as of 2022.
5. What are some drivers contributing to market growth?
N/A
6. What are the notable trends driving market growth?
N/A
7. Are there any restraints impacting market growth?
N/A
8. Can you provide examples of recent developments in the market?
N/A
9. What pricing options are available for accessing the report?
Pricing options include single-user, multi-user, and enterprise licenses priced at USD 2900.00, USD 4350.00, and USD 5800.00 respectively.
10. Is the market size provided in terms of value or volume?
The market size is provided in terms of value, measured in million.
11. Are there any specific market keywords associated with the report?
Yes, the market keyword associated with the report is "Agricultural Vehicle," which aids in identifying and referencing the specific market segment covered.
12. How do I determine which pricing option suits my needs best?
The pricing options vary based on user requirements and access needs. Individual users may opt for single-user licenses, while businesses requiring broader access may choose multi-user or enterprise licenses for cost-effective access to the report.
13. Are there any additional resources or data provided in the Agricultural Vehicle report?
While the report offers comprehensive insights, it's advisable to review the specific contents or supplementary materials provided to ascertain if additional resources or data are available.
14. How can I stay updated on further developments or reports in the Agricultural Vehicle?
To stay informed about further developments, trends, and reports in the Agricultural Vehicle, consider subscribing to industry newsletters, following relevant companies and organizations, or regularly checking reputable industry news sources and publications.
Methodology
Step 1 - Identification of Relevant Samples Size from Population Database


Step 2 - Approaches for Defining Global Market Size (Value, Volume* & Price*)

Note*: In applicable scenarios
Step 3 - Data Sources
Primary Research
- Web Analytics
- Survey Reports
- Research Institute
- Latest Research Reports
- Opinion Leaders
Secondary Research
- Annual Reports
- White Paper
- Latest Press Release
- Industry Association
- Paid Database
- Investor Presentations

Step 4 - Data Triangulation
Involves using different sources of information in order to increase the validity of a study
These sources are likely to be stakeholders in a program - participants, other researchers, program staff, other community members, and so on.
Then we put all data in single framework & apply various statistical tools to find out the dynamic on the market.
During the analysis stage, feedback from the stakeholder groups would be compared to determine areas of agreement as well as areas of divergence