

Key Insights
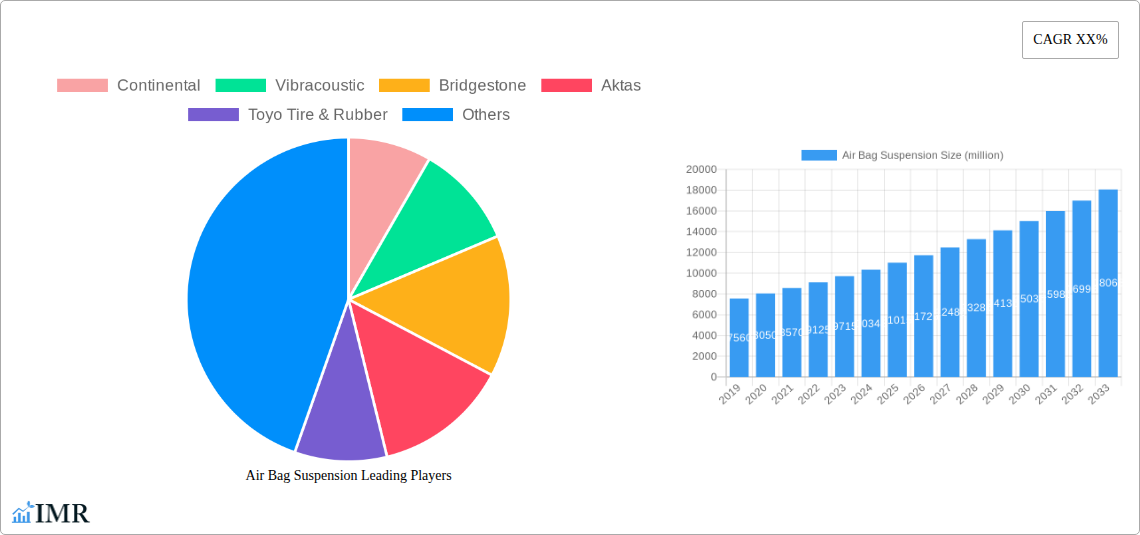
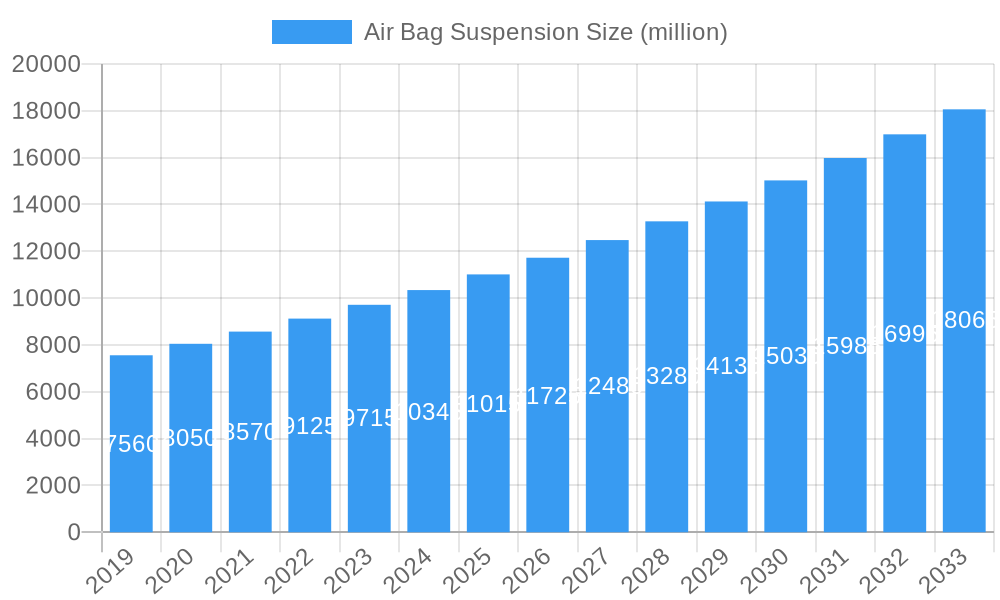
The global Air Bag Suspension market is projected to experience robust growth, reaching an estimated market size of $7.56 billion in 2019, with a projected Compound Annual Growth Rate (CAGR) of 6.5% through 2033. This expansion is primarily fueled by the increasing demand for enhanced vehicle comfort, safety, and improved fuel efficiency across both the Original Equipment Manufacturer (OEM) and aftermarket segments. Advanced driver-assistance systems (ADAS) integration and the growing preference for sophisticated ride control technologies in passenger vehicles and commercial trucks are significant drivers. The market is also benefiting from stringent regulations in various regions mandating improved emission standards and load-bearing capabilities, which air bag suspension systems effectively address. Furthermore, the rise in e-commerce and the increasing availability of aftermarket suspension kits are making these advanced systems more accessible to a wider consumer base.
Air Bag Suspension Market Size (In Billion)
The market's trajectory is further shaped by evolving consumer preferences and technological advancements. Innovations in materials and manufacturing processes are leading to lighter, more durable, and cost-effective air bag suspension solutions. The increasing adoption of electric vehicles (EVs) also presents a unique opportunity, as air bag suspensions can help manage the weight of heavy battery packs and contribute to a smoother, quieter ride, crucial for EV user experience. However, challenges such as the initial high cost of installation for certain applications and the need for specialized maintenance expertise could pose some restraints. Despite these, the overarching trend towards premiumization in the automotive sector and the continuous drive for superior driving dynamics are expected to propel the air bag suspension market forward, with Asia Pacific emerging as a key growth region due to its burgeoning automotive industry and increasing disposable incomes.
Air Bag Suspension Company Market Share
Air Bag Suspension Market: A Comprehensive Analysis and Forecast (2019-2033)
This in-depth report delivers a robust analysis of the global air bag suspension market, encompassing its intricate dynamics, growth trajectory, and future outlook. Designed for industry professionals, procurement managers, R&D specialists, and strategic decision-makers, this report provides actionable insights and a clear understanding of market opportunities within both parent and child market segments. With a study period spanning 2019 to 2033, a base year of 2025, and a forecast period from 2025 to 2033, this research offers a definitive roadmap for navigating the evolving landscape of air bag suspension systems.
Air Bag Suspension Market Dynamics & Structure
The global air bag suspension market is characterized by a moderate to high level of concentration, with a few key global players dominating a significant portion of the market share. Technological innovation is a primary driver, fueled by increasing demand for enhanced ride comfort, improved vehicle handling, and greater fuel efficiency across commercial and passenger vehicles. Regulatory frameworks, particularly concerning vehicle safety and emissions, indirectly influence the adoption of advanced suspension systems like air bags, pushing for lighter and more efficient solutions. Competitive product substitutes, such as traditional hydraulic or coil spring suspensions, present ongoing challenges, but the superior performance benefits of air bag systems, especially in heavy-duty applications, continue to drive adoption. End-user demographics, particularly the growing demand for premium features in passenger vehicles and the need for robust, adaptable suspension in commercial fleets, are shaping market demand. Mergers and Acquisitions (M&A) trends are present, as larger players seek to consolidate market share and acquire innovative technologies.
- Market Concentration: Estimated XX% dominated by top 5 players.
- Technological Innovation Drivers: Demand for ride comfort, handling, and efficiency.
- Regulatory Frameworks: Influence on safety standards and emissions compliance.
- Competitive Substitutes: Traditional hydraulic and coil spring suspensions.
- End-User Demographics: Growing demand in luxury passenger vehicles and commercial fleets.
- M&A Trends: Strategic acquisitions for technology and market expansion.
Air Bag Suspension Growth Trends & Insights
The global air bag suspension market is poised for robust growth, projected to expand at a Compound Annual Growth Rate (CAGR) of approximately XX% during the forecast period of 2025–2033. This expansion is underpinned by a significant increase in market size, driven by evolving consumer preferences and increasingly stringent automotive performance standards. The adoption rates of air bag suspension systems are accelerating, particularly in the OEM segment for both passenger and commercial vehicles, as manufacturers integrate these advanced systems as standard features in mid-to-high-end models. Technological disruptions, such as the development of lighter materials, more intelligent control systems, and enhanced durability, are further stimulating market penetration. Consumer behavior shifts, including a greater emphasis on vehicle comfort, safety, and customizable ride experiences, directly translate into higher demand for air bag suspension solutions. The market penetration of air bag suspension systems in the commercial vehicle sector, especially for long-haul trucking and heavy-duty applications, is expected to see substantial growth, driven by operational efficiency gains and reduced driver fatigue.
Dominant Regions, Countries, or Segments in Air Bag Suspension
The OEM Application segment is currently the dominant force in the global air bag suspension market, driven by significant adoption rates in new vehicle production. This dominance is further amplified by the increasing integration of air bag suspension systems as standard equipment in luxury passenger vehicles and a growing number of commercial vehicles, particularly trucks and buses, where enhanced ride comfort and load-carrying capacity are paramount.
North America and Europe currently lead in market value and adoption, owing to their established automotive industries, high consumer spending power, and a strong emphasis on vehicle comfort and performance. Stringent safety regulations and a mature aftermarket for vehicle upgrades also contribute to their leading positions.
Key Drivers of Dominance:
- OEM Integration: Increasing factory-fitted air bag suspension in new vehicle models.
- Passenger Vehicle OEM Adoption: XX%
- Commercial Vehicle OEM Adoption: XX%
- Consumer Demand for Premium Features: Desire for enhanced ride comfort and handling.
- Technological Advancement: Availability of sophisticated and reliable air bag suspension technologies.
- Regulatory Push: Indirect influence of safety and emissions standards favoring efficient suspension.
- Aftermarket Support: Robust network for installation and maintenance, bolstering overall market acceptance.
- Economic Policies: Favorable economic conditions supporting automotive production and sales.
- Infrastructure Development: Investment in road networks necessitating advanced vehicle suspensions.
The Rubber Bellows Type of air bag suspension is expected to maintain a significant market share due to its cost-effectiveness and versatility across various vehicle types. However, advancements in Sleeve-Style Type designs are presenting strong competition, offering improved performance and durability. The Coil Type represents a niche segment with specific application advantages.
Air Bag Suspension Product Landscape
The air bag suspension product landscape is characterized by continuous innovation focused on enhancing durability, reducing weight, and improving responsiveness. Manufacturers are actively developing advanced composite materials for bellows, alongside smarter electronic control units (ECUs) that optimize ride height and damping characteristics in real-time. Unique selling propositions include adaptive damping, self-leveling capabilities, and reduced noise, vibration, and harshness (NVH) levels. Technological advancements are enabling lighter, more compact designs, making air bag suspension systems increasingly viable for a broader range of vehicles, from light-duty trucks to electric vehicles.
Key Drivers, Barriers & Challenges in Air Bag Suspension
Key Drivers:
- Technological Advancements: Ongoing innovation in materials, control systems, and manufacturing processes.
- Demand for Enhanced Ride Comfort: Growing consumer expectation for superior in-cabin experience.
- Improved Vehicle Handling and Safety: Air bag suspension's ability to optimize tire contact and stability.
- Fuel Efficiency Gains: Lighter weight and reduced rolling resistance contribute to better fuel economy.
- Increasing OEM Integration: Standard fitment in premium and commercial vehicles.
Key Barriers & Challenges:
- High Initial Cost: Air bag suspension systems remain more expensive than conventional alternatives.
- Complexity of Installation and Maintenance: Requires specialized knowledge and tools.
- Durability Concerns: Susceptibility to damage from road debris and extreme temperatures in some designs.
- Supply Chain Volatility: Potential disruptions in raw material sourcing and manufacturing.
- Regulatory Hurdles: Evolving standards and certification processes can impact new product introductions.
- Competitive Pressure: Established conventional suspension systems continue to offer cost-effective solutions.
Emerging Opportunities in Air Bag Suspension
Emerging opportunities in the air bag suspension market lie in the expanding electric vehicle (EV) segment, where weight reduction and optimized aerodynamics are critical. The development of highly integrated, compact air bag suspension systems for EVs presents a significant growth avenue. Furthermore, the aftermarket for performance upgrades and retrofitting existing vehicles with air bag suspension is a growing niche. Increased focus on autonomous driving technologies also opens doors for air bag suspension that can precisely control vehicle dynamics for enhanced sensor performance and passenger comfort. Untapped markets in developing economies with improving infrastructure and rising consumer disposable income also represent fertile ground for market expansion.
Growth Accelerators in the Air Bag Suspension Industry
The air bag suspension industry's growth is being significantly accelerated by breakthroughs in smart material science, leading to lighter, more durable, and cost-effective air springs. Strategic partnerships between air spring manufacturers and major automotive OEMs are crucial for driving mass adoption and integrating these systems early in vehicle design cycles. The increasing demand for customizable ride experiences across both passenger and commercial vehicles, coupled with the push for greater fuel efficiency and reduced emissions, acts as a potent market expansion strategy. Furthermore, advancements in predictive maintenance and remote diagnostics for air bag suspension systems are enhancing their appeal by reducing long-term ownership concerns.
Key Players Shaping the Air Bag Suspension Market
- Continental
- Vibracoustic
- Bridgestone
- Aktas
- Toyo Tire & Rubber
- Sumitomo Electric
- Senho
- Yitao Qianchao
- ITT Enidine
- Zhuzhou Times
- Mei Chen Technology
- Stemco
- GaoMate
- Dunlop
- GMT Rubber-Metal-Technic
- Air Lift Company
Notable Milestones in Air Bag Suspension Sector
- 2019: Increased OEM adoption of adaptive air suspension in luxury SUVs.
- 2020: Development of lighter, more durable composite air springs for commercial trucks.
- 2021: Integration of AI-driven control systems for enhanced ride comfort and handling.
- 2022: Significant investment in R&D for air suspension solutions for electric vehicles.
- 2023: Expansion of aftermarket services for air bag suspension retrofitting.
- 2024: Introduction of self-healing materials for air spring bellows.
- 2025 (Estimated): Market penetration of advanced air suspension systems in mid-size passenger vehicles reaches xx%.
In-Depth Air Bag Suspension Market Outlook
The future market outlook for air bag suspension is exceptionally promising, driven by a confluence of technological innovation and evolving consumer demands. Growth accelerators such as the electrification of vehicles, the pursuit of ultimate ride comfort, and the imperative for enhanced vehicle dynamics will continue to propel market expansion. Strategic opportunities lie in further developing cost-effective solutions for a wider vehicle spectrum and in tapping into burgeoning markets in Asia and South America. The industry is expected to witness a surge in smart air suspension systems that offer personalized ride profiles and predictive maintenance capabilities, solidifying air bag suspension as a critical component for modern mobility. The market is projected to reach approximately $xx billion by 2033, indicating substantial growth potential.
Air Bag Suspension Segmentation
-
1. Application
- 1.1. OEM
- 1.2. Aftermarket
-
2. Types
- 2.1. Rubber Bellows Type
- 2.2. Sleeve-Style Type
- 2.3. Coil Type
Air Bag Suspension Segmentation By Geography
-
1. North America
- 1.1. United States
- 1.2. Canada
- 1.3. Mexico
-
2. South America
- 2.1. Brazil
- 2.2. Argentina
- 2.3. Rest of South America
-
3. Europe
- 3.1. United Kingdom
- 3.2. Germany
- 3.3. France
- 3.4. Italy
- 3.5. Spain
- 3.6. Russia
- 3.7. Benelux
- 3.8. Nordics
- 3.9. Rest of Europe
-
4. Middle East & Africa
- 4.1. Turkey
- 4.2. Israel
- 4.3. GCC
- 4.4. North Africa
- 4.5. South Africa
- 4.6. Rest of Middle East & Africa
-
5. Asia Pacific
- 5.1. China
- 5.2. India
- 5.3. Japan
- 5.4. South Korea
- 5.5. ASEAN
- 5.6. Oceania
- 5.7. Rest of Asia Pacific
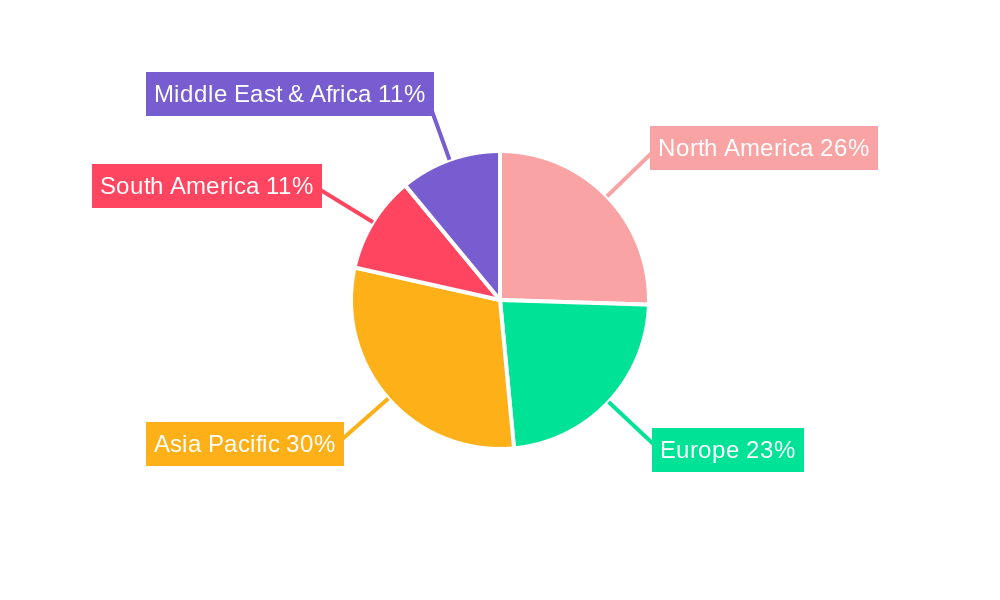
Air Bag Suspension Regional Market Share
Geographic Coverage of Air Bag Suspension
Air Bag Suspension REPORT HIGHLIGHTS
| Aspects | Details |
|---|---|
| Study Period | 2020-2034 |
| Base Year | 2025 |
| Estimated Year | 2026 |
| Forecast Period | 2026-2034 |
| Historical Period | 2020-2025 |
| Growth Rate | CAGR of 6.5% from 2020-2034 |
| Segmentation |
|
Table of Contents
- 1. Introduction
- 1.1. Research Scope
- 1.2. Market Segmentation
- 1.3. Research Objective
- 1.4. Definitions and Assumptions
- 2. Executive Summary
- 2.1. Market Snapshot
- 3. Market Dynamics
- 3.1. Market Drivers
- 3.2. Market Restrains
- 3.3. Market Trends
- 3.4. Market Opportunities
- 4. Market Factor Analysis
- 4.1. Porters Five Forces
- 4.1.1. Bargaining Power of Suppliers
- 4.1.2. Bargaining Power of Buyers
- 4.1.3. Threat of New Entrants
- 4.1.4. Threat of Substitutes
- 4.1.5. Competitive Rivalry
- 4.2. PESTEL analysis
- 4.3. BCG Analysis
- 4.3.1. Stars (High Growth, High Market Share)
- 4.3.2. Cash Cows (Low Growth, High Market Share)
- 4.3.3. Question Mark (High Growth, Low Market Share)
- 4.3.4. Dogs (Low Growth, Low Market Share)
- 4.4. Ansoff Matrix Analysis
- 4.5. Supply Chain Analysis
- 4.6. Regulatory Landscape
- 4.7. Current Market Potential and Opportunity Assessment (TAM–SAM–SOM Framework)
- 4.8. IMR Analyst Note
- 4.1. Porters Five Forces
- 5. Market Analysis, Insights and Forecast 2021-2033
- 5.1. Market Analysis, Insights and Forecast - by Application
- 5.1.1. OEM
- 5.1.2. Aftermarket
- 5.2. Market Analysis, Insights and Forecast - by Types
- 5.2.1. Rubber Bellows Type
- 5.2.2. Sleeve-Style Type
- 5.2.3. Coil Type
- 5.3. Market Analysis, Insights and Forecast - by Region
- 5.3.1. North America
- 5.3.2. South America
- 5.3.3. Europe
- 5.3.4. Middle East & Africa
- 5.3.5. Asia Pacific
- 5.1. Market Analysis, Insights and Forecast - by Application
- 6. Global Air Bag Suspension Analysis, Insights and Forecast, 2021-2033
- 6.1. Market Analysis, Insights and Forecast - by Application
- 6.1.1. OEM
- 6.1.2. Aftermarket
- 6.2. Market Analysis, Insights and Forecast - by Types
- 6.2.1. Rubber Bellows Type
- 6.2.2. Sleeve-Style Type
- 6.2.3. Coil Type
- 6.1. Market Analysis, Insights and Forecast - by Application
- 7. North America Air Bag Suspension Analysis, Insights and Forecast, 2020-2032
- 7.1. Market Analysis, Insights and Forecast - by Application
- 7.1.1. OEM
- 7.1.2. Aftermarket
- 7.2. Market Analysis, Insights and Forecast - by Types
- 7.2.1. Rubber Bellows Type
- 7.2.2. Sleeve-Style Type
- 7.2.3. Coil Type
- 7.1. Market Analysis, Insights and Forecast - by Application
- 8. South America Air Bag Suspension Analysis, Insights and Forecast, 2020-2032
- 8.1. Market Analysis, Insights and Forecast - by Application
- 8.1.1. OEM
- 8.1.2. Aftermarket
- 8.2. Market Analysis, Insights and Forecast - by Types
- 8.2.1. Rubber Bellows Type
- 8.2.2. Sleeve-Style Type
- 8.2.3. Coil Type
- 8.1. Market Analysis, Insights and Forecast - by Application
- 9. Europe Air Bag Suspension Analysis, Insights and Forecast, 2020-2032
- 9.1. Market Analysis, Insights and Forecast - by Application
- 9.1.1. OEM
- 9.1.2. Aftermarket
- 9.2. Market Analysis, Insights and Forecast - by Types
- 9.2.1. Rubber Bellows Type
- 9.2.2. Sleeve-Style Type
- 9.2.3. Coil Type
- 9.1. Market Analysis, Insights and Forecast - by Application
- 10. Middle East & Africa Air Bag Suspension Analysis, Insights and Forecast, 2020-2032
- 10.1. Market Analysis, Insights and Forecast - by Application
- 10.1.1. OEM
- 10.1.2. Aftermarket
- 10.2. Market Analysis, Insights and Forecast - by Types
- 10.2.1. Rubber Bellows Type
- 10.2.2. Sleeve-Style Type
- 10.2.3. Coil Type
- 10.1. Market Analysis, Insights and Forecast - by Application
- 11. Asia Pacific Air Bag Suspension Analysis, Insights and Forecast, 2020-2032
- 11.1. Market Analysis, Insights and Forecast - by Application
- 11.1.1. OEM
- 11.1.2. Aftermarket
- 11.2. Market Analysis, Insights and Forecast - by Types
- 11.2.1. Rubber Bellows Type
- 11.2.2. Sleeve-Style Type
- 11.2.3. Coil Type
- 11.1. Market Analysis, Insights and Forecast - by Application
- 12. Competitive Analysis
- 12.1. Company Profiles
- 12.1.1 Continental
- 12.1.1.1. Company Overview
- 12.1.1.2. Products
- 12.1.1.3. Company Financials
- 12.1.1.4. SWOT Analysis
- 12.1.2 Vibracoustic
- 12.1.2.1. Company Overview
- 12.1.2.2. Products
- 12.1.2.3. Company Financials
- 12.1.2.4. SWOT Analysis
- 12.1.3 Bridgestone
- 12.1.3.1. Company Overview
- 12.1.3.2. Products
- 12.1.3.3. Company Financials
- 12.1.3.4. SWOT Analysis
- 12.1.4 Aktas
- 12.1.4.1. Company Overview
- 12.1.4.2. Products
- 12.1.4.3. Company Financials
- 12.1.4.4. SWOT Analysis
- 12.1.5 Toyo Tire & Rubber
- 12.1.5.1. Company Overview
- 12.1.5.2. Products
- 12.1.5.3. Company Financials
- 12.1.5.4. SWOT Analysis
- 12.1.6 Sumitomo Electric
- 12.1.6.1. Company Overview
- 12.1.6.2. Products
- 12.1.6.3. Company Financials
- 12.1.6.4. SWOT Analysis
- 12.1.7 Senho
- 12.1.7.1. Company Overview
- 12.1.7.2. Products
- 12.1.7.3. Company Financials
- 12.1.7.4. SWOT Analysis
- 12.1.8 Yitao Qianchao
- 12.1.8.1. Company Overview
- 12.1.8.2. Products
- 12.1.8.3. Company Financials
- 12.1.8.4. SWOT Analysis
- 12.1.9 ITT Enidine
- 12.1.9.1. Company Overview
- 12.1.9.2. Products
- 12.1.9.3. Company Financials
- 12.1.9.4. SWOT Analysis
- 12.1.10 Zhuzhou Times
- 12.1.10.1. Company Overview
- 12.1.10.2. Products
- 12.1.10.3. Company Financials
- 12.1.10.4. SWOT Analysis
- 12.1.11 Mei Chen Technology
- 12.1.11.1. Company Overview
- 12.1.11.2. Products
- 12.1.11.3. Company Financials
- 12.1.11.4. SWOT Analysis
- 12.1.12 Stemco
- 12.1.12.1. Company Overview
- 12.1.12.2. Products
- 12.1.12.3. Company Financials
- 12.1.12.4. SWOT Analysis
- 12.1.13 GaoMate
- 12.1.13.1. Company Overview
- 12.1.13.2. Products
- 12.1.13.3. Company Financials
- 12.1.13.4. SWOT Analysis
- 12.1.14 Dunlop
- 12.1.14.1. Company Overview
- 12.1.14.2. Products
- 12.1.14.3. Company Financials
- 12.1.14.4. SWOT Analysis
- 12.1.15 GMT Rubber-Metal-Technic
- 12.1.15.1. Company Overview
- 12.1.15.2. Products
- 12.1.15.3. Company Financials
- 12.1.15.4. SWOT Analysis
- 12.1.16 Air Lift Company
- 12.1.16.1. Company Overview
- 12.1.16.2. Products
- 12.1.16.3. Company Financials
- 12.1.16.4. SWOT Analysis
- 12.1.1 Continental
- 12.2. Market Entropy
- 12.2.1 Company's Key Areas Served
- 12.2.2 Recent Developments
- 12.3. Company Market Share Analysis 2025
- 12.3.1 Top 5 Companies Market Share Analysis
- 12.3.2 Top 3 Companies Market Share Analysis
- 12.4. List of Potential Customers
- 13. Research Methodology
List of Figures
- Figure 1: Global Air Bag Suspension Revenue Breakdown (undefined, %) by Region 2025 & 2033
- Figure 2: Global Air Bag Suspension Volume Breakdown (K, %) by Region 2025 & 2033
- Figure 3: North America Air Bag Suspension Revenue (undefined), by Application 2025 & 2033
- Figure 4: North America Air Bag Suspension Volume (K), by Application 2025 & 2033
- Figure 5: North America Air Bag Suspension Revenue Share (%), by Application 2025 & 2033
- Figure 6: North America Air Bag Suspension Volume Share (%), by Application 2025 & 2033
- Figure 7: North America Air Bag Suspension Revenue (undefined), by Types 2025 & 2033
- Figure 8: North America Air Bag Suspension Volume (K), by Types 2025 & 2033
- Figure 9: North America Air Bag Suspension Revenue Share (%), by Types 2025 & 2033
- Figure 10: North America Air Bag Suspension Volume Share (%), by Types 2025 & 2033
- Figure 11: North America Air Bag Suspension Revenue (undefined), by Country 2025 & 2033
- Figure 12: North America Air Bag Suspension Volume (K), by Country 2025 & 2033
- Figure 13: North America Air Bag Suspension Revenue Share (%), by Country 2025 & 2033
- Figure 14: North America Air Bag Suspension Volume Share (%), by Country 2025 & 2033
- Figure 15: South America Air Bag Suspension Revenue (undefined), by Application 2025 & 2033
- Figure 16: South America Air Bag Suspension Volume (K), by Application 2025 & 2033
- Figure 17: South America Air Bag Suspension Revenue Share (%), by Application 2025 & 2033
- Figure 18: South America Air Bag Suspension Volume Share (%), by Application 2025 & 2033
- Figure 19: South America Air Bag Suspension Revenue (undefined), by Types 2025 & 2033
- Figure 20: South America Air Bag Suspension Volume (K), by Types 2025 & 2033
- Figure 21: South America Air Bag Suspension Revenue Share (%), by Types 2025 & 2033
- Figure 22: South America Air Bag Suspension Volume Share (%), by Types 2025 & 2033
- Figure 23: South America Air Bag Suspension Revenue (undefined), by Country 2025 & 2033
- Figure 24: South America Air Bag Suspension Volume (K), by Country 2025 & 2033
- Figure 25: South America Air Bag Suspension Revenue Share (%), by Country 2025 & 2033
- Figure 26: South America Air Bag Suspension Volume Share (%), by Country 2025 & 2033
- Figure 27: Europe Air Bag Suspension Revenue (undefined), by Application 2025 & 2033
- Figure 28: Europe Air Bag Suspension Volume (K), by Application 2025 & 2033
- Figure 29: Europe Air Bag Suspension Revenue Share (%), by Application 2025 & 2033
- Figure 30: Europe Air Bag Suspension Volume Share (%), by Application 2025 & 2033
- Figure 31: Europe Air Bag Suspension Revenue (undefined), by Types 2025 & 2033
- Figure 32: Europe Air Bag Suspension Volume (K), by Types 2025 & 2033
- Figure 33: Europe Air Bag Suspension Revenue Share (%), by Types 2025 & 2033
- Figure 34: Europe Air Bag Suspension Volume Share (%), by Types 2025 & 2033
- Figure 35: Europe Air Bag Suspension Revenue (undefined), by Country 2025 & 2033
- Figure 36: Europe Air Bag Suspension Volume (K), by Country 2025 & 2033
- Figure 37: Europe Air Bag Suspension Revenue Share (%), by Country 2025 & 2033
- Figure 38: Europe Air Bag Suspension Volume Share (%), by Country 2025 & 2033
- Figure 39: Middle East & Africa Air Bag Suspension Revenue (undefined), by Application 2025 & 2033
- Figure 40: Middle East & Africa Air Bag Suspension Volume (K), by Application 2025 & 2033
- Figure 41: Middle East & Africa Air Bag Suspension Revenue Share (%), by Application 2025 & 2033
- Figure 42: Middle East & Africa Air Bag Suspension Volume Share (%), by Application 2025 & 2033
- Figure 43: Middle East & Africa Air Bag Suspension Revenue (undefined), by Types 2025 & 2033
- Figure 44: Middle East & Africa Air Bag Suspension Volume (K), by Types 2025 & 2033
- Figure 45: Middle East & Africa Air Bag Suspension Revenue Share (%), by Types 2025 & 2033
- Figure 46: Middle East & Africa Air Bag Suspension Volume Share (%), by Types 2025 & 2033
- Figure 47: Middle East & Africa Air Bag Suspension Revenue (undefined), by Country 2025 & 2033
- Figure 48: Middle East & Africa Air Bag Suspension Volume (K), by Country 2025 & 2033
- Figure 49: Middle East & Africa Air Bag Suspension Revenue Share (%), by Country 2025 & 2033
- Figure 50: Middle East & Africa Air Bag Suspension Volume Share (%), by Country 2025 & 2033
- Figure 51: Asia Pacific Air Bag Suspension Revenue (undefined), by Application 2025 & 2033
- Figure 52: Asia Pacific Air Bag Suspension Volume (K), by Application 2025 & 2033
- Figure 53: Asia Pacific Air Bag Suspension Revenue Share (%), by Application 2025 & 2033
- Figure 54: Asia Pacific Air Bag Suspension Volume Share (%), by Application 2025 & 2033
- Figure 55: Asia Pacific Air Bag Suspension Revenue (undefined), by Types 2025 & 2033
- Figure 56: Asia Pacific Air Bag Suspension Volume (K), by Types 2025 & 2033
- Figure 57: Asia Pacific Air Bag Suspension Revenue Share (%), by Types 2025 & 2033
- Figure 58: Asia Pacific Air Bag Suspension Volume Share (%), by Types 2025 & 2033
- Figure 59: Asia Pacific Air Bag Suspension Revenue (undefined), by Country 2025 & 2033
- Figure 60: Asia Pacific Air Bag Suspension Volume (K), by Country 2025 & 2033
- Figure 61: Asia Pacific Air Bag Suspension Revenue Share (%), by Country 2025 & 2033
- Figure 62: Asia Pacific Air Bag Suspension Volume Share (%), by Country 2025 & 2033
List of Tables
- Table 1: Global Air Bag Suspension Revenue undefined Forecast, by Application 2020 & 2033
- Table 2: Global Air Bag Suspension Volume K Forecast, by Application 2020 & 2033
- Table 3: Global Air Bag Suspension Revenue undefined Forecast, by Types 2020 & 2033
- Table 4: Global Air Bag Suspension Volume K Forecast, by Types 2020 & 2033
- Table 5: Global Air Bag Suspension Revenue undefined Forecast, by Region 2020 & 2033
- Table 6: Global Air Bag Suspension Volume K Forecast, by Region 2020 & 2033
- Table 7: Global Air Bag Suspension Revenue undefined Forecast, by Application 2020 & 2033
- Table 8: Global Air Bag Suspension Volume K Forecast, by Application 2020 & 2033
- Table 9: Global Air Bag Suspension Revenue undefined Forecast, by Types 2020 & 2033
- Table 10: Global Air Bag Suspension Volume K Forecast, by Types 2020 & 2033
- Table 11: Global Air Bag Suspension Revenue undefined Forecast, by Country 2020 & 2033
- Table 12: Global Air Bag Suspension Volume K Forecast, by Country 2020 & 2033
- Table 13: United States Air Bag Suspension Revenue (undefined) Forecast, by Application 2020 & 2033
- Table 14: United States Air Bag Suspension Volume (K) Forecast, by Application 2020 & 2033
- Table 15: Canada Air Bag Suspension Revenue (undefined) Forecast, by Application 2020 & 2033
- Table 16: Canada Air Bag Suspension Volume (K) Forecast, by Application 2020 & 2033
- Table 17: Mexico Air Bag Suspension Revenue (undefined) Forecast, by Application 2020 & 2033
- Table 18: Mexico Air Bag Suspension Volume (K) Forecast, by Application 2020 & 2033
- Table 19: Global Air Bag Suspension Revenue undefined Forecast, by Application 2020 & 2033
- Table 20: Global Air Bag Suspension Volume K Forecast, by Application 2020 & 2033
- Table 21: Global Air Bag Suspension Revenue undefined Forecast, by Types 2020 & 2033
- Table 22: Global Air Bag Suspension Volume K Forecast, by Types 2020 & 2033
- Table 23: Global Air Bag Suspension Revenue undefined Forecast, by Country 2020 & 2033
- Table 24: Global Air Bag Suspension Volume K Forecast, by Country 2020 & 2033
- Table 25: Brazil Air Bag Suspension Revenue (undefined) Forecast, by Application 2020 & 2033
- Table 26: Brazil Air Bag Suspension Volume (K) Forecast, by Application 2020 & 2033
- Table 27: Argentina Air Bag Suspension Revenue (undefined) Forecast, by Application 2020 & 2033
- Table 28: Argentina Air Bag Suspension Volume (K) Forecast, by Application 2020 & 2033
- Table 29: Rest of South America Air Bag Suspension Revenue (undefined) Forecast, by Application 2020 & 2033
- Table 30: Rest of South America Air Bag Suspension Volume (K) Forecast, by Application 2020 & 2033
- Table 31: Global Air Bag Suspension Revenue undefined Forecast, by Application 2020 & 2033
- Table 32: Global Air Bag Suspension Volume K Forecast, by Application 2020 & 2033
- Table 33: Global Air Bag Suspension Revenue undefined Forecast, by Types 2020 & 2033
- Table 34: Global Air Bag Suspension Volume K Forecast, by Types 2020 & 2033
- Table 35: Global Air Bag Suspension Revenue undefined Forecast, by Country 2020 & 2033
- Table 36: Global Air Bag Suspension Volume K Forecast, by Country 2020 & 2033
- Table 37: United Kingdom Air Bag Suspension Revenue (undefined) Forecast, by Application 2020 & 2033
- Table 38: United Kingdom Air Bag Suspension Volume (K) Forecast, by Application 2020 & 2033
- Table 39: Germany Air Bag Suspension Revenue (undefined) Forecast, by Application 2020 & 2033
- Table 40: Germany Air Bag Suspension Volume (K) Forecast, by Application 2020 & 2033
- Table 41: France Air Bag Suspension Revenue (undefined) Forecast, by Application 2020 & 2033
- Table 42: France Air Bag Suspension Volume (K) Forecast, by Application 2020 & 2033
- Table 43: Italy Air Bag Suspension Revenue (undefined) Forecast, by Application 2020 & 2033
- Table 44: Italy Air Bag Suspension Volume (K) Forecast, by Application 2020 & 2033
- Table 45: Spain Air Bag Suspension Revenue (undefined) Forecast, by Application 2020 & 2033
- Table 46: Spain Air Bag Suspension Volume (K) Forecast, by Application 2020 & 2033
- Table 47: Russia Air Bag Suspension Revenue (undefined) Forecast, by Application 2020 & 2033
- Table 48: Russia Air Bag Suspension Volume (K) Forecast, by Application 2020 & 2033
- Table 49: Benelux Air Bag Suspension Revenue (undefined) Forecast, by Application 2020 & 2033
- Table 50: Benelux Air Bag Suspension Volume (K) Forecast, by Application 2020 & 2033
- Table 51: Nordics Air Bag Suspension Revenue (undefined) Forecast, by Application 2020 & 2033
- Table 52: Nordics Air Bag Suspension Volume (K) Forecast, by Application 2020 & 2033
- Table 53: Rest of Europe Air Bag Suspension Revenue (undefined) Forecast, by Application 2020 & 2033
- Table 54: Rest of Europe Air Bag Suspension Volume (K) Forecast, by Application 2020 & 2033
- Table 55: Global Air Bag Suspension Revenue undefined Forecast, by Application 2020 & 2033
- Table 56: Global Air Bag Suspension Volume K Forecast, by Application 2020 & 2033
- Table 57: Global Air Bag Suspension Revenue undefined Forecast, by Types 2020 & 2033
- Table 58: Global Air Bag Suspension Volume K Forecast, by Types 2020 & 2033
- Table 59: Global Air Bag Suspension Revenue undefined Forecast, by Country 2020 & 2033
- Table 60: Global Air Bag Suspension Volume K Forecast, by Country 2020 & 2033
- Table 61: Turkey Air Bag Suspension Revenue (undefined) Forecast, by Application 2020 & 2033
- Table 62: Turkey Air Bag Suspension Volume (K) Forecast, by Application 2020 & 2033
- Table 63: Israel Air Bag Suspension Revenue (undefined) Forecast, by Application 2020 & 2033
- Table 64: Israel Air Bag Suspension Volume (K) Forecast, by Application 2020 & 2033
- Table 65: GCC Air Bag Suspension Revenue (undefined) Forecast, by Application 2020 & 2033
- Table 66: GCC Air Bag Suspension Volume (K) Forecast, by Application 2020 & 2033
- Table 67: North Africa Air Bag Suspension Revenue (undefined) Forecast, by Application 2020 & 2033
- Table 68: North Africa Air Bag Suspension Volume (K) Forecast, by Application 2020 & 2033
- Table 69: South Africa Air Bag Suspension Revenue (undefined) Forecast, by Application 2020 & 2033
- Table 70: South Africa Air Bag Suspension Volume (K) Forecast, by Application 2020 & 2033
- Table 71: Rest of Middle East & Africa Air Bag Suspension Revenue (undefined) Forecast, by Application 2020 & 2033
- Table 72: Rest of Middle East & Africa Air Bag Suspension Volume (K) Forecast, by Application 2020 & 2033
- Table 73: Global Air Bag Suspension Revenue undefined Forecast, by Application 2020 & 2033
- Table 74: Global Air Bag Suspension Volume K Forecast, by Application 2020 & 2033
- Table 75: Global Air Bag Suspension Revenue undefined Forecast, by Types 2020 & 2033
- Table 76: Global Air Bag Suspension Volume K Forecast, by Types 2020 & 2033
- Table 77: Global Air Bag Suspension Revenue undefined Forecast, by Country 2020 & 2033
- Table 78: Global Air Bag Suspension Volume K Forecast, by Country 2020 & 2033
- Table 79: China Air Bag Suspension Revenue (undefined) Forecast, by Application 2020 & 2033
- Table 80: China Air Bag Suspension Volume (K) Forecast, by Application 2020 & 2033
- Table 81: India Air Bag Suspension Revenue (undefined) Forecast, by Application 2020 & 2033
- Table 82: India Air Bag Suspension Volume (K) Forecast, by Application 2020 & 2033
- Table 83: Japan Air Bag Suspension Revenue (undefined) Forecast, by Application 2020 & 2033
- Table 84: Japan Air Bag Suspension Volume (K) Forecast, by Application 2020 & 2033
- Table 85: South Korea Air Bag Suspension Revenue (undefined) Forecast, by Application 2020 & 2033
- Table 86: South Korea Air Bag Suspension Volume (K) Forecast, by Application 2020 & 2033
- Table 87: ASEAN Air Bag Suspension Revenue (undefined) Forecast, by Application 2020 & 2033
- Table 88: ASEAN Air Bag Suspension Volume (K) Forecast, by Application 2020 & 2033
- Table 89: Oceania Air Bag Suspension Revenue (undefined) Forecast, by Application 2020 & 2033
- Table 90: Oceania Air Bag Suspension Volume (K) Forecast, by Application 2020 & 2033
- Table 91: Rest of Asia Pacific Air Bag Suspension Revenue (undefined) Forecast, by Application 2020 & 2033
- Table 92: Rest of Asia Pacific Air Bag Suspension Volume (K) Forecast, by Application 2020 & 2033
Frequently Asked Questions
1. What is the projected Compound Annual Growth Rate (CAGR) of the Air Bag Suspension?
The projected CAGR is approximately 6.5%.
2. Which companies are prominent players in the Air Bag Suspension?
Key companies in the market include Continental, Vibracoustic, Bridgestone, Aktas, Toyo Tire & Rubber, Sumitomo Electric, Senho, Yitao Qianchao, ITT Enidine, Zhuzhou Times, Mei Chen Technology, Stemco, GaoMate, Dunlop, GMT Rubber-Metal-Technic, Air Lift Company.
3. What are the main segments of the Air Bag Suspension?
The market segments include Application, Types.
4. Can you provide details about the market size?
The market size is estimated to be USD XXX N/A as of 2022.
5. What are some drivers contributing to market growth?
N/A
6. What are the notable trends driving market growth?
N/A
7. Are there any restraints impacting market growth?
N/A
8. Can you provide examples of recent developments in the market?
N/A
9. What pricing options are available for accessing the report?
Pricing options include single-user, multi-user, and enterprise licenses priced at USD 3350.00, USD 5025.00, and USD 6700.00 respectively.
10. Is the market size provided in terms of value or volume?
The market size is provided in terms of value, measured in N/A and volume, measured in K.
11. Are there any specific market keywords associated with the report?
Yes, the market keyword associated with the report is "Air Bag Suspension," which aids in identifying and referencing the specific market segment covered.
12. How do I determine which pricing option suits my needs best?
The pricing options vary based on user requirements and access needs. Individual users may opt for single-user licenses, while businesses requiring broader access may choose multi-user or enterprise licenses for cost-effective access to the report.
13. Are there any additional resources or data provided in the Air Bag Suspension report?
While the report offers comprehensive insights, it's advisable to review the specific contents or supplementary materials provided to ascertain if additional resources or data are available.
14. How can I stay updated on further developments or reports in the Air Bag Suspension?
To stay informed about further developments, trends, and reports in the Air Bag Suspension, consider subscribing to industry newsletters, following relevant companies and organizations, or regularly checking reputable industry news sources and publications.
Methodology
Step 1 - Identification of Relevant Samples Size from Population Database


Step 2 - Approaches for Defining Global Market Size (Value, Volume* & Price*)

Note*: In applicable scenarios
Step 3 - Data Sources
Primary Research
- Web Analytics
- Survey Reports
- Research Institute
- Latest Research Reports
- Opinion Leaders
Secondary Research
- Annual Reports
- White Paper
- Latest Press Release
- Industry Association
- Paid Database
- Investor Presentations

Step 4 - Data Triangulation
Involves using different sources of information in order to increase the validity of a study
These sources are likely to be stakeholders in a program - participants, other researchers, program staff, other community members, and so on.
Then we put all data in single framework & apply various statistical tools to find out the dynamic on the market.
During the analysis stage, feedback from the stakeholder groups would be compared to determine areas of agreement as well as areas of divergence