

Key Insights
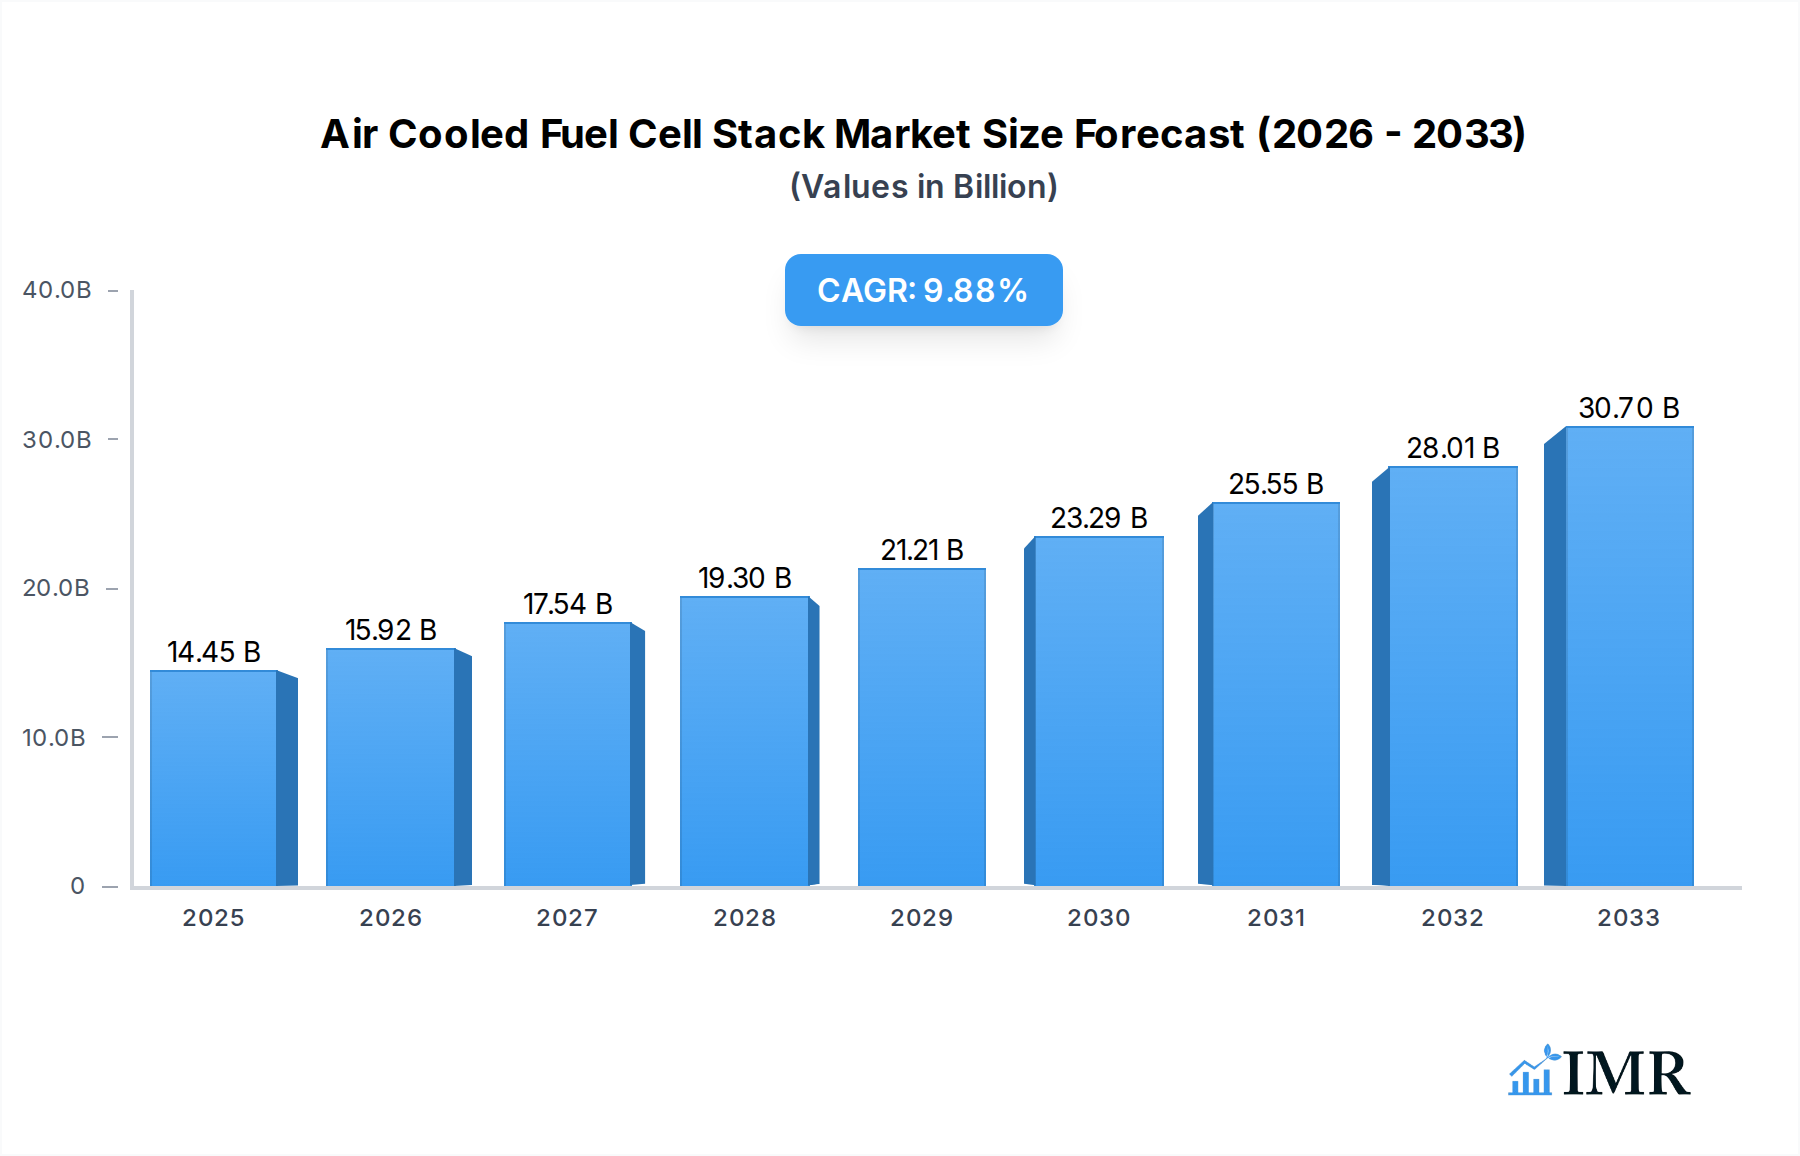
The global air-cooled fuel cell stack market is projected for substantial expansion, fueled by the escalating demand for clean energy and continuous innovation in fuel cell technology. Anticipated to reach between $14.45 billion by 2025, this segment is driven by its inherent advantages, including a more straightforward design and reduced manufacturing expenses compared to liquid-cooled alternatives. These benefits make air-cooled stacks highly desirable for a diverse range of applications such as stationary power generation, material handling equipment, and emerging uses in smaller-scale transportation like delivery drones and light electric vehicles. The market is actively evolving towards higher power density and enhanced durability, with ongoing research and development efforts concentrated on improving performance and lowering overall production costs. Leading companies including Ballard and Intelligent Energy are making significant investments in optimizing air-cooled stack designs to secure a greater market share.

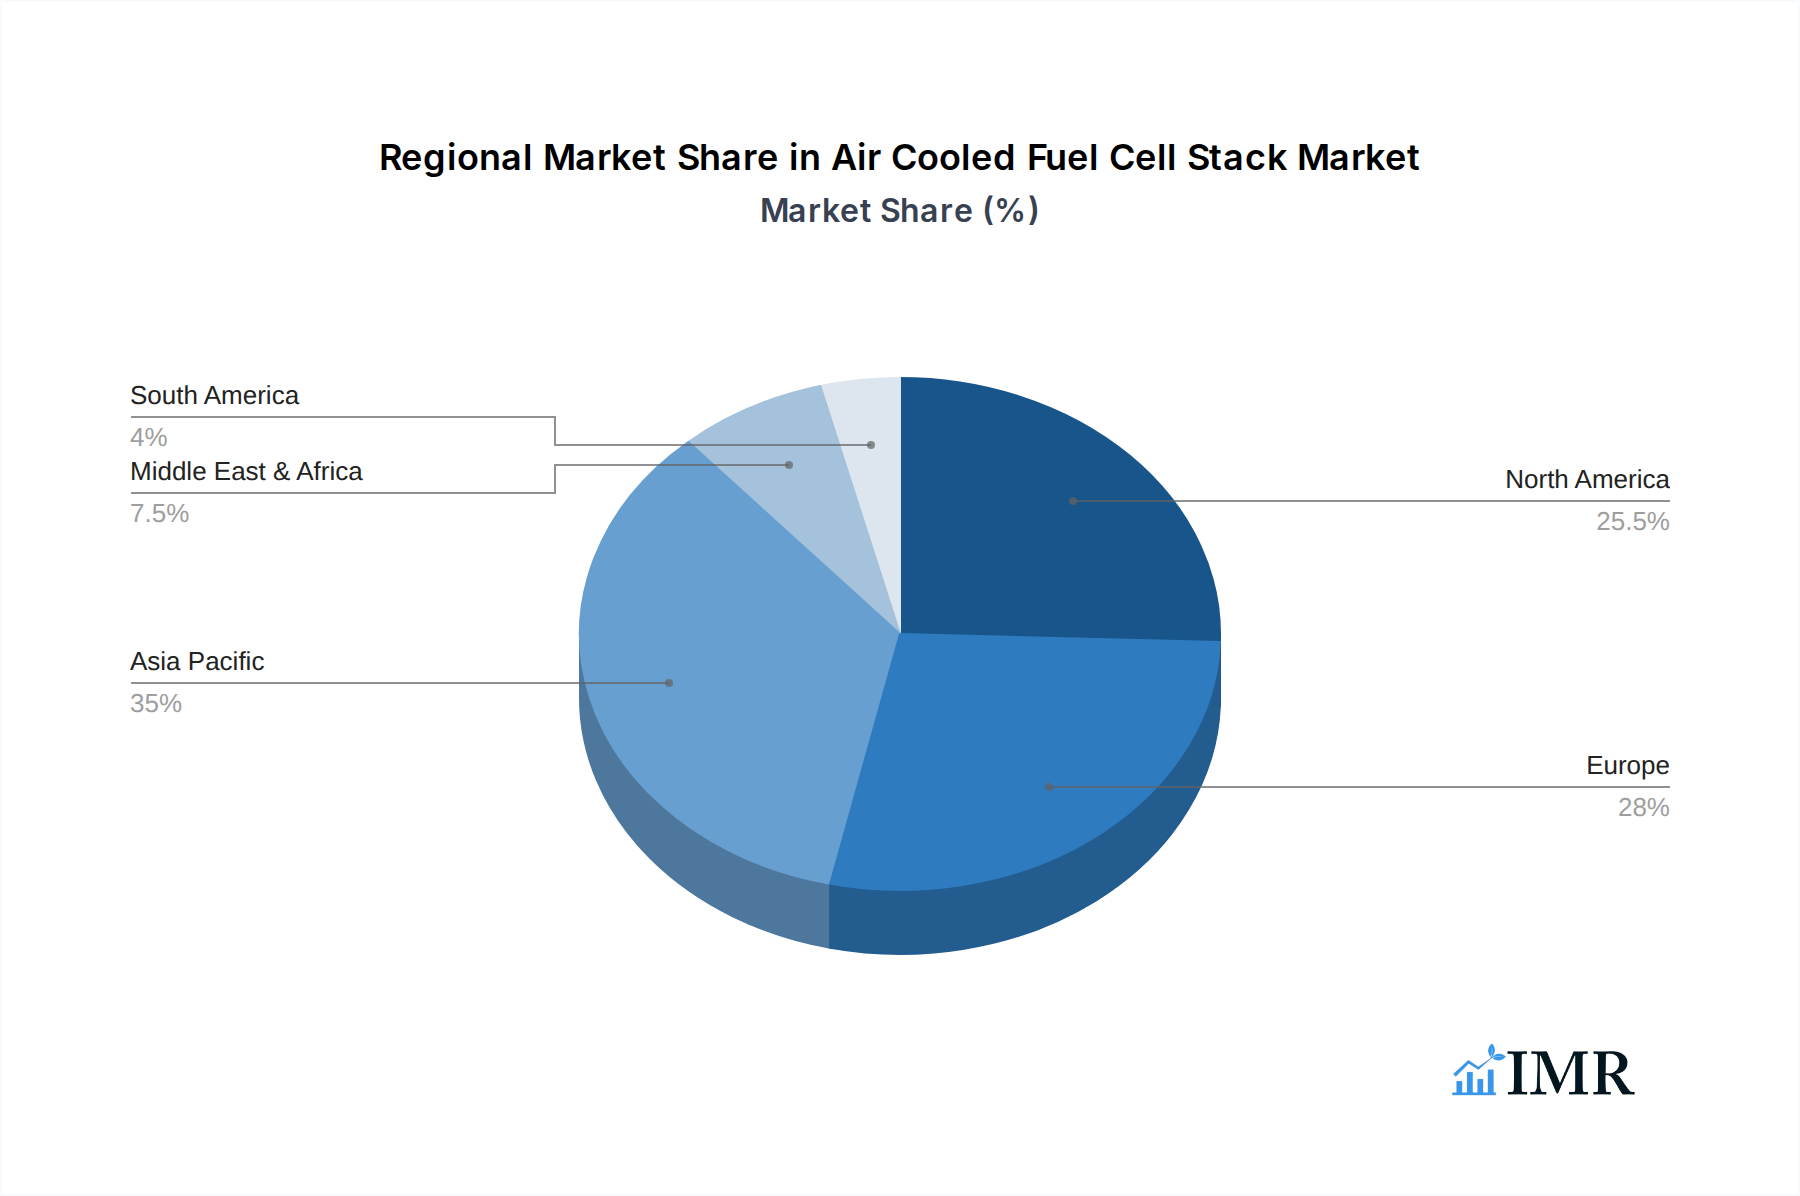
Air Cooled Fuel Cell Stack Market Size (In Billion)
The market's growth trajectory is expected to maintain strong momentum through the forecast period (2025-2033), with an estimated Compound Annual Growth Rate (CAGR) of 10.48%. This expansion is supported by favorable government policies advocating for renewable energy adoption and declining hydrogen production costs. Key challenges persist, notably high initial capital investment and the necessity for comprehensive infrastructure to support widespread hydrogen refueling. Nonetheless, advancements in materials science and manufacturing processes are paving the way for more efficient and cost-effective air-cooled fuel cell stacks, facilitating broader commercial adoption and contributing to a sustainable energy future. Market segmentation is primarily defined by application (stationary power, transportation, portable power) and geographic region. North America and Europe currently lead market share, with significant growth potential identified in the Asia-Pacific region due to increasing governmental support and industrialization.
Air Cooled Fuel Cell Stack Company Market Share
Air Cooled Fuel Cell Stack Market Report: 2019-2033
This comprehensive report provides an in-depth analysis of the air cooled fuel cell stack market, encompassing market dynamics, growth trends, regional insights, product landscape, and key players. The study period covers 2019-2033, with 2025 as the base and estimated year. The forecast period extends from 2025 to 2033, and the historical period analyzed is 2019-2024. This report is crucial for industry professionals, investors, and strategists seeking a complete understanding of this rapidly evolving market. The parent market is the broader fuel cell market (valued at xx million units in 2025), and the child market is specifically air-cooled fuel cell stacks within the transportation, stationary power, and portable power sectors.
Air Cooled Fuel Cell Stack Market Dynamics & Structure
The air cooled fuel cell stack market is characterized by moderate concentration, with several key players vying for market share. Technological innovation, driven by advancements in membrane electrode assemblies (MEAs) and catalysts, is a significant driver, alongside increasingly stringent environmental regulations promoting cleaner energy solutions. Competitive substitutes include batteries and internal combustion engines, but fuel cells offer superior energy density and efficiency in specific applications. End-user demographics are diverse, encompassing automotive, industrial, and portable power sectors. M&A activity has been relatively modest, with xx deals recorded between 2019 and 2024, representing a total value of xx million units.
- Market Concentration: Moderately concentrated, with top 5 players holding approximately xx% market share in 2025.
- Technological Innovation: Focus on improving durability, reducing costs, and enhancing efficiency of MEAs and catalysts.
- Regulatory Framework: Stringent emission standards in several regions are driving adoption.
- Competitive Substitutes: Batteries (primarily for portable and some automotive applications) and internal combustion engines (especially in heavy-duty applications)
- End-User Demographics: Automotive, stationary power generation, portable power devices, material handling equipment.
- M&A Trends: xx deals between 2019-2024, indicating strategic consolidation and expansion within the sector.
Air Cooled Fuel Cell Stack Growth Trends & Insights
The air cooled fuel cell stack market is projected to experience significant growth over the forecast period, driven by increasing demand for clean energy solutions and technological advancements. The market size is estimated at xx million units in 2025 and is expected to reach xx million units by 2033, registering a CAGR of xx% during the forecast period. This growth is fueled by rising adoption rates across various sectors, particularly in automotive and stationary power applications. Technological disruptions, such as the development of higher-efficiency MEAs and improved thermal management systems, are further accelerating market expansion. Consumer behavior is shifting towards environmentally friendly technologies, boosting demand for air-cooled fuel cell stacks. Market penetration is projected to increase from xx% in 2025 to xx% in 2033. Increased government incentives and supportive policies in several key regions are further bolstering market expansion.
Dominant Regions, Countries, or Segments in Air Cooled Fuel Cell Stack
The North American region is currently the leading market for air cooled fuel cell stacks, owing to robust government support for fuel cell technology, well-established infrastructure, and a strong presence of key players. However, Asia-Pacific is poised for rapid growth, driven by increasing industrialization and government initiatives promoting clean energy in countries like China and Japan. The automotive segment represents the largest share of the market, driven by the rising demand for electric and fuel-cell hybrid vehicles.
- Key Drivers in North America: Strong government support through grants and tax incentives, robust R&D activities, and presence of major automotive manufacturers.
- Key Drivers in Asia-Pacific: Rapid industrialization, increasing environmental concerns, and government initiatives promoting renewable energy sources.
- Automotive Segment Dominance: High demand for fuel-cell electric vehicles (FCEVs) and hybrid electric vehicles (HEVs) is driving significant growth.
- Market Share: North America holds approximately xx% market share in 2025, while Asia-Pacific is projected to reach xx% by 2033.
Air Cooled Fuel Cell Stack Product Landscape
Air cooled fuel cell stacks are characterized by varying power outputs, ranging from a few kilowatts to several megawatts, catering to diverse applications. Recent innovations include the development of more durable and efficient MEAs, improved thermal management systems for enhanced performance, and compact designs for space-constrained applications. Unique selling propositions include high energy efficiency, low emissions, and reliable power generation. Technological advancements are focused on reducing costs, enhancing durability, and broadening applications to encompass diverse sectors.
Key Drivers, Barriers & Challenges in Air Cooled Fuel Cell Stack
Key Drivers:
- Growing demand for clean energy solutions due to stringent environmental regulations.
- Technological advancements leading to improved efficiency, durability, and reduced costs.
- Increasing government support through subsidies and incentives for fuel cell technology.
Key Barriers & Challenges:
- High initial investment costs associated with fuel cell stack manufacturing and deployment.
- Limited availability and high cost of hydrogen fuel infrastructure, hindering widespread adoption.
- Competition from alternative energy technologies like batteries and internal combustion engines.
- Supply chain vulnerabilities related to critical materials (e.g., platinum group metals). This issue contributes to an estimated xx million units loss in potential market value annually.
Emerging Opportunities in Air Cooled Fuel Cell Stack
Emerging opportunities exist in untapped markets like distributed generation for remote areas and backup power for critical infrastructure. Innovative applications in material handling equipment, drones, and portable electronic devices are gaining traction. Evolving consumer preferences towards sustainable products are further driving demand.
Growth Accelerators in the Air Cooled Fuel Cell Stack Industry
Technological breakthroughs in MEA technology, including improved catalysts and membrane materials, are accelerating market growth. Strategic partnerships between fuel cell manufacturers and automotive companies are fostering innovation and facilitating market penetration. Expanding market applications into diverse sectors, such as stationary power generation and portable power devices, are creating new growth avenues.
Key Players Shaping the Air Cooled Fuel Cell Stack Market
- Intelligent Energy
- Ballard
- Hydrogenics
- PowerCell
- Nedstack
- Horizon Fuel Cell Technologies
- Dana Incorporated
- balticFuelCells
- Nissan
- Schunk Bahn-und Industrietechnik
- Toyota
- Shanghai Sinofuelcell
- Sinosynergy Power
- Edelman Hydrogen Energy Equipment
- Zhungeer Banner Hydrogen Plastic Technology
- Clenergy(xiamen)Technology
- Lanzhou Greatwall Electrica
- Sunrise Power
- VISION
- Wuhan Troowin Power System Technology
- Shanghai JieHydrogen Technology
Notable Milestones in Air Cooled Fuel Cell Stack Sector
- 2020: Several major automotive manufacturers announced plans to integrate fuel cell technology into their vehicle lineups.
- 2022: Significant advancements in MEA technology resulted in improved efficiency and durability of air cooled fuel cell stacks.
- 2023: Government initiatives in several countries provided substantial funding for fuel cell research and development.
In-Depth Air Cooled Fuel Cell Stack Market Outlook
The future of the air cooled fuel cell stack market appears bright, fueled by continuous technological innovation, increasing government support, and growing environmental awareness. Strategic partnerships and market expansion into new applications will play a crucial role in driving long-term growth. The market is expected to witness substantial expansion over the next decade, with significant opportunities for industry players to capitalize on the rising demand for clean and efficient energy solutions.
Air Cooled Fuel Cell Stack Segmentation
-
1. Application
- 1.1. Commercial Vehicle
- 1.2. Passenger Vehicle
-
2. Types
- 2.1. Below 80 KW
- 2.2. 80 KW-120 KW
- 2.3. Above 120 KW
Air Cooled Fuel Cell Stack Segmentation By Geography
-
1. North America
- 1.1. United States
- 1.2. Canada
- 1.3. Mexico
-
2. South America
- 2.1. Brazil
- 2.2. Argentina
- 2.3. Rest of South America
-
3. Europe
- 3.1. United Kingdom
- 3.2. Germany
- 3.3. France
- 3.4. Italy
- 3.5. Spain
- 3.6. Russia
- 3.7. Benelux
- 3.8. Nordics
- 3.9. Rest of Europe
-
4. Middle East & Africa
- 4.1. Turkey
- 4.2. Israel
- 4.3. GCC
- 4.4. North Africa
- 4.5. South Africa
- 4.6. Rest of Middle East & Africa
-
5. Asia Pacific
- 5.1. China
- 5.2. India
- 5.3. Japan
- 5.4. South Korea
- 5.5. ASEAN
- 5.6. Oceania
- 5.7. Rest of Asia Pacific
Air Cooled Fuel Cell Stack Regional Market Share
Geographic Coverage of Air Cooled Fuel Cell Stack
Air Cooled Fuel Cell Stack REPORT HIGHLIGHTS
| Aspects | Details |
|---|---|
| Study Period | 2020-2034 |
| Base Year | 2025 |
| Estimated Year | 2026 |
| Forecast Period | 2026-2034 |
| Historical Period | 2020-2025 |
| Growth Rate | CAGR of 10.48% from 2020-2034 |
| Segmentation |
|
Table of Contents
- 1. Introduction
- 1.1. Research Scope
- 1.2. Market Segmentation
- 1.3. Research Objective
- 1.4. Definitions and Assumptions
- 2. Executive Summary
- 2.1. Market Snapshot
- 3. Market Dynamics
- 3.1. Market Drivers
- 3.2. Market Restrains
- 3.3. Market Trends
- 3.4. Market Opportunities
- 4. Market Factor Analysis
- 4.1. Porters Five Forces
- 4.1.1. Bargaining Power of Suppliers
- 4.1.2. Bargaining Power of Buyers
- 4.1.3. Threat of New Entrants
- 4.1.4. Threat of Substitutes
- 4.1.5. Competitive Rivalry
- 4.2. PESTEL analysis
- 4.3. BCG Analysis
- 4.3.1. Stars (High Growth, High Market Share)
- 4.3.2. Cash Cows (Low Growth, High Market Share)
- 4.3.3. Question Mark (High Growth, Low Market Share)
- 4.3.4. Dogs (Low Growth, Low Market Share)
- 4.4. Ansoff Matrix Analysis
- 4.5. Supply Chain Analysis
- 4.6. Regulatory Landscape
- 4.7. Current Market Potential and Opportunity Assessment (TAM–SAM–SOM Framework)
- 4.8. IMR Analyst Note
- 4.1. Porters Five Forces
- 5. Market Analysis, Insights and Forecast 2021-2033
- 5.1. Market Analysis, Insights and Forecast - by Application
- 5.1.1. Commercial Vehicle
- 5.1.2. Passenger Vehicle
- 5.2. Market Analysis, Insights and Forecast - by Types
- 5.2.1. Below 80 KW
- 5.2.2. 80 KW-120 KW
- 5.2.3. Above 120 KW
- 5.3. Market Analysis, Insights and Forecast - by Region
- 5.3.1. North America
- 5.3.2. South America
- 5.3.3. Europe
- 5.3.4. Middle East & Africa
- 5.3.5. Asia Pacific
- 5.1. Market Analysis, Insights and Forecast - by Application
- 6. Global Air Cooled Fuel Cell Stack Analysis, Insights and Forecast, 2021-2033
- 6.1. Market Analysis, Insights and Forecast - by Application
- 6.1.1. Commercial Vehicle
- 6.1.2. Passenger Vehicle
- 6.2. Market Analysis, Insights and Forecast - by Types
- 6.2.1. Below 80 KW
- 6.2.2. 80 KW-120 KW
- 6.2.3. Above 120 KW
- 6.1. Market Analysis, Insights and Forecast - by Application
- 7. North America Air Cooled Fuel Cell Stack Analysis, Insights and Forecast, 2020-2032
- 7.1. Market Analysis, Insights and Forecast - by Application
- 7.1.1. Commercial Vehicle
- 7.1.2. Passenger Vehicle
- 7.2. Market Analysis, Insights and Forecast - by Types
- 7.2.1. Below 80 KW
- 7.2.2. 80 KW-120 KW
- 7.2.3. Above 120 KW
- 7.1. Market Analysis, Insights and Forecast - by Application
- 8. South America Air Cooled Fuel Cell Stack Analysis, Insights and Forecast, 2020-2032
- 8.1. Market Analysis, Insights and Forecast - by Application
- 8.1.1. Commercial Vehicle
- 8.1.2. Passenger Vehicle
- 8.2. Market Analysis, Insights and Forecast - by Types
- 8.2.1. Below 80 KW
- 8.2.2. 80 KW-120 KW
- 8.2.3. Above 120 KW
- 8.1. Market Analysis, Insights and Forecast - by Application
- 9. Europe Air Cooled Fuel Cell Stack Analysis, Insights and Forecast, 2020-2032
- 9.1. Market Analysis, Insights and Forecast - by Application
- 9.1.1. Commercial Vehicle
- 9.1.2. Passenger Vehicle
- 9.2. Market Analysis, Insights and Forecast - by Types
- 9.2.1. Below 80 KW
- 9.2.2. 80 KW-120 KW
- 9.2.3. Above 120 KW
- 9.1. Market Analysis, Insights and Forecast - by Application
- 10. Middle East & Africa Air Cooled Fuel Cell Stack Analysis, Insights and Forecast, 2020-2032
- 10.1. Market Analysis, Insights and Forecast - by Application
- 10.1.1. Commercial Vehicle
- 10.1.2. Passenger Vehicle
- 10.2. Market Analysis, Insights and Forecast - by Types
- 10.2.1. Below 80 KW
- 10.2.2. 80 KW-120 KW
- 10.2.3. Above 120 KW
- 10.1. Market Analysis, Insights and Forecast - by Application
- 11. Asia Pacific Air Cooled Fuel Cell Stack Analysis, Insights and Forecast, 2020-2032
- 11.1. Market Analysis, Insights and Forecast - by Application
- 11.1.1. Commercial Vehicle
- 11.1.2. Passenger Vehicle
- 11.2. Market Analysis, Insights and Forecast - by Types
- 11.2.1. Below 80 KW
- 11.2.2. 80 KW-120 KW
- 11.2.3. Above 120 KW
- 11.1. Market Analysis, Insights and Forecast - by Application
- 12. Competitive Analysis
- 12.1. Company Profiles
- 12.1.1 Intelligent Energy
- 12.1.1.1. Company Overview
- 12.1.1.2. Products
- 12.1.1.3. Company Financials
- 12.1.1.4. SWOT Analysis
- 12.1.2 Ballard
- 12.1.2.1. Company Overview
- 12.1.2.2. Products
- 12.1.2.3. Company Financials
- 12.1.2.4. SWOT Analysis
- 12.1.3 Hydrogenics
- 12.1.3.1. Company Overview
- 12.1.3.2. Products
- 12.1.3.3. Company Financials
- 12.1.3.4. SWOT Analysis
- 12.1.4 PowerCell
- 12.1.4.1. Company Overview
- 12.1.4.2. Products
- 12.1.4.3. Company Financials
- 12.1.4.4. SWOT Analysis
- 12.1.5 Nedstack
- 12.1.5.1. Company Overview
- 12.1.5.2. Products
- 12.1.5.3. Company Financials
- 12.1.5.4. SWOT Analysis
- 12.1.6 Horizon Fuel Cell Technologies
- 12.1.6.1. Company Overview
- 12.1.6.2. Products
- 12.1.6.3. Company Financials
- 12.1.6.4. SWOT Analysis
- 12.1.7 Dana Incorporated
- 12.1.7.1. Company Overview
- 12.1.7.2. Products
- 12.1.7.3. Company Financials
- 12.1.7.4. SWOT Analysis
- 12.1.8 balticFuelCells
- 12.1.8.1. Company Overview
- 12.1.8.2. Products
- 12.1.8.3. Company Financials
- 12.1.8.4. SWOT Analysis
- 12.1.9 Nissan
- 12.1.9.1. Company Overview
- 12.1.9.2. Products
- 12.1.9.3. Company Financials
- 12.1.9.4. SWOT Analysis
- 12.1.10 Schunk Bahn-und Industrietechnik
- 12.1.10.1. Company Overview
- 12.1.10.2. Products
- 12.1.10.3. Company Financials
- 12.1.10.4. SWOT Analysis
- 12.1.11 Toyota
- 12.1.11.1. Company Overview
- 12.1.11.2. Products
- 12.1.11.3. Company Financials
- 12.1.11.4. SWOT Analysis
- 12.1.12 Shanghai Sinofuelcell
- 12.1.12.1. Company Overview
- 12.1.12.2. Products
- 12.1.12.3. Company Financials
- 12.1.12.4. SWOT Analysis
- 12.1.13 Sinosynergy Power
- 12.1.13.1. Company Overview
- 12.1.13.2. Products
- 12.1.13.3. Company Financials
- 12.1.13.4. SWOT Analysis
- 12.1.14 Edelman Hydrogen Energy Equipment
- 12.1.14.1. Company Overview
- 12.1.14.2. Products
- 12.1.14.3. Company Financials
- 12.1.14.4. SWOT Analysis
- 12.1.15 Zhungeer Banner Hydrogen Plastic Technology
- 12.1.15.1. Company Overview
- 12.1.15.2. Products
- 12.1.15.3. Company Financials
- 12.1.15.4. SWOT Analysis
- 12.1.16 Clenergy(xiamen)Technology
- 12.1.16.1. Company Overview
- 12.1.16.2. Products
- 12.1.16.3. Company Financials
- 12.1.16.4. SWOT Analysis
- 12.1.17 Lanzhou Greatwall Electrica
- 12.1.17.1. Company Overview
- 12.1.17.2. Products
- 12.1.17.3. Company Financials
- 12.1.17.4. SWOT Analysis
- 12.1.18 Sunrise Power
- 12.1.18.1. Company Overview
- 12.1.18.2. Products
- 12.1.18.3. Company Financials
- 12.1.18.4. SWOT Analysis
- 12.1.19 VISION
- 12.1.19.1. Company Overview
- 12.1.19.2. Products
- 12.1.19.3. Company Financials
- 12.1.19.4. SWOT Analysis
- 12.1.20 Wuhan Troowin Power System Technology
- 12.1.20.1. Company Overview
- 12.1.20.2. Products
- 12.1.20.3. Company Financials
- 12.1.20.4. SWOT Analysis
- 12.1.21 Shanghai JieHydrogen Technology
- 12.1.21.1. Company Overview
- 12.1.21.2. Products
- 12.1.21.3. Company Financials
- 12.1.21.4. SWOT Analysis
- 12.1.1 Intelligent Energy
- 12.2. Market Entropy
- 12.2.1 Company's Key Areas Served
- 12.2.2 Recent Developments
- 12.3. Company Market Share Analysis 2025
- 12.3.1 Top 5 Companies Market Share Analysis
- 12.3.2 Top 3 Companies Market Share Analysis
- 12.4. List of Potential Customers
- 13. Research Methodology
List of Figures
- Figure 1: Global Air Cooled Fuel Cell Stack Revenue Breakdown (billion, %) by Region 2025 & 2033
- Figure 2: North America Air Cooled Fuel Cell Stack Revenue (billion), by Application 2025 & 2033
- Figure 3: North America Air Cooled Fuel Cell Stack Revenue Share (%), by Application 2025 & 2033
- Figure 4: North America Air Cooled Fuel Cell Stack Revenue (billion), by Types 2025 & 2033
- Figure 5: North America Air Cooled Fuel Cell Stack Revenue Share (%), by Types 2025 & 2033
- Figure 6: North America Air Cooled Fuel Cell Stack Revenue (billion), by Country 2025 & 2033
- Figure 7: North America Air Cooled Fuel Cell Stack Revenue Share (%), by Country 2025 & 2033
- Figure 8: South America Air Cooled Fuel Cell Stack Revenue (billion), by Application 2025 & 2033
- Figure 9: South America Air Cooled Fuel Cell Stack Revenue Share (%), by Application 2025 & 2033
- Figure 10: South America Air Cooled Fuel Cell Stack Revenue (billion), by Types 2025 & 2033
- Figure 11: South America Air Cooled Fuel Cell Stack Revenue Share (%), by Types 2025 & 2033
- Figure 12: South America Air Cooled Fuel Cell Stack Revenue (billion), by Country 2025 & 2033
- Figure 13: South America Air Cooled Fuel Cell Stack Revenue Share (%), by Country 2025 & 2033
- Figure 14: Europe Air Cooled Fuel Cell Stack Revenue (billion), by Application 2025 & 2033
- Figure 15: Europe Air Cooled Fuel Cell Stack Revenue Share (%), by Application 2025 & 2033
- Figure 16: Europe Air Cooled Fuel Cell Stack Revenue (billion), by Types 2025 & 2033
- Figure 17: Europe Air Cooled Fuel Cell Stack Revenue Share (%), by Types 2025 & 2033
- Figure 18: Europe Air Cooled Fuel Cell Stack Revenue (billion), by Country 2025 & 2033
- Figure 19: Europe Air Cooled Fuel Cell Stack Revenue Share (%), by Country 2025 & 2033
- Figure 20: Middle East & Africa Air Cooled Fuel Cell Stack Revenue (billion), by Application 2025 & 2033
- Figure 21: Middle East & Africa Air Cooled Fuel Cell Stack Revenue Share (%), by Application 2025 & 2033
- Figure 22: Middle East & Africa Air Cooled Fuel Cell Stack Revenue (billion), by Types 2025 & 2033
- Figure 23: Middle East & Africa Air Cooled Fuel Cell Stack Revenue Share (%), by Types 2025 & 2033
- Figure 24: Middle East & Africa Air Cooled Fuel Cell Stack Revenue (billion), by Country 2025 & 2033
- Figure 25: Middle East & Africa Air Cooled Fuel Cell Stack Revenue Share (%), by Country 2025 & 2033
- Figure 26: Asia Pacific Air Cooled Fuel Cell Stack Revenue (billion), by Application 2025 & 2033
- Figure 27: Asia Pacific Air Cooled Fuel Cell Stack Revenue Share (%), by Application 2025 & 2033
- Figure 28: Asia Pacific Air Cooled Fuel Cell Stack Revenue (billion), by Types 2025 & 2033
- Figure 29: Asia Pacific Air Cooled Fuel Cell Stack Revenue Share (%), by Types 2025 & 2033
- Figure 30: Asia Pacific Air Cooled Fuel Cell Stack Revenue (billion), by Country 2025 & 2033
- Figure 31: Asia Pacific Air Cooled Fuel Cell Stack Revenue Share (%), by Country 2025 & 2033
List of Tables
- Table 1: Global Air Cooled Fuel Cell Stack Revenue billion Forecast, by Application 2020 & 2033
- Table 2: Global Air Cooled Fuel Cell Stack Revenue billion Forecast, by Types 2020 & 2033
- Table 3: Global Air Cooled Fuel Cell Stack Revenue billion Forecast, by Region 2020 & 2033
- Table 4: Global Air Cooled Fuel Cell Stack Revenue billion Forecast, by Application 2020 & 2033
- Table 5: Global Air Cooled Fuel Cell Stack Revenue billion Forecast, by Types 2020 & 2033
- Table 6: Global Air Cooled Fuel Cell Stack Revenue billion Forecast, by Country 2020 & 2033
- Table 7: United States Air Cooled Fuel Cell Stack Revenue (billion) Forecast, by Application 2020 & 2033
- Table 8: Canada Air Cooled Fuel Cell Stack Revenue (billion) Forecast, by Application 2020 & 2033
- Table 9: Mexico Air Cooled Fuel Cell Stack Revenue (billion) Forecast, by Application 2020 & 2033
- Table 10: Global Air Cooled Fuel Cell Stack Revenue billion Forecast, by Application 2020 & 2033
- Table 11: Global Air Cooled Fuel Cell Stack Revenue billion Forecast, by Types 2020 & 2033
- Table 12: Global Air Cooled Fuel Cell Stack Revenue billion Forecast, by Country 2020 & 2033
- Table 13: Brazil Air Cooled Fuel Cell Stack Revenue (billion) Forecast, by Application 2020 & 2033
- Table 14: Argentina Air Cooled Fuel Cell Stack Revenue (billion) Forecast, by Application 2020 & 2033
- Table 15: Rest of South America Air Cooled Fuel Cell Stack Revenue (billion) Forecast, by Application 2020 & 2033
- Table 16: Global Air Cooled Fuel Cell Stack Revenue billion Forecast, by Application 2020 & 2033
- Table 17: Global Air Cooled Fuel Cell Stack Revenue billion Forecast, by Types 2020 & 2033
- Table 18: Global Air Cooled Fuel Cell Stack Revenue billion Forecast, by Country 2020 & 2033
- Table 19: United Kingdom Air Cooled Fuel Cell Stack Revenue (billion) Forecast, by Application 2020 & 2033
- Table 20: Germany Air Cooled Fuel Cell Stack Revenue (billion) Forecast, by Application 2020 & 2033
- Table 21: France Air Cooled Fuel Cell Stack Revenue (billion) Forecast, by Application 2020 & 2033
- Table 22: Italy Air Cooled Fuel Cell Stack Revenue (billion) Forecast, by Application 2020 & 2033
- Table 23: Spain Air Cooled Fuel Cell Stack Revenue (billion) Forecast, by Application 2020 & 2033
- Table 24: Russia Air Cooled Fuel Cell Stack Revenue (billion) Forecast, by Application 2020 & 2033
- Table 25: Benelux Air Cooled Fuel Cell Stack Revenue (billion) Forecast, by Application 2020 & 2033
- Table 26: Nordics Air Cooled Fuel Cell Stack Revenue (billion) Forecast, by Application 2020 & 2033
- Table 27: Rest of Europe Air Cooled Fuel Cell Stack Revenue (billion) Forecast, by Application 2020 & 2033
- Table 28: Global Air Cooled Fuel Cell Stack Revenue billion Forecast, by Application 2020 & 2033
- Table 29: Global Air Cooled Fuel Cell Stack Revenue billion Forecast, by Types 2020 & 2033
- Table 30: Global Air Cooled Fuel Cell Stack Revenue billion Forecast, by Country 2020 & 2033
- Table 31: Turkey Air Cooled Fuel Cell Stack Revenue (billion) Forecast, by Application 2020 & 2033
- Table 32: Israel Air Cooled Fuel Cell Stack Revenue (billion) Forecast, by Application 2020 & 2033
- Table 33: GCC Air Cooled Fuel Cell Stack Revenue (billion) Forecast, by Application 2020 & 2033
- Table 34: North Africa Air Cooled Fuel Cell Stack Revenue (billion) Forecast, by Application 2020 & 2033
- Table 35: South Africa Air Cooled Fuel Cell Stack Revenue (billion) Forecast, by Application 2020 & 2033
- Table 36: Rest of Middle East & Africa Air Cooled Fuel Cell Stack Revenue (billion) Forecast, by Application 2020 & 2033
- Table 37: Global Air Cooled Fuel Cell Stack Revenue billion Forecast, by Application 2020 & 2033
- Table 38: Global Air Cooled Fuel Cell Stack Revenue billion Forecast, by Types 2020 & 2033
- Table 39: Global Air Cooled Fuel Cell Stack Revenue billion Forecast, by Country 2020 & 2033
- Table 40: China Air Cooled Fuel Cell Stack Revenue (billion) Forecast, by Application 2020 & 2033
- Table 41: India Air Cooled Fuel Cell Stack Revenue (billion) Forecast, by Application 2020 & 2033
- Table 42: Japan Air Cooled Fuel Cell Stack Revenue (billion) Forecast, by Application 2020 & 2033
- Table 43: South Korea Air Cooled Fuel Cell Stack Revenue (billion) Forecast, by Application 2020 & 2033
- Table 44: ASEAN Air Cooled Fuel Cell Stack Revenue (billion) Forecast, by Application 2020 & 2033
- Table 45: Oceania Air Cooled Fuel Cell Stack Revenue (billion) Forecast, by Application 2020 & 2033
- Table 46: Rest of Asia Pacific Air Cooled Fuel Cell Stack Revenue (billion) Forecast, by Application 2020 & 2033
Frequently Asked Questions
1. What is the projected Compound Annual Growth Rate (CAGR) of the Air Cooled Fuel Cell Stack?
The projected CAGR is approximately 10.48%.
2. Which companies are prominent players in the Air Cooled Fuel Cell Stack?
Key companies in the market include Intelligent Energy, Ballard, Hydrogenics, PowerCell, Nedstack, Horizon Fuel Cell Technologies, Dana Incorporated, balticFuelCells, Nissan, Schunk Bahn-und Industrietechnik, Toyota, Shanghai Sinofuelcell, Sinosynergy Power, Edelman Hydrogen Energy Equipment, Zhungeer Banner Hydrogen Plastic Technology, Clenergy(xiamen)Technology, Lanzhou Greatwall Electrica, Sunrise Power, VISION, Wuhan Troowin Power System Technology, Shanghai JieHydrogen Technology.
3. What are the main segments of the Air Cooled Fuel Cell Stack?
The market segments include Application, Types.
4. Can you provide details about the market size?
The market size is estimated to be USD 14.45 billion as of 2022.
5. What are some drivers contributing to market growth?
N/A
6. What are the notable trends driving market growth?
N/A
7. Are there any restraints impacting market growth?
N/A
8. Can you provide examples of recent developments in the market?
N/A
9. What pricing options are available for accessing the report?
Pricing options include single-user, multi-user, and enterprise licenses priced at USD 2900.00, USD 4350.00, and USD 5800.00 respectively.
10. Is the market size provided in terms of value or volume?
The market size is provided in terms of value, measured in billion.
11. Are there any specific market keywords associated with the report?
Yes, the market keyword associated with the report is "Air Cooled Fuel Cell Stack," which aids in identifying and referencing the specific market segment covered.
12. How do I determine which pricing option suits my needs best?
The pricing options vary based on user requirements and access needs. Individual users may opt for single-user licenses, while businesses requiring broader access may choose multi-user or enterprise licenses for cost-effective access to the report.
13. Are there any additional resources or data provided in the Air Cooled Fuel Cell Stack report?
While the report offers comprehensive insights, it's advisable to review the specific contents or supplementary materials provided to ascertain if additional resources or data are available.
14. How can I stay updated on further developments or reports in the Air Cooled Fuel Cell Stack?
To stay informed about further developments, trends, and reports in the Air Cooled Fuel Cell Stack, consider subscribing to industry newsletters, following relevant companies and organizations, or regularly checking reputable industry news sources and publications.
Methodology
Step 1 - Identification of Relevant Samples Size from Population Database


Step 2 - Approaches for Defining Global Market Size (Value, Volume* & Price*)

Note*: In applicable scenarios
Step 3 - Data Sources
Primary Research
- Web Analytics
- Survey Reports
- Research Institute
- Latest Research Reports
- Opinion Leaders
Secondary Research
- Annual Reports
- White Paper
- Latest Press Release
- Industry Association
- Paid Database
- Investor Presentations

Step 4 - Data Triangulation
Involves using different sources of information in order to increase the validity of a study
These sources are likely to be stakeholders in a program - participants, other researchers, program staff, other community members, and so on.
Then we put all data in single framework & apply various statistical tools to find out the dynamic on the market.
During the analysis stage, feedback from the stakeholder groups would be compared to determine areas of agreement as well as areas of divergence