

Key Insights
The Air Suspension ECU market is projected for significant expansion, propelled by the increasing integration of advanced driver-assistance systems (ADAS) and the growing demand for superior vehicle comfort and safety in both passenger and commercial vehicles. Key growth drivers include the higher adoption of air suspension in premium vehicles and a greater emphasis on fuel efficiency through sophisticated suspension management. Innovations such as AI and machine learning for predictive maintenance and enhanced ride quality are further accelerating market development. Leading companies, including WABCO, Freudenberg Group, and Continental, are actively investing in R&D for advanced ECUs, fostering an environment of innovation and industry consolidation. The market is segmented by vehicle type (passenger cars, commercial vehicles), technology (pneumatic, electro-pneumatic), and geography. We forecast a sustained positive growth trajectory, supported by vehicle automation trends and the persistent demand for a refined driving experience.
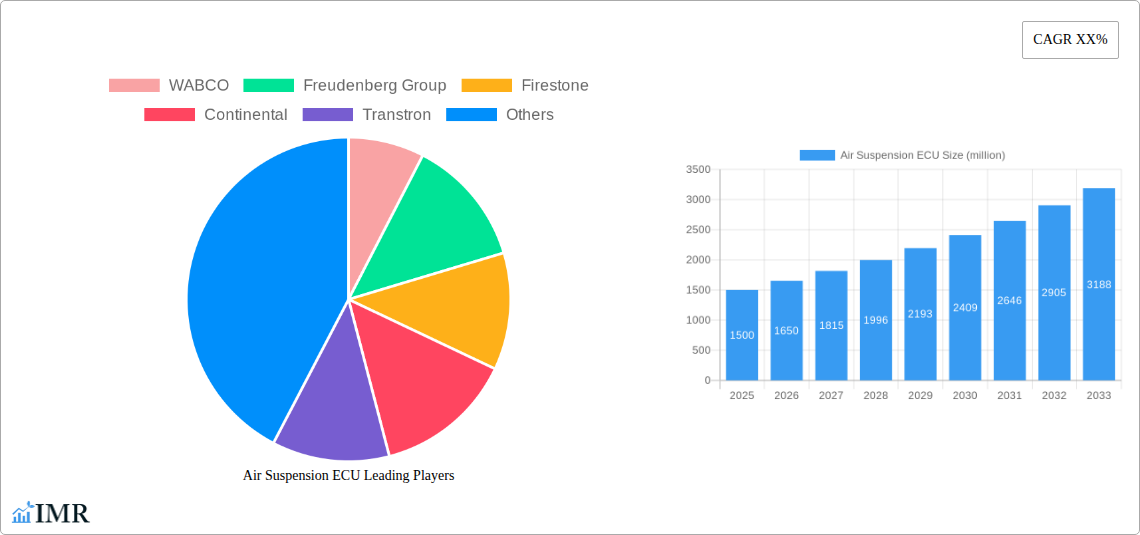
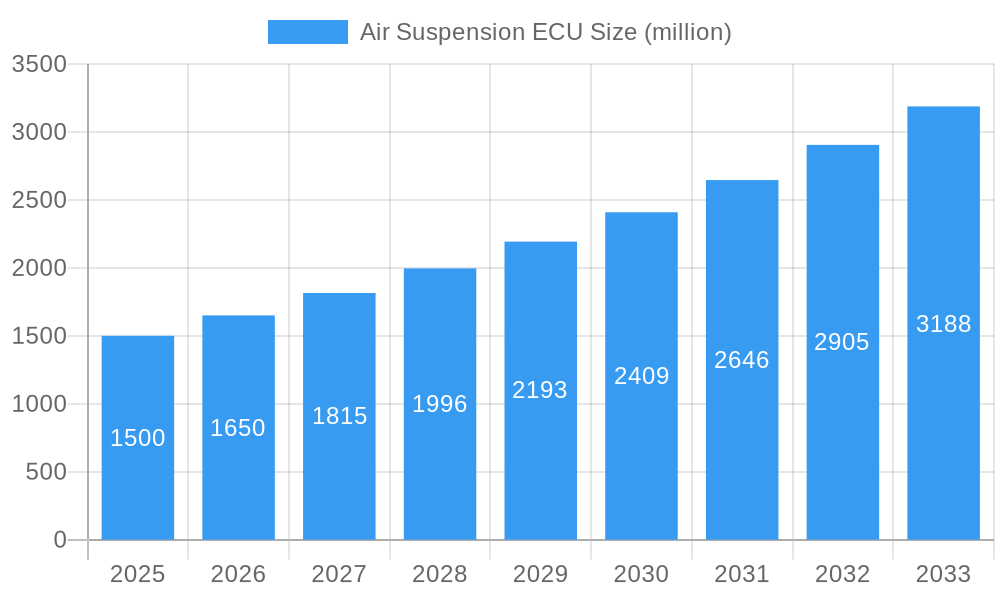
Air Suspension ECU Market Size (In Billion)
Market challenges include the substantial initial investment for air suspension systems, potentially limiting uptake in cost-sensitive vehicle segments. Nevertheless, long-term benefits such as reduced maintenance and improved fuel economy mitigate this factor. The intricate nature of air suspension ECU technology also presents integration and maintenance hurdles. Despite these obstacles, the escalating demand for enhanced comfort and safety, especially in luxury and commercial sectors, is expected to drive consistent growth across the forecast period. Adoption rates vary regionally, with mature markets leading, a gap anticipated to narrow with declining system costs and broader technological dissemination.
Air Suspension ECU Company Market Share
The global Air Suspension ECU market is estimated to reach $4.98 billion by 2025, expanding at a Compound Annual Growth Rate (CAGR) of 7.91% from a base year of 2025.
Air Suspension ECU Market Report: 2019-2033
This comprehensive report provides a detailed analysis of the global Air Suspension ECU market, encompassing market dynamics, growth trends, regional dominance, product landscape, key players, and future outlook. The study period covers 2019-2033, with 2025 as the base and estimated year. The report leverages extensive primary and secondary research to deliver actionable insights for industry professionals, investors, and stakeholders. The global Air Suspension ECU market is projected to reach xx million units by 2033.
Air Suspension ECU Market Dynamics & Structure
The Air Suspension ECU market exhibits a moderately concentrated structure, with key players like WABCO, Continental, and ZF Group holding significant market share. Technological innovation, particularly in areas like advanced driver-assistance systems (ADAS) and improved ride comfort, are key drivers. Stringent safety regulations and emission norms globally further propel market growth. Competitive substitutes, such as traditional suspension systems, pose a challenge, although the advantages of air suspension in terms of ride quality and handling are driving adoption. The market is witnessing increasing M&A activity, with larger players acquiring smaller, specialized companies to enhance their technological capabilities and market reach.
- Market Concentration: Moderately concentrated, with top 5 players holding approximately xx% market share in 2025.
- Technological Innovation: Focus on enhanced durability, reduced energy consumption, and integration with ADAS.
- Regulatory Framework: Stringent safety and emission standards are driving demand for advanced air suspension systems.
- Competitive Substitutes: Traditional suspension systems, though cost-effective, face increasing competition from air suspension.
- End-User Demographics: Growth is fueled by the increasing demand for premium vehicles and commercial vehicles requiring enhanced ride comfort and load-carrying capacity.
- M&A Trends: Significant consolidation expected, with xx M&A deals projected between 2025 and 2033.
Air Suspension ECU Growth Trends & Insights
The global Air Suspension ECU market experienced substantial growth during the historical period (2019-2024), with a CAGR of xx%. This growth is expected to continue during the forecast period (2025-2033), driven by factors such as increasing vehicle production, rising disposable incomes, and technological advancements resulting in improved fuel efficiency and safety features. Market penetration in developing economies remains relatively low, presenting significant untapped potential. The shift towards autonomous driving is also expected to fuel adoption, as air suspension is crucial for optimized vehicle stability and passenger comfort in self-driving cars. Technological disruptions such as the integration of AI and IoT into ECUs further contribute to market growth. Consumer behavior is shifting toward prioritizing enhanced ride comfort and safety, which favors the adoption of air suspension systems.
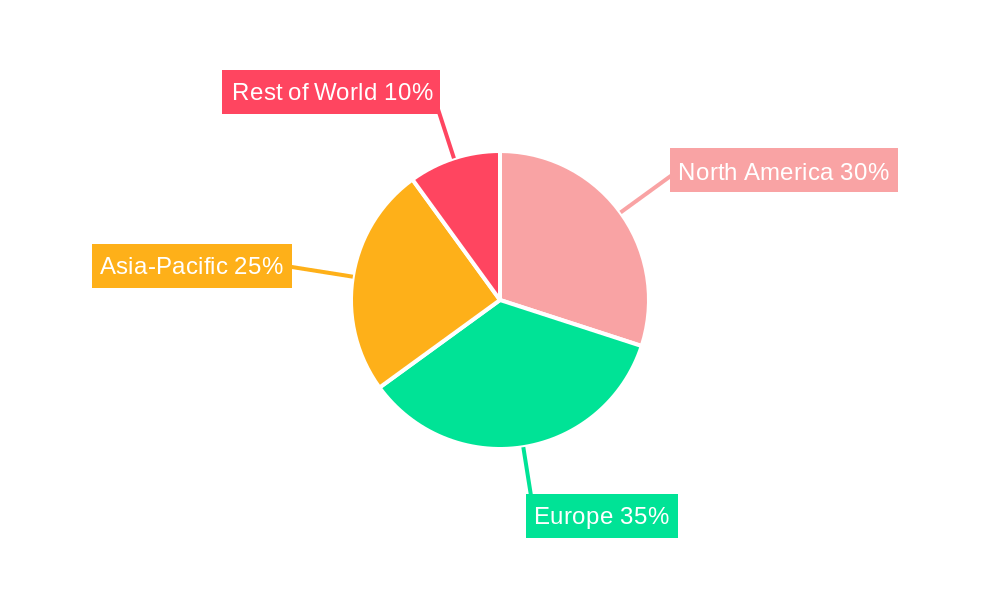
Dominant Regions, Countries, or Segments in Air Suspension ECU
North America and Europe currently dominate the Air Suspension ECU market, driven by high vehicle production, robust automotive infrastructure, and stringent regulatory standards. However, Asia Pacific is expected to witness the fastest growth rate during the forecast period, owing to rapid industrialization, rising vehicle sales, and government initiatives promoting the adoption of advanced automotive technologies. Within segments, the commercial vehicle sector is expected to drive considerable growth due to the high demand for improved load-carrying capacity and fuel efficiency.
- North America: High vehicle production, strong automotive industry, and stringent safety regulations.
- Europe: Established automotive sector, high adoption of advanced technologies, and stringent emission norms.
- Asia Pacific: Rapid economic growth, rising vehicle sales, and government support for technological advancements.
- Commercial Vehicles: Significant growth potential due to demand for enhanced load-carrying capacity and fuel efficiency.
Air Suspension ECU Product Landscape
Air Suspension ECUs are evolving towards increased functionality, integrating advanced features such as self-leveling, adaptive damping, and connectivity features for predictive maintenance. These advancements improve ride comfort, enhance vehicle stability, and optimize fuel efficiency. The integration of ADAS functionalities within the ECU further enhances its value proposition. Unique selling propositions include improved ride quality, enhanced safety, and reduced maintenance costs.
Key Drivers, Barriers & Challenges in Air Suspension ECU
Key Drivers:
- Increasing demand for improved ride comfort and safety in both passenger and commercial vehicles.
- Stringent government regulations concerning vehicle safety and emissions.
- Technological advancements leading to higher fuel efficiency and improved performance.
- Growing adoption of advanced driver-assistance systems (ADAS).
Key Challenges:
- High initial cost of air suspension systems compared to traditional suspensions.
- Potential supply chain disruptions impacting component availability and cost.
- Intense competition among established and emerging players.
- Complex integration with vehicle systems and potential software compatibility issues.
Emerging Opportunities in Air Suspension ECU
The market presents opportunities in the integration of air suspension systems with autonomous driving technologies. Expansion into developing economies with rising vehicle sales offers significant growth potential. The development of more cost-effective and energy-efficient air suspension systems will further broaden market appeal. Innovative applications such as adaptive suspension for off-road vehicles also present promising prospects.
Growth Accelerators in the Air Suspension ECU Industry
Technological breakthroughs in areas such as sensor technology, artificial intelligence, and predictive maintenance are key growth drivers. Strategic partnerships between ECU manufacturers and automotive OEMs accelerate the development and integration of advanced air suspension systems. Market expansion strategies targeting emerging economies will unlock significant untapped market potential.
Key Players Shaping the Air Suspension ECU Market
- WABCO
- Freudenberg Group
- Firestone
- Continental
- Transtron
- Pneuride
- ZF Group
- Keboda Investment Holdings
- Hitachi Astemo
- Porsche Engineering
- Hyundai Mobis
- Anhui Zhongding Sealing
- Baolong Automotive
- Kh Automotive Technologies
- SDRIVE
- Tianrun
- Keman Vehicle Parts System
- United Automotive Electronic Systems
Notable Milestones in Air Suspension ECU Sector
- 2020: WABCO launches a new generation of air suspension ECUs with integrated ADAS functionalities.
- 2022: ZF Group acquires a smaller air suspension technology company, expanding its product portfolio.
- 2023: Continental introduces an energy-efficient air suspension ECU designed for electric vehicles.
In-Depth Air Suspension ECU Market Outlook
The Air Suspension ECU market is poised for significant growth in the coming years, driven by technological advancements, increasing vehicle production, and favorable government regulations. Strategic partnerships, investments in R&D, and expansion into new markets will be crucial for capturing market share. The integration of AI and IoT will transform the market, leading to more intelligent and efficient air suspension systems. The focus on sustainability will drive the development of energy-efficient solutions. The market offers considerable long-term growth potential for companies that can adapt to changing technological trends and evolving consumer preferences.
Air Suspension ECU Segmentation
-
1. Application
- 1.1. Passenger Vehicle
- 1.2. Commercial Vehicle
-
2. Types
- 2.1. Single Core Processor
- 2.2. Dual Core Processor
- 2.3. Multi-Core Processor
Air Suspension ECU Segmentation By Geography
-
1. North America
- 1.1. United States
- 1.2. Canada
- 1.3. Mexico
-
2. South America
- 2.1. Brazil
- 2.2. Argentina
- 2.3. Rest of South America
-
3. Europe
- 3.1. United Kingdom
- 3.2. Germany
- 3.3. France
- 3.4. Italy
- 3.5. Spain
- 3.6. Russia
- 3.7. Benelux
- 3.8. Nordics
- 3.9. Rest of Europe
-
4. Middle East & Africa
- 4.1. Turkey
- 4.2. Israel
- 4.3. GCC
- 4.4. North Africa
- 4.5. South Africa
- 4.6. Rest of Middle East & Africa
-
5. Asia Pacific
- 5.1. China
- 5.2. India
- 5.3. Japan
- 5.4. South Korea
- 5.5. ASEAN
- 5.6. Oceania
- 5.7. Rest of Asia Pacific
Air Suspension ECU Regional Market Share
Geographic Coverage of Air Suspension ECU
Air Suspension ECU REPORT HIGHLIGHTS
| Aspects | Details |
|---|---|
| Study Period | 2020-2034 |
| Base Year | 2025 |
| Estimated Year | 2026 |
| Forecast Period | 2026-2034 |
| Historical Period | 2020-2025 |
| Growth Rate | CAGR of 7.91% from 2020-2034 |
| Segmentation |
|
Table of Contents
- 1. Introduction
- 1.1. Research Scope
- 1.2. Market Segmentation
- 1.3. Research Objective
- 1.4. Definitions and Assumptions
- 2. Executive Summary
- 2.1. Market Snapshot
- 3. Market Dynamics
- 3.1. Market Drivers
- 3.2. Market Restrains
- 3.3. Market Trends
- 3.4. Market Opportunities
- 4. Market Factor Analysis
- 4.1. Porters Five Forces
- 4.1.1. Bargaining Power of Suppliers
- 4.1.2. Bargaining Power of Buyers
- 4.1.3. Threat of New Entrants
- 4.1.4. Threat of Substitutes
- 4.1.5. Competitive Rivalry
- 4.2. PESTEL analysis
- 4.3. BCG Analysis
- 4.3.1. Stars (High Growth, High Market Share)
- 4.3.2. Cash Cows (Low Growth, High Market Share)
- 4.3.3. Question Mark (High Growth, Low Market Share)
- 4.3.4. Dogs (Low Growth, Low Market Share)
- 4.4. Ansoff Matrix Analysis
- 4.5. Supply Chain Analysis
- 4.6. Regulatory Landscape
- 4.7. Current Market Potential and Opportunity Assessment (TAM–SAM–SOM Framework)
- 4.8. IMR Analyst Note
- 4.1. Porters Five Forces
- 5. Market Analysis, Insights and Forecast 2021-2033
- 5.1. Market Analysis, Insights and Forecast - by Application
- 5.1.1. Passenger Vehicle
- 5.1.2. Commercial Vehicle
- 5.2. Market Analysis, Insights and Forecast - by Types
- 5.2.1. Single Core Processor
- 5.2.2. Dual Core Processor
- 5.2.3. Multi-Core Processor
- 5.3. Market Analysis, Insights and Forecast - by Region
- 5.3.1. North America
- 5.3.2. South America
- 5.3.3. Europe
- 5.3.4. Middle East & Africa
- 5.3.5. Asia Pacific
- 5.1. Market Analysis, Insights and Forecast - by Application
- 6. Global Air Suspension ECU Analysis, Insights and Forecast, 2021-2033
- 6.1. Market Analysis, Insights and Forecast - by Application
- 6.1.1. Passenger Vehicle
- 6.1.2. Commercial Vehicle
- 6.2. Market Analysis, Insights and Forecast - by Types
- 6.2.1. Single Core Processor
- 6.2.2. Dual Core Processor
- 6.2.3. Multi-Core Processor
- 6.1. Market Analysis, Insights and Forecast - by Application
- 7. North America Air Suspension ECU Analysis, Insights and Forecast, 2020-2032
- 7.1. Market Analysis, Insights and Forecast - by Application
- 7.1.1. Passenger Vehicle
- 7.1.2. Commercial Vehicle
- 7.2. Market Analysis, Insights and Forecast - by Types
- 7.2.1. Single Core Processor
- 7.2.2. Dual Core Processor
- 7.2.3. Multi-Core Processor
- 7.1. Market Analysis, Insights and Forecast - by Application
- 8. South America Air Suspension ECU Analysis, Insights and Forecast, 2020-2032
- 8.1. Market Analysis, Insights and Forecast - by Application
- 8.1.1. Passenger Vehicle
- 8.1.2. Commercial Vehicle
- 8.2. Market Analysis, Insights and Forecast - by Types
- 8.2.1. Single Core Processor
- 8.2.2. Dual Core Processor
- 8.2.3. Multi-Core Processor
- 8.1. Market Analysis, Insights and Forecast - by Application
- 9. Europe Air Suspension ECU Analysis, Insights and Forecast, 2020-2032
- 9.1. Market Analysis, Insights and Forecast - by Application
- 9.1.1. Passenger Vehicle
- 9.1.2. Commercial Vehicle
- 9.2. Market Analysis, Insights and Forecast - by Types
- 9.2.1. Single Core Processor
- 9.2.2. Dual Core Processor
- 9.2.3. Multi-Core Processor
- 9.1. Market Analysis, Insights and Forecast - by Application
- 10. Middle East & Africa Air Suspension ECU Analysis, Insights and Forecast, 2020-2032
- 10.1. Market Analysis, Insights and Forecast - by Application
- 10.1.1. Passenger Vehicle
- 10.1.2. Commercial Vehicle
- 10.2. Market Analysis, Insights and Forecast - by Types
- 10.2.1. Single Core Processor
- 10.2.2. Dual Core Processor
- 10.2.3. Multi-Core Processor
- 10.1. Market Analysis, Insights and Forecast - by Application
- 11. Asia Pacific Air Suspension ECU Analysis, Insights and Forecast, 2020-2032
- 11.1. Market Analysis, Insights and Forecast - by Application
- 11.1.1. Passenger Vehicle
- 11.1.2. Commercial Vehicle
- 11.2. Market Analysis, Insights and Forecast - by Types
- 11.2.1. Single Core Processor
- 11.2.2. Dual Core Processor
- 11.2.3. Multi-Core Processor
- 11.1. Market Analysis, Insights and Forecast - by Application
- 12. Competitive Analysis
- 12.1. Company Profiles
- 12.1.1 WABCO
- 12.1.1.1. Company Overview
- 12.1.1.2. Products
- 12.1.1.3. Company Financials
- 12.1.1.4. SWOT Analysis
- 12.1.2 Freudenberg Group
- 12.1.2.1. Company Overview
- 12.1.2.2. Products
- 12.1.2.3. Company Financials
- 12.1.2.4. SWOT Analysis
- 12.1.3 Firestone
- 12.1.3.1. Company Overview
- 12.1.3.2. Products
- 12.1.3.3. Company Financials
- 12.1.3.4. SWOT Analysis
- 12.1.4 Continental
- 12.1.4.1. Company Overview
- 12.1.4.2. Products
- 12.1.4.3. Company Financials
- 12.1.4.4. SWOT Analysis
- 12.1.5 Transtron
- 12.1.5.1. Company Overview
- 12.1.5.2. Products
- 12.1.5.3. Company Financials
- 12.1.5.4. SWOT Analysis
- 12.1.6 Pneuride
- 12.1.6.1. Company Overview
- 12.1.6.2. Products
- 12.1.6.3. Company Financials
- 12.1.6.4. SWOT Analysis
- 12.1.7 ZF Group
- 12.1.7.1. Company Overview
- 12.1.7.2. Products
- 12.1.7.3. Company Financials
- 12.1.7.4. SWOT Analysis
- 12.1.8 Keboda Investment Holdings
- 12.1.8.1. Company Overview
- 12.1.8.2. Products
- 12.1.8.3. Company Financials
- 12.1.8.4. SWOT Analysis
- 12.1.9 Hitachi Astemo
- 12.1.9.1. Company Overview
- 12.1.9.2. Products
- 12.1.9.3. Company Financials
- 12.1.9.4. SWOT Analysis
- 12.1.10 Porsche Engineering
- 12.1.10.1. Company Overview
- 12.1.10.2. Products
- 12.1.10.3. Company Financials
- 12.1.10.4. SWOT Analysis
- 12.1.11 Hyundai Mobis
- 12.1.11.1. Company Overview
- 12.1.11.2. Products
- 12.1.11.3. Company Financials
- 12.1.11.4. SWOT Analysis
- 12.1.12 Anhui Zhongding Sealing
- 12.1.12.1. Company Overview
- 12.1.12.2. Products
- 12.1.12.3. Company Financials
- 12.1.12.4. SWOT Analysis
- 12.1.13 Baolong Automotive
- 12.1.13.1. Company Overview
- 12.1.13.2. Products
- 12.1.13.3. Company Financials
- 12.1.13.4. SWOT Analysis
- 12.1.14 Kh Automotive Technologies
- 12.1.14.1. Company Overview
- 12.1.14.2. Products
- 12.1.14.3. Company Financials
- 12.1.14.4. SWOT Analysis
- 12.1.15 SDRIVE
- 12.1.15.1. Company Overview
- 12.1.15.2. Products
- 12.1.15.3. Company Financials
- 12.1.15.4. SWOT Analysis
- 12.1.16 Tianrun
- 12.1.16.1. Company Overview
- 12.1.16.2. Products
- 12.1.16.3. Company Financials
- 12.1.16.4. SWOT Analysis
- 12.1.17 Keman Vehicle Parts System
- 12.1.17.1. Company Overview
- 12.1.17.2. Products
- 12.1.17.3. Company Financials
- 12.1.17.4. SWOT Analysis
- 12.1.18 United Automotive Electronic Systems
- 12.1.18.1. Company Overview
- 12.1.18.2. Products
- 12.1.18.3. Company Financials
- 12.1.18.4. SWOT Analysis
- 12.1.1 WABCO
- 12.2. Market Entropy
- 12.2.1 Company's Key Areas Served
- 12.2.2 Recent Developments
- 12.3. Company Market Share Analysis 2025
- 12.3.1 Top 5 Companies Market Share Analysis
- 12.3.2 Top 3 Companies Market Share Analysis
- 12.4. List of Potential Customers
- 13. Research Methodology
List of Figures
- Figure 1: Global Air Suspension ECU Revenue Breakdown (billion, %) by Region 2025 & 2033
- Figure 2: Global Air Suspension ECU Volume Breakdown (K, %) by Region 2025 & 2033
- Figure 3: North America Air Suspension ECU Revenue (billion), by Application 2025 & 2033
- Figure 4: North America Air Suspension ECU Volume (K), by Application 2025 & 2033
- Figure 5: North America Air Suspension ECU Revenue Share (%), by Application 2025 & 2033
- Figure 6: North America Air Suspension ECU Volume Share (%), by Application 2025 & 2033
- Figure 7: North America Air Suspension ECU Revenue (billion), by Types 2025 & 2033
- Figure 8: North America Air Suspension ECU Volume (K), by Types 2025 & 2033
- Figure 9: North America Air Suspension ECU Revenue Share (%), by Types 2025 & 2033
- Figure 10: North America Air Suspension ECU Volume Share (%), by Types 2025 & 2033
- Figure 11: North America Air Suspension ECU Revenue (billion), by Country 2025 & 2033
- Figure 12: North America Air Suspension ECU Volume (K), by Country 2025 & 2033
- Figure 13: North America Air Suspension ECU Revenue Share (%), by Country 2025 & 2033
- Figure 14: North America Air Suspension ECU Volume Share (%), by Country 2025 & 2033
- Figure 15: South America Air Suspension ECU Revenue (billion), by Application 2025 & 2033
- Figure 16: South America Air Suspension ECU Volume (K), by Application 2025 & 2033
- Figure 17: South America Air Suspension ECU Revenue Share (%), by Application 2025 & 2033
- Figure 18: South America Air Suspension ECU Volume Share (%), by Application 2025 & 2033
- Figure 19: South America Air Suspension ECU Revenue (billion), by Types 2025 & 2033
- Figure 20: South America Air Suspension ECU Volume (K), by Types 2025 & 2033
- Figure 21: South America Air Suspension ECU Revenue Share (%), by Types 2025 & 2033
- Figure 22: South America Air Suspension ECU Volume Share (%), by Types 2025 & 2033
- Figure 23: South America Air Suspension ECU Revenue (billion), by Country 2025 & 2033
- Figure 24: South America Air Suspension ECU Volume (K), by Country 2025 & 2033
- Figure 25: South America Air Suspension ECU Revenue Share (%), by Country 2025 & 2033
- Figure 26: South America Air Suspension ECU Volume Share (%), by Country 2025 & 2033
- Figure 27: Europe Air Suspension ECU Revenue (billion), by Application 2025 & 2033
- Figure 28: Europe Air Suspension ECU Volume (K), by Application 2025 & 2033
- Figure 29: Europe Air Suspension ECU Revenue Share (%), by Application 2025 & 2033
- Figure 30: Europe Air Suspension ECU Volume Share (%), by Application 2025 & 2033
- Figure 31: Europe Air Suspension ECU Revenue (billion), by Types 2025 & 2033
- Figure 32: Europe Air Suspension ECU Volume (K), by Types 2025 & 2033
- Figure 33: Europe Air Suspension ECU Revenue Share (%), by Types 2025 & 2033
- Figure 34: Europe Air Suspension ECU Volume Share (%), by Types 2025 & 2033
- Figure 35: Europe Air Suspension ECU Revenue (billion), by Country 2025 & 2033
- Figure 36: Europe Air Suspension ECU Volume (K), by Country 2025 & 2033
- Figure 37: Europe Air Suspension ECU Revenue Share (%), by Country 2025 & 2033
- Figure 38: Europe Air Suspension ECU Volume Share (%), by Country 2025 & 2033
- Figure 39: Middle East & Africa Air Suspension ECU Revenue (billion), by Application 2025 & 2033
- Figure 40: Middle East & Africa Air Suspension ECU Volume (K), by Application 2025 & 2033
- Figure 41: Middle East & Africa Air Suspension ECU Revenue Share (%), by Application 2025 & 2033
- Figure 42: Middle East & Africa Air Suspension ECU Volume Share (%), by Application 2025 & 2033
- Figure 43: Middle East & Africa Air Suspension ECU Revenue (billion), by Types 2025 & 2033
- Figure 44: Middle East & Africa Air Suspension ECU Volume (K), by Types 2025 & 2033
- Figure 45: Middle East & Africa Air Suspension ECU Revenue Share (%), by Types 2025 & 2033
- Figure 46: Middle East & Africa Air Suspension ECU Volume Share (%), by Types 2025 & 2033
- Figure 47: Middle East & Africa Air Suspension ECU Revenue (billion), by Country 2025 & 2033
- Figure 48: Middle East & Africa Air Suspension ECU Volume (K), by Country 2025 & 2033
- Figure 49: Middle East & Africa Air Suspension ECU Revenue Share (%), by Country 2025 & 2033
- Figure 50: Middle East & Africa Air Suspension ECU Volume Share (%), by Country 2025 & 2033
- Figure 51: Asia Pacific Air Suspension ECU Revenue (billion), by Application 2025 & 2033
- Figure 52: Asia Pacific Air Suspension ECU Volume (K), by Application 2025 & 2033
- Figure 53: Asia Pacific Air Suspension ECU Revenue Share (%), by Application 2025 & 2033
- Figure 54: Asia Pacific Air Suspension ECU Volume Share (%), by Application 2025 & 2033
- Figure 55: Asia Pacific Air Suspension ECU Revenue (billion), by Types 2025 & 2033
- Figure 56: Asia Pacific Air Suspension ECU Volume (K), by Types 2025 & 2033
- Figure 57: Asia Pacific Air Suspension ECU Revenue Share (%), by Types 2025 & 2033
- Figure 58: Asia Pacific Air Suspension ECU Volume Share (%), by Types 2025 & 2033
- Figure 59: Asia Pacific Air Suspension ECU Revenue (billion), by Country 2025 & 2033
- Figure 60: Asia Pacific Air Suspension ECU Volume (K), by Country 2025 & 2033
- Figure 61: Asia Pacific Air Suspension ECU Revenue Share (%), by Country 2025 & 2033
- Figure 62: Asia Pacific Air Suspension ECU Volume Share (%), by Country 2025 & 2033
List of Tables
- Table 1: Global Air Suspension ECU Revenue billion Forecast, by Application 2020 & 2033
- Table 2: Global Air Suspension ECU Volume K Forecast, by Application 2020 & 2033
- Table 3: Global Air Suspension ECU Revenue billion Forecast, by Types 2020 & 2033
- Table 4: Global Air Suspension ECU Volume K Forecast, by Types 2020 & 2033
- Table 5: Global Air Suspension ECU Revenue billion Forecast, by Region 2020 & 2033
- Table 6: Global Air Suspension ECU Volume K Forecast, by Region 2020 & 2033
- Table 7: Global Air Suspension ECU Revenue billion Forecast, by Application 2020 & 2033
- Table 8: Global Air Suspension ECU Volume K Forecast, by Application 2020 & 2033
- Table 9: Global Air Suspension ECU Revenue billion Forecast, by Types 2020 & 2033
- Table 10: Global Air Suspension ECU Volume K Forecast, by Types 2020 & 2033
- Table 11: Global Air Suspension ECU Revenue billion Forecast, by Country 2020 & 2033
- Table 12: Global Air Suspension ECU Volume K Forecast, by Country 2020 & 2033
- Table 13: United States Air Suspension ECU Revenue (billion) Forecast, by Application 2020 & 2033
- Table 14: United States Air Suspension ECU Volume (K) Forecast, by Application 2020 & 2033
- Table 15: Canada Air Suspension ECU Revenue (billion) Forecast, by Application 2020 & 2033
- Table 16: Canada Air Suspension ECU Volume (K) Forecast, by Application 2020 & 2033
- Table 17: Mexico Air Suspension ECU Revenue (billion) Forecast, by Application 2020 & 2033
- Table 18: Mexico Air Suspension ECU Volume (K) Forecast, by Application 2020 & 2033
- Table 19: Global Air Suspension ECU Revenue billion Forecast, by Application 2020 & 2033
- Table 20: Global Air Suspension ECU Volume K Forecast, by Application 2020 & 2033
- Table 21: Global Air Suspension ECU Revenue billion Forecast, by Types 2020 & 2033
- Table 22: Global Air Suspension ECU Volume K Forecast, by Types 2020 & 2033
- Table 23: Global Air Suspension ECU Revenue billion Forecast, by Country 2020 & 2033
- Table 24: Global Air Suspension ECU Volume K Forecast, by Country 2020 & 2033
- Table 25: Brazil Air Suspension ECU Revenue (billion) Forecast, by Application 2020 & 2033
- Table 26: Brazil Air Suspension ECU Volume (K) Forecast, by Application 2020 & 2033
- Table 27: Argentina Air Suspension ECU Revenue (billion) Forecast, by Application 2020 & 2033
- Table 28: Argentina Air Suspension ECU Volume (K) Forecast, by Application 2020 & 2033
- Table 29: Rest of South America Air Suspension ECU Revenue (billion) Forecast, by Application 2020 & 2033
- Table 30: Rest of South America Air Suspension ECU Volume (K) Forecast, by Application 2020 & 2033
- Table 31: Global Air Suspension ECU Revenue billion Forecast, by Application 2020 & 2033
- Table 32: Global Air Suspension ECU Volume K Forecast, by Application 2020 & 2033
- Table 33: Global Air Suspension ECU Revenue billion Forecast, by Types 2020 & 2033
- Table 34: Global Air Suspension ECU Volume K Forecast, by Types 2020 & 2033
- Table 35: Global Air Suspension ECU Revenue billion Forecast, by Country 2020 & 2033
- Table 36: Global Air Suspension ECU Volume K Forecast, by Country 2020 & 2033
- Table 37: United Kingdom Air Suspension ECU Revenue (billion) Forecast, by Application 2020 & 2033
- Table 38: United Kingdom Air Suspension ECU Volume (K) Forecast, by Application 2020 & 2033
- Table 39: Germany Air Suspension ECU Revenue (billion) Forecast, by Application 2020 & 2033
- Table 40: Germany Air Suspension ECU Volume (K) Forecast, by Application 2020 & 2033
- Table 41: France Air Suspension ECU Revenue (billion) Forecast, by Application 2020 & 2033
- Table 42: France Air Suspension ECU Volume (K) Forecast, by Application 2020 & 2033
- Table 43: Italy Air Suspension ECU Revenue (billion) Forecast, by Application 2020 & 2033
- Table 44: Italy Air Suspension ECU Volume (K) Forecast, by Application 2020 & 2033
- Table 45: Spain Air Suspension ECU Revenue (billion) Forecast, by Application 2020 & 2033
- Table 46: Spain Air Suspension ECU Volume (K) Forecast, by Application 2020 & 2033
- Table 47: Russia Air Suspension ECU Revenue (billion) Forecast, by Application 2020 & 2033
- Table 48: Russia Air Suspension ECU Volume (K) Forecast, by Application 2020 & 2033
- Table 49: Benelux Air Suspension ECU Revenue (billion) Forecast, by Application 2020 & 2033
- Table 50: Benelux Air Suspension ECU Volume (K) Forecast, by Application 2020 & 2033
- Table 51: Nordics Air Suspension ECU Revenue (billion) Forecast, by Application 2020 & 2033
- Table 52: Nordics Air Suspension ECU Volume (K) Forecast, by Application 2020 & 2033
- Table 53: Rest of Europe Air Suspension ECU Revenue (billion) Forecast, by Application 2020 & 2033
- Table 54: Rest of Europe Air Suspension ECU Volume (K) Forecast, by Application 2020 & 2033
- Table 55: Global Air Suspension ECU Revenue billion Forecast, by Application 2020 & 2033
- Table 56: Global Air Suspension ECU Volume K Forecast, by Application 2020 & 2033
- Table 57: Global Air Suspension ECU Revenue billion Forecast, by Types 2020 & 2033
- Table 58: Global Air Suspension ECU Volume K Forecast, by Types 2020 & 2033
- Table 59: Global Air Suspension ECU Revenue billion Forecast, by Country 2020 & 2033
- Table 60: Global Air Suspension ECU Volume K Forecast, by Country 2020 & 2033
- Table 61: Turkey Air Suspension ECU Revenue (billion) Forecast, by Application 2020 & 2033
- Table 62: Turkey Air Suspension ECU Volume (K) Forecast, by Application 2020 & 2033
- Table 63: Israel Air Suspension ECU Revenue (billion) Forecast, by Application 2020 & 2033
- Table 64: Israel Air Suspension ECU Volume (K) Forecast, by Application 2020 & 2033
- Table 65: GCC Air Suspension ECU Revenue (billion) Forecast, by Application 2020 & 2033
- Table 66: GCC Air Suspension ECU Volume (K) Forecast, by Application 2020 & 2033
- Table 67: North Africa Air Suspension ECU Revenue (billion) Forecast, by Application 2020 & 2033
- Table 68: North Africa Air Suspension ECU Volume (K) Forecast, by Application 2020 & 2033
- Table 69: South Africa Air Suspension ECU Revenue (billion) Forecast, by Application 2020 & 2033
- Table 70: South Africa Air Suspension ECU Volume (K) Forecast, by Application 2020 & 2033
- Table 71: Rest of Middle East & Africa Air Suspension ECU Revenue (billion) Forecast, by Application 2020 & 2033
- Table 72: Rest of Middle East & Africa Air Suspension ECU Volume (K) Forecast, by Application 2020 & 2033
- Table 73: Global Air Suspension ECU Revenue billion Forecast, by Application 2020 & 2033
- Table 74: Global Air Suspension ECU Volume K Forecast, by Application 2020 & 2033
- Table 75: Global Air Suspension ECU Revenue billion Forecast, by Types 2020 & 2033
- Table 76: Global Air Suspension ECU Volume K Forecast, by Types 2020 & 2033
- Table 77: Global Air Suspension ECU Revenue billion Forecast, by Country 2020 & 2033
- Table 78: Global Air Suspension ECU Volume K Forecast, by Country 2020 & 2033
- Table 79: China Air Suspension ECU Revenue (billion) Forecast, by Application 2020 & 2033
- Table 80: China Air Suspension ECU Volume (K) Forecast, by Application 2020 & 2033
- Table 81: India Air Suspension ECU Revenue (billion) Forecast, by Application 2020 & 2033
- Table 82: India Air Suspension ECU Volume (K) Forecast, by Application 2020 & 2033
- Table 83: Japan Air Suspension ECU Revenue (billion) Forecast, by Application 2020 & 2033
- Table 84: Japan Air Suspension ECU Volume (K) Forecast, by Application 2020 & 2033
- Table 85: South Korea Air Suspension ECU Revenue (billion) Forecast, by Application 2020 & 2033
- Table 86: South Korea Air Suspension ECU Volume (K) Forecast, by Application 2020 & 2033
- Table 87: ASEAN Air Suspension ECU Revenue (billion) Forecast, by Application 2020 & 2033
- Table 88: ASEAN Air Suspension ECU Volume (K) Forecast, by Application 2020 & 2033
- Table 89: Oceania Air Suspension ECU Revenue (billion) Forecast, by Application 2020 & 2033
- Table 90: Oceania Air Suspension ECU Volume (K) Forecast, by Application 2020 & 2033
- Table 91: Rest of Asia Pacific Air Suspension ECU Revenue (billion) Forecast, by Application 2020 & 2033
- Table 92: Rest of Asia Pacific Air Suspension ECU Volume (K) Forecast, by Application 2020 & 2033
Frequently Asked Questions
1. What is the projected Compound Annual Growth Rate (CAGR) of the Air Suspension ECU?
The projected CAGR is approximately 7.91%.
2. Which companies are prominent players in the Air Suspension ECU?
Key companies in the market include WABCO, Freudenberg Group, Firestone, Continental, Transtron, Pneuride, ZF Group, Keboda Investment Holdings, Hitachi Astemo, Porsche Engineering, Hyundai Mobis, Anhui Zhongding Sealing, Baolong Automotive, Kh Automotive Technologies, SDRIVE, Tianrun, Keman Vehicle Parts System, United Automotive Electronic Systems.
3. What are the main segments of the Air Suspension ECU?
The market segments include Application, Types.
4. Can you provide details about the market size?
The market size is estimated to be USD 4.98 billion as of 2022.
5. What are some drivers contributing to market growth?
N/A
6. What are the notable trends driving market growth?
N/A
7. Are there any restraints impacting market growth?
N/A
8. Can you provide examples of recent developments in the market?
N/A
9. What pricing options are available for accessing the report?
Pricing options include single-user, multi-user, and enterprise licenses priced at USD 3350.00, USD 5025.00, and USD 6700.00 respectively.
10. Is the market size provided in terms of value or volume?
The market size is provided in terms of value, measured in billion and volume, measured in K.
11. Are there any specific market keywords associated with the report?
Yes, the market keyword associated with the report is "Air Suspension ECU," which aids in identifying and referencing the specific market segment covered.
12. How do I determine which pricing option suits my needs best?
The pricing options vary based on user requirements and access needs. Individual users may opt for single-user licenses, while businesses requiring broader access may choose multi-user or enterprise licenses for cost-effective access to the report.
13. Are there any additional resources or data provided in the Air Suspension ECU report?
While the report offers comprehensive insights, it's advisable to review the specific contents or supplementary materials provided to ascertain if additional resources or data are available.
14. How can I stay updated on further developments or reports in the Air Suspension ECU?
To stay informed about further developments, trends, and reports in the Air Suspension ECU, consider subscribing to industry newsletters, following relevant companies and organizations, or regularly checking reputable industry news sources and publications.
Methodology
Step 1 - Identification of Relevant Samples Size from Population Database


Step 2 - Approaches for Defining Global Market Size (Value, Volume* & Price*)

Note*: In applicable scenarios
Step 3 - Data Sources
Primary Research
- Web Analytics
- Survey Reports
- Research Institute
- Latest Research Reports
- Opinion Leaders
Secondary Research
- Annual Reports
- White Paper
- Latest Press Release
- Industry Association
- Paid Database
- Investor Presentations

Step 4 - Data Triangulation
Involves using different sources of information in order to increase the validity of a study
These sources are likely to be stakeholders in a program - participants, other researchers, program staff, other community members, and so on.
Then we put all data in single framework & apply various statistical tools to find out the dynamic on the market.
During the analysis stage, feedback from the stakeholder groups would be compared to determine areas of agreement as well as areas of divergence