

Key Insights
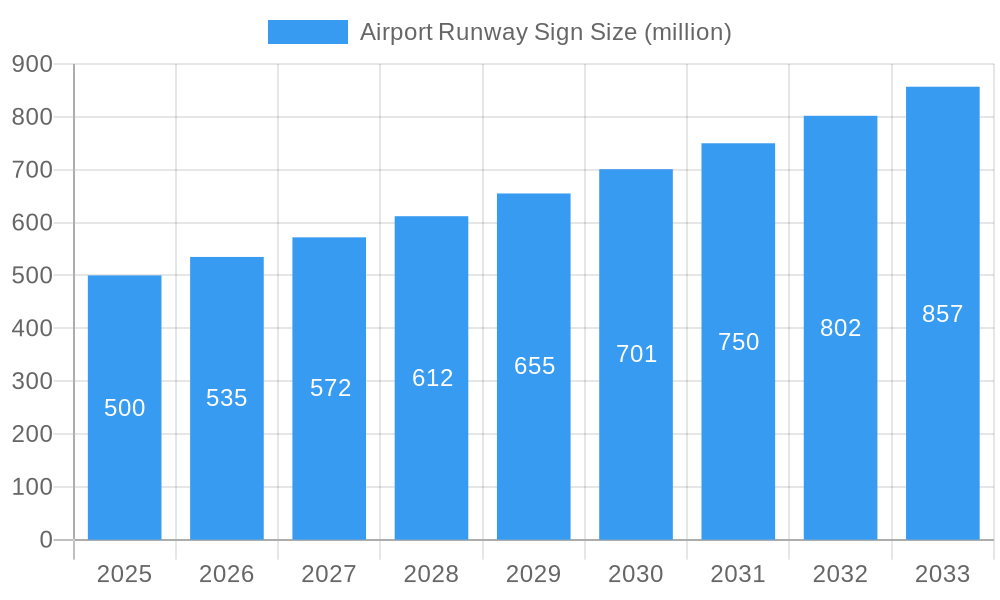
The Airport Runway Sign market is experiencing robust growth, driven by increasing air passenger traffic globally and a consequent need for enhanced safety and efficiency at airports. The market is estimated to be valued at $500 million in 2025, exhibiting a Compound Annual Growth Rate (CAGR) of 7% from 2025 to 2033. This growth is fueled by several key factors, including the rising adoption of LED technology for improved visibility and energy efficiency, the implementation of advanced signaling systems for smoother aircraft operations, and stringent regulatory mandates regarding airport safety standards. Furthermore, the increasing demand for airport modernization and expansion projects worldwide is providing significant impetus to the market's expansion. Key players such as OCEM Airfield Technology, ADB SAFEGATE, and Eaton Crouse-Hinds are driving innovation through the development of durable, reliable, and technologically advanced runway signage solutions.
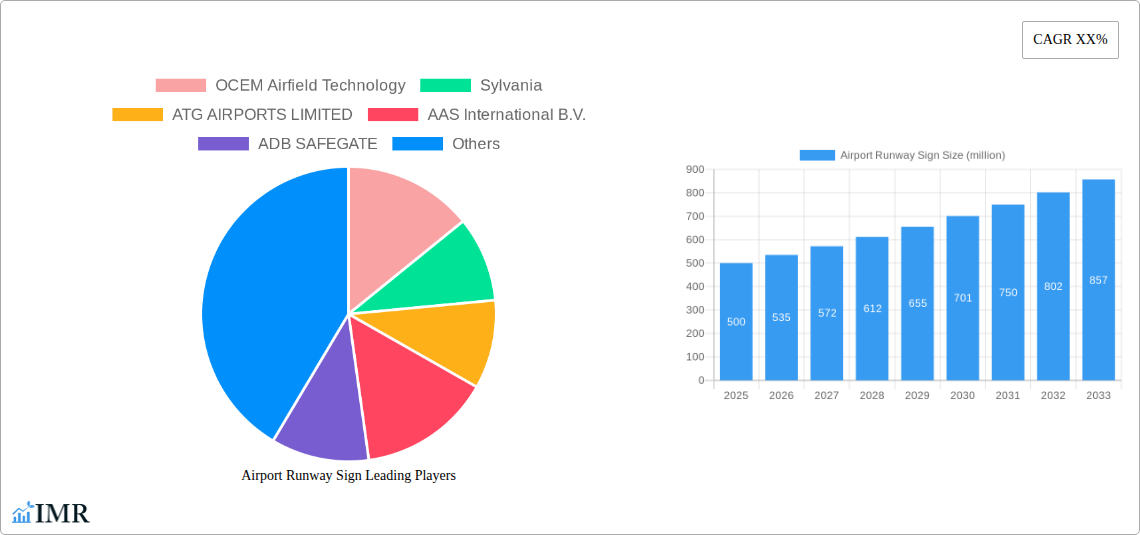
Airport Runway Sign Market Size (In Million)
Technological advancements continue to shape the market landscape, with the integration of smart technologies and data analytics becoming increasingly prevalent. The incorporation of features like real-time monitoring, remote diagnostics, and improved energy management systems is enhancing the operational efficiency and lifespan of airport runway signs. However, the market faces challenges like high initial investment costs associated with advanced systems and the need for regular maintenance. Despite these restraints, the long-term outlook for the Airport Runway Sign market remains positive, driven by ongoing investment in airport infrastructure and a continued focus on improving aviation safety and operational efficiency. Market segmentation by product type (LED, traditional), application (runway, taxiway), and region will offer further insights into growth opportunities.
Airport Runway Sign Company Market Share
Airport Runway Sign Market Report: 2019-2033
This comprehensive report provides an in-depth analysis of the Airport Runway Sign market, offering invaluable insights for industry professionals, investors, and strategic decision-makers. The study period covers 2019-2033, with a base year of 2025 and a forecast period of 2025-2033. The report leverages extensive data analysis to provide a granular understanding of market dynamics, growth trends, and future opportunities within the parent market of Airport Infrastructure and the child market of Airport Lighting and Signage. The market size is projected to reach xx million units by 2033.
Airport Runway Sign Market Dynamics & Structure
This section analyzes the competitive landscape of the Airport Runway Sign market, encompassing market concentration, technological innovation, regulatory frameworks, substitute products, end-user demographics, and merger & acquisition (M&A) activities. The market exhibits a moderately concentrated structure, with key players holding significant market share.
- Market Concentration: The top 5 players account for approximately 45% of the market share in 2025.
- Technological Innovation: LED technology and improved energy efficiency are major drivers of innovation. However, high initial investment costs present a barrier for smaller players.
- Regulatory Frameworks: Stringent safety regulations and compliance requirements influence product design and adoption. International standards (e.g., ICAO) play a crucial role.
- Competitive Substitutes: Limited direct substitutes exist, primarily due to the specialized nature of airport runway signage.
- End-User Demographics: The primary end-users are airport authorities, construction companies specializing in airport infrastructure, and airport management services.
- M&A Trends: The past five years witnessed xx M&A deals, primarily focused on enhancing technological capabilities and expanding geographical reach. This consolidation trend is expected to continue.
Airport Runway Sign Growth Trends & Insights
The Airport Runway Sign market experienced substantial growth during the historical period (2019-2024), driven by increasing air travel demand, airport infrastructure development, and technological advancements. The market size reached xx million units in 2024, registering a CAGR of xx% during this period. The forecast period (2025-2033) anticipates continued expansion, albeit at a slightly moderated pace, reaching xx million units by 2033. This moderate slowdown is primarily attributed to the existing installed base and economic factors affecting infrastructural investments. Adoption rates are expected to remain high, driven by ongoing modernization of airports globally. Technological advancements, like smart signage and integration with Airport Management Systems, contribute significantly to market expansion. Consumer behavior, reflected in airport authorities' focus on improving safety and operational efficiency, continues to favor high-quality, durable, and technologically advanced runway signs.
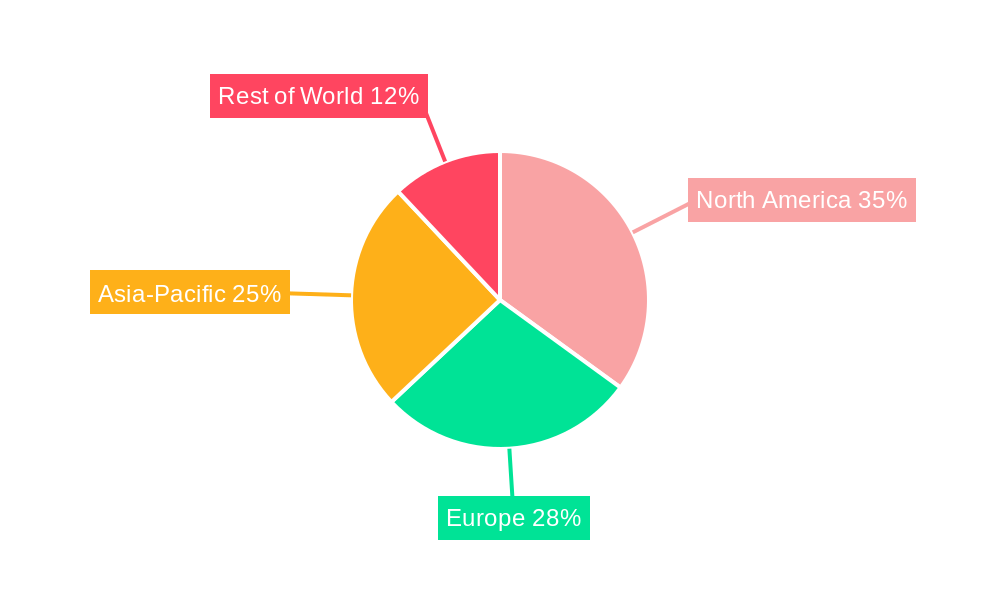
Dominant Regions, Countries, or Segments in Airport Runway Sign
North America and Europe currently dominate the Airport Runway Sign market, accounting for approximately 60% of the global market share in 2025. This dominance is attributed to a combination of factors:
- High Air Passenger Traffic: These regions boast some of the busiest airports globally, driving demand for high-quality and reliable runway signage.
- Robust Aviation Infrastructure: Significant investments in airport infrastructure modernization and expansion projects contribute to market growth.
- Stringent Safety Regulations: Stringent safety regulations necessitate compliance with advanced signage standards.
- Technological Advancements: These regions are at the forefront of technological innovation in airport technologies, further driving demand.
The Asia-Pacific region shows strong growth potential, fueled by rapid air travel growth and significant investments in airport infrastructure.
Airport Runway Sign Product Landscape
Airport runway signs encompass a range of products, including LED-based signs, traditional light-based signs, and embedded light solutions. Key features include high visibility, durability, and compliance with international standards. Recent innovations focus on energy efficiency, improved lifespan, and integration with advanced airport management systems. Unique selling propositions center on enhanced safety features, reduced maintenance needs, and optimized energy consumption.
Key Drivers, Barriers & Challenges in Airport Runway Sign
Key Drivers:
- Increasing air passenger traffic globally.
- Growing investments in airport infrastructure development.
- Technological advancements leading to improved safety and efficiency.
- Stringent safety regulations mandating advanced signage solutions.
Challenges:
- High initial investment costs for advanced signage systems.
- Supply chain disruptions impacting the availability of components.
- Competition from established players and new entrants.
- Regulatory complexities and compliance requirements.
Emerging Opportunities in Airport Runway Sign
- Integration of runway signs with advanced airport management systems.
- Increased demand for energy-efficient LED-based signs.
- Expansion into emerging markets with growing air travel demand.
- Development of smart signage solutions with real-time data capabilities.
Growth Accelerators in the Airport Runway Sign Industry
Strategic partnerships between technology providers and airport authorities accelerate market growth. Technological breakthroughs in areas such as improved LED technology and enhanced visibility systems will propel long-term growth. Expansion into developing economies and the integration of runway signs with broader airport infrastructure projects are vital drivers.
Key Players Shaping the Airport Runway Sign Market
- OCEM Airfield Technology
- Sylvania
- ATG AIRPORTS LIMITED
- AAS International B.V.
- ADB SAFEGATE
- Wanco,Inc.
- Fabri-Tech Inc.
- CARMANAH TECHNOLOGIES
- EATON CROUSE-HINDS
- Hughey and Phillips
- NAKSYS Airport Systems
- Flexstake Inc.
- Flight Light
- Sherwin Industries,Inc.
- Tana Wire Marker Co.
- Mac Stripers
Notable Milestones in Airport Runway Sign Sector
- 2020: Introduction of the first fully integrated smart runway signage system by ADB Safegate.
- 2022: OCEM Airfield Technology launches a new energy-efficient LED runway sign series.
- 2023: Merger between two smaller players leading to increased market consolidation.
In-Depth Airport Runway Sign Market Outlook
The Airport Runway Sign market is poised for sustained growth, driven by continuous advancements in technology and increasing investments in airport infrastructure globally. The focus on safety, efficiency, and sustainability will drive demand for innovative, energy-efficient signage solutions. Strategic partnerships and technological advancements will be crucial in shaping the market's future trajectory. The continued expansion of air travel and the modernization of existing airports are expected to create lucrative opportunities for market participants.
Airport Runway Sign Segmentation
-
1. Application
- 1.1. Military Airport
- 1.2. Civil Airport
-
2. Types
- 2.1. Static
- 2.2. Dynamic
Airport Runway Sign Segmentation By Geography
-
1. North America
- 1.1. United States
- 1.2. Canada
- 1.3. Mexico
-
2. South America
- 2.1. Brazil
- 2.2. Argentina
- 2.3. Rest of South America
-
3. Europe
- 3.1. United Kingdom
- 3.2. Germany
- 3.3. France
- 3.4. Italy
- 3.5. Spain
- 3.6. Russia
- 3.7. Benelux
- 3.8. Nordics
- 3.9. Rest of Europe
-
4. Middle East & Africa
- 4.1. Turkey
- 4.2. Israel
- 4.3. GCC
- 4.4. North Africa
- 4.5. South Africa
- 4.6. Rest of Middle East & Africa
-
5. Asia Pacific
- 5.1. China
- 5.2. India
- 5.3. Japan
- 5.4. South Korea
- 5.5. ASEAN
- 5.6. Oceania
- 5.7. Rest of Asia Pacific
Airport Runway Sign Regional Market Share
Geographic Coverage of Airport Runway Sign
Airport Runway Sign REPORT HIGHLIGHTS
| Aspects | Details |
|---|---|
| Study Period | 2020-2034 |
| Base Year | 2025 |
| Estimated Year | 2026 |
| Forecast Period | 2026-2034 |
| Historical Period | 2020-2025 |
| Growth Rate | CAGR of XX% from 2020-2034 |
| Segmentation |
|
Table of Contents
- 1. Introduction
- 1.1. Research Scope
- 1.2. Market Segmentation
- 1.3. Research Objective
- 1.4. Definitions and Assumptions
- 2. Executive Summary
- 2.1. Market Snapshot
- 3. Market Dynamics
- 3.1. Market Drivers
- 3.2. Market Restrains
- 3.3. Market Trends
- 3.4. Market Opportunities
- 4. Market Factor Analysis
- 4.1. Porters Five Forces
- 4.1.1. Bargaining Power of Suppliers
- 4.1.2. Bargaining Power of Buyers
- 4.1.3. Threat of New Entrants
- 4.1.4. Threat of Substitutes
- 4.1.5. Competitive Rivalry
- 4.2. PESTEL analysis
- 4.3. BCG Analysis
- 4.3.1. Stars (High Growth, High Market Share)
- 4.3.2. Cash Cows (Low Growth, High Market Share)
- 4.3.3. Question Mark (High Growth, Low Market Share)
- 4.3.4. Dogs (Low Growth, Low Market Share)
- 4.4. Ansoff Matrix Analysis
- 4.5. Supply Chain Analysis
- 4.6. Regulatory Landscape
- 4.7. Current Market Potential and Opportunity Assessment (TAM–SAM–SOM Framework)
- 4.8. IMR Analyst Note
- 4.1. Porters Five Forces
- 5. Market Analysis, Insights and Forecast 2021-2033
- 5.1. Market Analysis, Insights and Forecast - by Application
- 5.1.1. Military Airport
- 5.1.2. Civil Airport
- 5.2. Market Analysis, Insights and Forecast - by Types
- 5.2.1. Static
- 5.2.2. Dynamic
- 5.3. Market Analysis, Insights and Forecast - by Region
- 5.3.1. North America
- 5.3.2. South America
- 5.3.3. Europe
- 5.3.4. Middle East & Africa
- 5.3.5. Asia Pacific
- 5.1. Market Analysis, Insights and Forecast - by Application
- 6. Global Airport Runway Sign Analysis, Insights and Forecast, 2021-2033
- 6.1. Market Analysis, Insights and Forecast - by Application
- 6.1.1. Military Airport
- 6.1.2. Civil Airport
- 6.2. Market Analysis, Insights and Forecast - by Types
- 6.2.1. Static
- 6.2.2. Dynamic
- 6.1. Market Analysis, Insights and Forecast - by Application
- 7. North America Airport Runway Sign Analysis, Insights and Forecast, 2020-2032
- 7.1. Market Analysis, Insights and Forecast - by Application
- 7.1.1. Military Airport
- 7.1.2. Civil Airport
- 7.2. Market Analysis, Insights and Forecast - by Types
- 7.2.1. Static
- 7.2.2. Dynamic
- 7.1. Market Analysis, Insights and Forecast - by Application
- 8. South America Airport Runway Sign Analysis, Insights and Forecast, 2020-2032
- 8.1. Market Analysis, Insights and Forecast - by Application
- 8.1.1. Military Airport
- 8.1.2. Civil Airport
- 8.2. Market Analysis, Insights and Forecast - by Types
- 8.2.1. Static
- 8.2.2. Dynamic
- 8.1. Market Analysis, Insights and Forecast - by Application
- 9. Europe Airport Runway Sign Analysis, Insights and Forecast, 2020-2032
- 9.1. Market Analysis, Insights and Forecast - by Application
- 9.1.1. Military Airport
- 9.1.2. Civil Airport
- 9.2. Market Analysis, Insights and Forecast - by Types
- 9.2.1. Static
- 9.2.2. Dynamic
- 9.1. Market Analysis, Insights and Forecast - by Application
- 10. Middle East & Africa Airport Runway Sign Analysis, Insights and Forecast, 2020-2032
- 10.1. Market Analysis, Insights and Forecast - by Application
- 10.1.1. Military Airport
- 10.1.2. Civil Airport
- 10.2. Market Analysis, Insights and Forecast - by Types
- 10.2.1. Static
- 10.2.2. Dynamic
- 10.1. Market Analysis, Insights and Forecast - by Application
- 11. Asia Pacific Airport Runway Sign Analysis, Insights and Forecast, 2020-2032
- 11.1. Market Analysis, Insights and Forecast - by Application
- 11.1.1. Military Airport
- 11.1.2. Civil Airport
- 11.2. Market Analysis, Insights and Forecast - by Types
- 11.2.1. Static
- 11.2.2. Dynamic
- 11.1. Market Analysis, Insights and Forecast - by Application
- 12. Competitive Analysis
- 12.1. Company Profiles
- 12.1.1 OCEM Airfield Technology
- 12.1.1.1. Company Overview
- 12.1.1.2. Products
- 12.1.1.3. Company Financials
- 12.1.1.4. SWOT Analysis
- 12.1.2 Sylvania
- 12.1.2.1. Company Overview
- 12.1.2.2. Products
- 12.1.2.3. Company Financials
- 12.1.2.4. SWOT Analysis
- 12.1.3 ATG AIRPORTS LIMITED
- 12.1.3.1. Company Overview
- 12.1.3.2. Products
- 12.1.3.3. Company Financials
- 12.1.3.4. SWOT Analysis
- 12.1.4 AAS International B.V.
- 12.1.4.1. Company Overview
- 12.1.4.2. Products
- 12.1.4.3. Company Financials
- 12.1.4.4. SWOT Analysis
- 12.1.5 ADB SAFEGATE
- 12.1.5.1. Company Overview
- 12.1.5.2. Products
- 12.1.5.3. Company Financials
- 12.1.5.4. SWOT Analysis
- 12.1.6 Wanco
- 12.1.6.1. Company Overview
- 12.1.6.2. Products
- 12.1.6.3. Company Financials
- 12.1.6.4. SWOT Analysis
- 12.1.7 Inc.
- 12.1.7.1. Company Overview
- 12.1.7.2. Products
- 12.1.7.3. Company Financials
- 12.1.7.4. SWOT Analysis
- 12.1.8 Fabri-Tech Inc.
- 12.1.8.1. Company Overview
- 12.1.8.2. Products
- 12.1.8.3. Company Financials
- 12.1.8.4. SWOT Analysis
- 12.1.9 CARMANAH TECHNOLOGIES
- 12.1.9.1. Company Overview
- 12.1.9.2. Products
- 12.1.9.3. Company Financials
- 12.1.9.4. SWOT Analysis
- 12.1.10 EATON CROUSE-HINDS
- 12.1.10.1. Company Overview
- 12.1.10.2. Products
- 12.1.10.3. Company Financials
- 12.1.10.4. SWOT Analysis
- 12.1.11 Hughey and Phillips
- 12.1.11.1. Company Overview
- 12.1.11.2. Products
- 12.1.11.3. Company Financials
- 12.1.11.4. SWOT Analysis
- 12.1.12 NAKSYS Airport Systems
- 12.1.12.1. Company Overview
- 12.1.12.2. Products
- 12.1.12.3. Company Financials
- 12.1.12.4. SWOT Analysis
- 12.1.13 Flexstake Inc.
- 12.1.13.1. Company Overview
- 12.1.13.2. Products
- 12.1.13.3. Company Financials
- 12.1.13.4. SWOT Analysis
- 12.1.14 Flight Light
- 12.1.14.1. Company Overview
- 12.1.14.2. Products
- 12.1.14.3. Company Financials
- 12.1.14.4. SWOT Analysis
- 12.1.15 Sherwin Industries
- 12.1.15.1. Company Overview
- 12.1.15.2. Products
- 12.1.15.3. Company Financials
- 12.1.15.4. SWOT Analysis
- 12.1.16 Inc.
- 12.1.16.1. Company Overview
- 12.1.16.2. Products
- 12.1.16.3. Company Financials
- 12.1.16.4. SWOT Analysis
- 12.1.17 Tana Wire Marker Co.
- 12.1.17.1. Company Overview
- 12.1.17.2. Products
- 12.1.17.3. Company Financials
- 12.1.17.4. SWOT Analysis
- 12.1.18 Mac Stripers
- 12.1.18.1. Company Overview
- 12.1.18.2. Products
- 12.1.18.3. Company Financials
- 12.1.18.4. SWOT Analysis
- 12.1.1 OCEM Airfield Technology
- 12.2. Market Entropy
- 12.2.1 Company's Key Areas Served
- 12.2.2 Recent Developments
- 12.3. Company Market Share Analysis 2025
- 12.3.1 Top 5 Companies Market Share Analysis
- 12.3.2 Top 3 Companies Market Share Analysis
- 12.4. List of Potential Customers
- 13. Research Methodology
List of Figures
- Figure 1: Global Airport Runway Sign Revenue Breakdown (million, %) by Region 2025 & 2033
- Figure 2: North America Airport Runway Sign Revenue (million), by Application 2025 & 2033
- Figure 3: North America Airport Runway Sign Revenue Share (%), by Application 2025 & 2033
- Figure 4: North America Airport Runway Sign Revenue (million), by Types 2025 & 2033
- Figure 5: North America Airport Runway Sign Revenue Share (%), by Types 2025 & 2033
- Figure 6: North America Airport Runway Sign Revenue (million), by Country 2025 & 2033
- Figure 7: North America Airport Runway Sign Revenue Share (%), by Country 2025 & 2033
- Figure 8: South America Airport Runway Sign Revenue (million), by Application 2025 & 2033
- Figure 9: South America Airport Runway Sign Revenue Share (%), by Application 2025 & 2033
- Figure 10: South America Airport Runway Sign Revenue (million), by Types 2025 & 2033
- Figure 11: South America Airport Runway Sign Revenue Share (%), by Types 2025 & 2033
- Figure 12: South America Airport Runway Sign Revenue (million), by Country 2025 & 2033
- Figure 13: South America Airport Runway Sign Revenue Share (%), by Country 2025 & 2033
- Figure 14: Europe Airport Runway Sign Revenue (million), by Application 2025 & 2033
- Figure 15: Europe Airport Runway Sign Revenue Share (%), by Application 2025 & 2033
- Figure 16: Europe Airport Runway Sign Revenue (million), by Types 2025 & 2033
- Figure 17: Europe Airport Runway Sign Revenue Share (%), by Types 2025 & 2033
- Figure 18: Europe Airport Runway Sign Revenue (million), by Country 2025 & 2033
- Figure 19: Europe Airport Runway Sign Revenue Share (%), by Country 2025 & 2033
- Figure 20: Middle East & Africa Airport Runway Sign Revenue (million), by Application 2025 & 2033
- Figure 21: Middle East & Africa Airport Runway Sign Revenue Share (%), by Application 2025 & 2033
- Figure 22: Middle East & Africa Airport Runway Sign Revenue (million), by Types 2025 & 2033
- Figure 23: Middle East & Africa Airport Runway Sign Revenue Share (%), by Types 2025 & 2033
- Figure 24: Middle East & Africa Airport Runway Sign Revenue (million), by Country 2025 & 2033
- Figure 25: Middle East & Africa Airport Runway Sign Revenue Share (%), by Country 2025 & 2033
- Figure 26: Asia Pacific Airport Runway Sign Revenue (million), by Application 2025 & 2033
- Figure 27: Asia Pacific Airport Runway Sign Revenue Share (%), by Application 2025 & 2033
- Figure 28: Asia Pacific Airport Runway Sign Revenue (million), by Types 2025 & 2033
- Figure 29: Asia Pacific Airport Runway Sign Revenue Share (%), by Types 2025 & 2033
- Figure 30: Asia Pacific Airport Runway Sign Revenue (million), by Country 2025 & 2033
- Figure 31: Asia Pacific Airport Runway Sign Revenue Share (%), by Country 2025 & 2033
List of Tables
- Table 1: Global Airport Runway Sign Revenue million Forecast, by Application 2020 & 2033
- Table 2: Global Airport Runway Sign Revenue million Forecast, by Types 2020 & 2033
- Table 3: Global Airport Runway Sign Revenue million Forecast, by Region 2020 & 2033
- Table 4: Global Airport Runway Sign Revenue million Forecast, by Application 2020 & 2033
- Table 5: Global Airport Runway Sign Revenue million Forecast, by Types 2020 & 2033
- Table 6: Global Airport Runway Sign Revenue million Forecast, by Country 2020 & 2033
- Table 7: United States Airport Runway Sign Revenue (million) Forecast, by Application 2020 & 2033
- Table 8: Canada Airport Runway Sign Revenue (million) Forecast, by Application 2020 & 2033
- Table 9: Mexico Airport Runway Sign Revenue (million) Forecast, by Application 2020 & 2033
- Table 10: Global Airport Runway Sign Revenue million Forecast, by Application 2020 & 2033
- Table 11: Global Airport Runway Sign Revenue million Forecast, by Types 2020 & 2033
- Table 12: Global Airport Runway Sign Revenue million Forecast, by Country 2020 & 2033
- Table 13: Brazil Airport Runway Sign Revenue (million) Forecast, by Application 2020 & 2033
- Table 14: Argentina Airport Runway Sign Revenue (million) Forecast, by Application 2020 & 2033
- Table 15: Rest of South America Airport Runway Sign Revenue (million) Forecast, by Application 2020 & 2033
- Table 16: Global Airport Runway Sign Revenue million Forecast, by Application 2020 & 2033
- Table 17: Global Airport Runway Sign Revenue million Forecast, by Types 2020 & 2033
- Table 18: Global Airport Runway Sign Revenue million Forecast, by Country 2020 & 2033
- Table 19: United Kingdom Airport Runway Sign Revenue (million) Forecast, by Application 2020 & 2033
- Table 20: Germany Airport Runway Sign Revenue (million) Forecast, by Application 2020 & 2033
- Table 21: France Airport Runway Sign Revenue (million) Forecast, by Application 2020 & 2033
- Table 22: Italy Airport Runway Sign Revenue (million) Forecast, by Application 2020 & 2033
- Table 23: Spain Airport Runway Sign Revenue (million) Forecast, by Application 2020 & 2033
- Table 24: Russia Airport Runway Sign Revenue (million) Forecast, by Application 2020 & 2033
- Table 25: Benelux Airport Runway Sign Revenue (million) Forecast, by Application 2020 & 2033
- Table 26: Nordics Airport Runway Sign Revenue (million) Forecast, by Application 2020 & 2033
- Table 27: Rest of Europe Airport Runway Sign Revenue (million) Forecast, by Application 2020 & 2033
- Table 28: Global Airport Runway Sign Revenue million Forecast, by Application 2020 & 2033
- Table 29: Global Airport Runway Sign Revenue million Forecast, by Types 2020 & 2033
- Table 30: Global Airport Runway Sign Revenue million Forecast, by Country 2020 & 2033
- Table 31: Turkey Airport Runway Sign Revenue (million) Forecast, by Application 2020 & 2033
- Table 32: Israel Airport Runway Sign Revenue (million) Forecast, by Application 2020 & 2033
- Table 33: GCC Airport Runway Sign Revenue (million) Forecast, by Application 2020 & 2033
- Table 34: North Africa Airport Runway Sign Revenue (million) Forecast, by Application 2020 & 2033
- Table 35: South Africa Airport Runway Sign Revenue (million) Forecast, by Application 2020 & 2033
- Table 36: Rest of Middle East & Africa Airport Runway Sign Revenue (million) Forecast, by Application 2020 & 2033
- Table 37: Global Airport Runway Sign Revenue million Forecast, by Application 2020 & 2033
- Table 38: Global Airport Runway Sign Revenue million Forecast, by Types 2020 & 2033
- Table 39: Global Airport Runway Sign Revenue million Forecast, by Country 2020 & 2033
- Table 40: China Airport Runway Sign Revenue (million) Forecast, by Application 2020 & 2033
- Table 41: India Airport Runway Sign Revenue (million) Forecast, by Application 2020 & 2033
- Table 42: Japan Airport Runway Sign Revenue (million) Forecast, by Application 2020 & 2033
- Table 43: South Korea Airport Runway Sign Revenue (million) Forecast, by Application 2020 & 2033
- Table 44: ASEAN Airport Runway Sign Revenue (million) Forecast, by Application 2020 & 2033
- Table 45: Oceania Airport Runway Sign Revenue (million) Forecast, by Application 2020 & 2033
- Table 46: Rest of Asia Pacific Airport Runway Sign Revenue (million) Forecast, by Application 2020 & 2033
Frequently Asked Questions
1. What is the projected Compound Annual Growth Rate (CAGR) of the Airport Runway Sign?
The projected CAGR is approximately XX%.
2. Which companies are prominent players in the Airport Runway Sign?
Key companies in the market include OCEM Airfield Technology, Sylvania, ATG AIRPORTS LIMITED, AAS International B.V., ADB SAFEGATE, Wanco, Inc., Fabri-Tech Inc., CARMANAH TECHNOLOGIES, EATON CROUSE-HINDS, Hughey and Phillips, NAKSYS Airport Systems, Flexstake Inc., Flight Light, Sherwin Industries, Inc., Tana Wire Marker Co., Mac Stripers.
3. What are the main segments of the Airport Runway Sign?
The market segments include Application, Types.
4. Can you provide details about the market size?
The market size is estimated to be USD XXX million as of 2022.
5. What are some drivers contributing to market growth?
N/A
6. What are the notable trends driving market growth?
N/A
7. Are there any restraints impacting market growth?
N/A
8. Can you provide examples of recent developments in the market?
N/A
9. What pricing options are available for accessing the report?
Pricing options include single-user, multi-user, and enterprise licenses priced at USD 2900.00, USD 4350.00, and USD 5800.00 respectively.
10. Is the market size provided in terms of value or volume?
The market size is provided in terms of value, measured in million.
11. Are there any specific market keywords associated with the report?
Yes, the market keyword associated with the report is "Airport Runway Sign," which aids in identifying and referencing the specific market segment covered.
12. How do I determine which pricing option suits my needs best?
The pricing options vary based on user requirements and access needs. Individual users may opt for single-user licenses, while businesses requiring broader access may choose multi-user or enterprise licenses for cost-effective access to the report.
13. Are there any additional resources or data provided in the Airport Runway Sign report?
While the report offers comprehensive insights, it's advisable to review the specific contents or supplementary materials provided to ascertain if additional resources or data are available.
14. How can I stay updated on further developments or reports in the Airport Runway Sign?
To stay informed about further developments, trends, and reports in the Airport Runway Sign, consider subscribing to industry newsletters, following relevant companies and organizations, or regularly checking reputable industry news sources and publications.
Methodology
Step 1 - Identification of Relevant Samples Size from Population Database


Step 2 - Approaches for Defining Global Market Size (Value, Volume* & Price*)

Note*: In applicable scenarios
Step 3 - Data Sources
Primary Research
- Web Analytics
- Survey Reports
- Research Institute
- Latest Research Reports
- Opinion Leaders
Secondary Research
- Annual Reports
- White Paper
- Latest Press Release
- Industry Association
- Paid Database
- Investor Presentations

Step 4 - Data Triangulation
Involves using different sources of information in order to increase the validity of a study
These sources are likely to be stakeholders in a program - participants, other researchers, program staff, other community members, and so on.
Then we put all data in single framework & apply various statistical tools to find out the dynamic on the market.
During the analysis stage, feedback from the stakeholder groups would be compared to determine areas of agreement as well as areas of divergence