

Key Insights
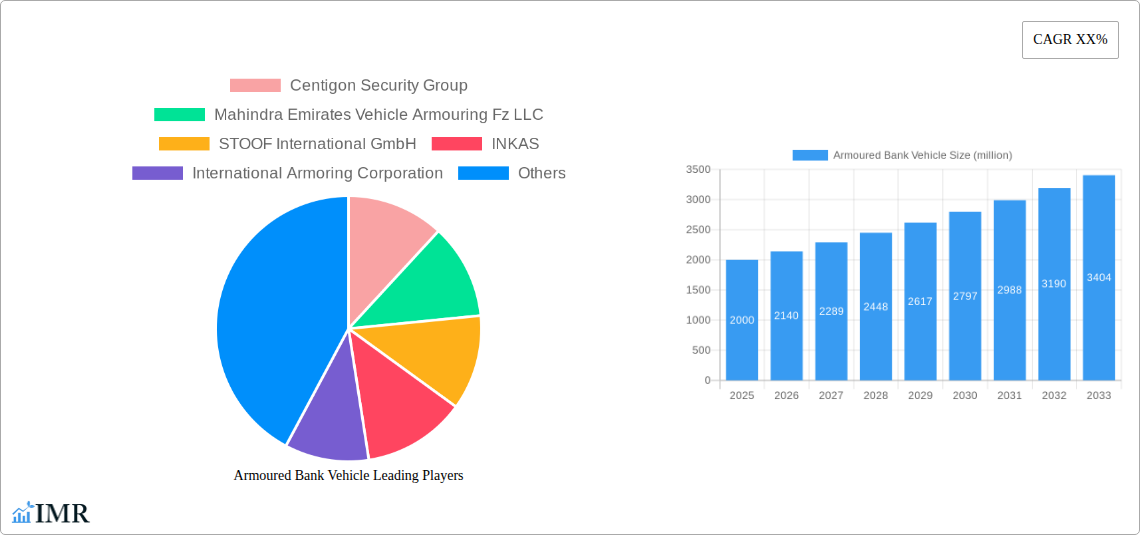
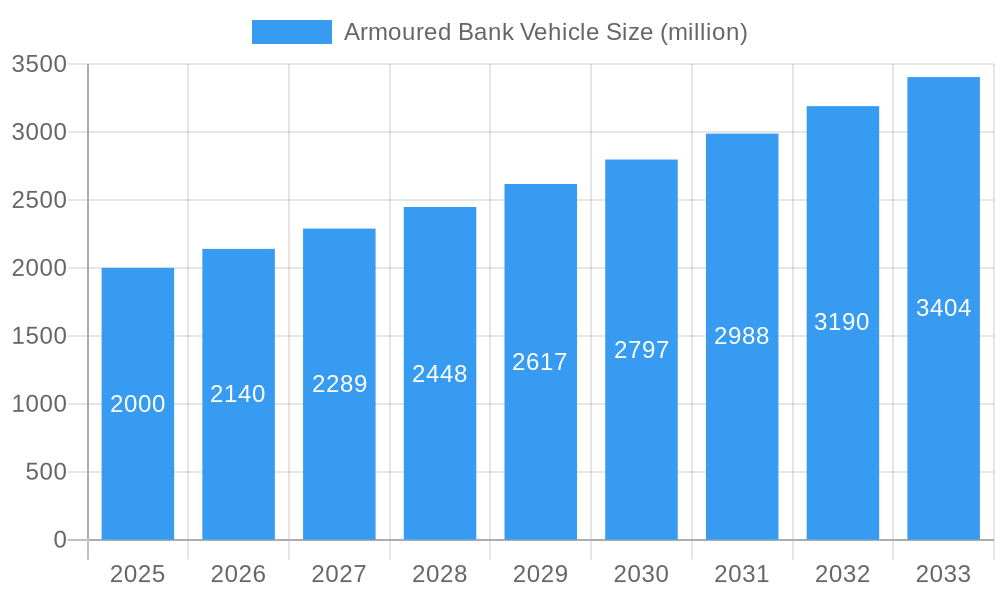
The global armored bank vehicle market is experiencing robust growth, driven by increasing security concerns related to cash-in-transit and rising instances of armed robberies targeting financial institutions. The market, estimated at $2 billion in 2025, is projected to witness a Compound Annual Growth Rate (CAGR) of 7% from 2025 to 2033, reaching approximately $3.5 billion by 2033. This growth is fueled by several factors, including the escalating demand for advanced security features in armored vehicles, technological advancements in vehicle design and security systems (e.g., GPS tracking, ballistic protection enhancements), and the expansion of the banking sector in developing economies. Key players like Centigon Security Group, Mahindra Emirates Vehicle Armouring, and INKAS are contributing significantly to market growth through innovative product offerings and strategic partnerships. However, high manufacturing costs and stringent regulatory requirements present considerable challenges to market expansion.
Armoured Bank Vehicle Market Size (In Billion)
The market segmentation reveals a high demand for armored vehicles with enhanced ballistic protection and sophisticated communication systems. Geographic variations exist, with North America and Europe currently holding the largest market share, followed by Asia-Pacific, which is witnessing rapid growth due to increasing infrastructure development and economic expansion. The historical period (2019-2024) showed steady growth, providing a solid foundation for the projected expansion. Future growth will depend heavily on technological innovations, the evolution of security threats, and government regulations governing armored vehicle usage and manufacturing. The market is expected to consolidate further, with larger players acquiring smaller companies to gain a competitive edge.
Armoured Bank Vehicle Company Market Share
Armoured Bank Vehicle Market Report: 2019-2033
This comprehensive report provides a detailed analysis of the global Armoured Bank Vehicle market, encompassing market dynamics, growth trends, regional dominance, product landscape, key players, and future outlook. The study period spans 2019-2033, with a base year of 2025 and a forecast period of 2025-2033. The report is crucial for industry professionals, investors, and strategic decision-makers seeking to understand and capitalize on opportunities within this specialized sector of the broader security and transportation industries (parent market: Security and Transportation; child market: Specialized Vehicles). The market size is estimated to be xx million units in 2025.
Armoured Bank Vehicle Market Dynamics & Structure
The Armoured Bank Vehicle market is characterized by moderate concentration, with a few key players holding significant market share. Technological innovation, driven by advancements in materials science and ballistic protection, is a key driver. Stringent regulatory frameworks concerning vehicle safety and security standards significantly influence market dynamics. Competitive substitutes, such as heavily secured conventional vehicles, pose a challenge, though the specialized needs for cash-in-transit operations favor armored vehicles. The end-user demographics primarily comprise banks, financial institutions, and security companies. M&A activity remains moderate, with xx deals recorded between 2019 and 2024.
- Market Concentration: Moderately concentrated, with the top 5 players holding approximately 60% market share in 2025.
- Technological Innovation: Focus on lightweight materials, enhanced ballistic protection, and advanced security systems.
- Regulatory Framework: Stringent safety and security standards impacting design and manufacturing.
- Competitive Substitutes: Heavily secured conventional vehicles offer limited competition.
- End-User Demographics: Banks, financial institutions, and specialized security firms.
- M&A Activity: xx deals between 2019 and 2024, indicating consolidation potential.
Armoured Bank Vehicle Growth Trends & Insights
The global Armoured Bank Vehicle market experienced a CAGR of xx% during the historical period (2019-2024) and is projected to maintain a CAGR of xx% during the forecast period (2025-2033). This growth is fueled by increasing security concerns, rising demand for secure cash transportation, and expanding financial infrastructure, particularly in developing economies. Technological disruptions, such as the adoption of advanced communication and tracking systems, further enhance market attractiveness. Shifting consumer behavior, prioritizing enhanced security measures, also contributes to market expansion. Market penetration in developed regions is high, while significant growth potential exists in emerging markets.
Dominant Regions, Countries, or Segments in Armoured Bank Vehicle
North America currently holds the largest market share due to robust banking infrastructure and high security concerns. However, Asia-Pacific is projected to exhibit the highest growth rate due to rapid economic expansion and urbanization. Within this region, India and China are particularly significant growth drivers.
- North America: High market penetration, driven by stringent security regulations and established financial sectors.
- Asia-Pacific: Fastest-growing region, fueled by economic expansion and infrastructure development.
- Europe: Mature market with steady growth, influenced by regional security policies.
- Key Drivers: Increasing urbanization, rising disposable income, and strengthening financial sectors.
Armoured Bank Vehicle Product Landscape
The Armoured Bank Vehicle market offers a range of products varying in size, capacity, protection levels, and technological features. Innovations focus on enhancing ballistic protection with lightweight materials, integrating advanced security systems (GPS tracking, remote monitoring), and incorporating ergonomic design for improved driver and passenger comfort and safety. Unique selling propositions frequently include customized designs, advanced communication systems, and superior protection capabilities surpassing industry standards.
Key Drivers, Barriers & Challenges in Armoured Bank Vehicle
Key Drivers: Growing security concerns, rising crime rates, increasing demand for secure cash transportation, and technological advancements in security systems are primary growth catalysts.
Challenges: High manufacturing costs, stringent regulatory compliance requirements, and the need for specialized expertise in design and maintenance pose significant hurdles. Supply chain disruptions can also impact production and delivery timelines, potentially impacting market growth by xx%.
Emerging Opportunities in Armoured Bank Vehicle
Untapped markets in developing economies present significant growth opportunities. Furthermore, integrating advanced technologies like AI-powered security features and autonomous driving capabilities offer innovative applications. Adapting to evolving consumer preferences, such as incorporating enhanced comfort and technological features, is vital for maintaining competitiveness.
Growth Accelerators in the Armoured Bank Vehicle Industry
Technological breakthroughs in materials science, resulting in lighter, stronger, and more cost-effective armored vehicles, will drive growth. Strategic partnerships between manufacturers and security companies will foster innovation and expand market reach. Expansion strategies focusing on emerging markets with substantial growth potential will further accelerate market development.
Key Players Shaping the Armoured Bank Vehicle Market
- Centigon Security Group
- Mahindra Emirates Vehicle Armouring Fz LLC
- STOOF International GmbH
- INKAS
- International Armoring Corporation
- Babcock
- ALPINE ARMORING INC.
- The Armored Group, LLC (TAG)
- MSCA
- Brink's Incorporated
Notable Milestones in Armoured Bank Vehicle Sector
- 2020: Introduction of lightweight composite materials for enhanced protection.
- 2022: Launch of several models incorporating advanced surveillance and communication systems.
- 2023: Merger between two prominent players resulting in increased market share. (xx % increase)
- 2024: Significant investments in R&D, focused on AI integration and autonomous technology.
In-Depth Armoured Bank Vehicle Market Outlook
The Armoured Bank Vehicle market is poised for sustained growth, driven by technological innovation, expanding infrastructure, and increasing security concerns. Strategic opportunities lie in focusing on emerging markets, developing innovative product features, and strengthening partnerships across the value chain. The market's future is bright, with projections indicating continued expansion and the emergence of new technological advancements that will shape the landscape of secure cash transportation for years to come.
Armoured Bank Vehicle Segmentation
-
1. Application
- 1.1. Bank
- 1.2. Enterprise
- 1.3. School
- 1.4. Others
-
2. Types
- 2.1. Load below 10 Tons
- 2.2. Load above 10 Tons
Armoured Bank Vehicle Segmentation By Geography
-
1. North America
- 1.1. United States
- 1.2. Canada
- 1.3. Mexico
-
2. South America
- 2.1. Brazil
- 2.2. Argentina
- 2.3. Rest of South America
-
3. Europe
- 3.1. United Kingdom
- 3.2. Germany
- 3.3. France
- 3.4. Italy
- 3.5. Spain
- 3.6. Russia
- 3.7. Benelux
- 3.8. Nordics
- 3.9. Rest of Europe
-
4. Middle East & Africa
- 4.1. Turkey
- 4.2. Israel
- 4.3. GCC
- 4.4. North Africa
- 4.5. South Africa
- 4.6. Rest of Middle East & Africa
-
5. Asia Pacific
- 5.1. China
- 5.2. India
- 5.3. Japan
- 5.4. South Korea
- 5.5. ASEAN
- 5.6. Oceania
- 5.7. Rest of Asia Pacific
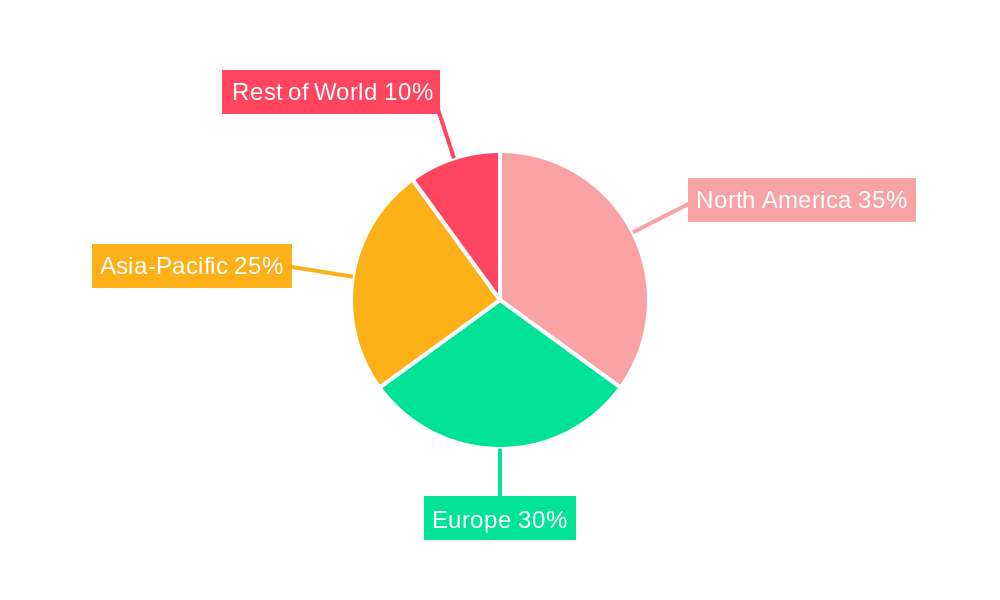
Armoured Bank Vehicle Regional Market Share
Geographic Coverage of Armoured Bank Vehicle
Armoured Bank Vehicle REPORT HIGHLIGHTS
| Aspects | Details |
|---|---|
| Study Period | 2020-2034 |
| Base Year | 2025 |
| Estimated Year | 2026 |
| Forecast Period | 2026-2034 |
| Historical Period | 2020-2025 |
| Growth Rate | CAGR of 5.4% from 2020-2034 |
| Segmentation |
|
Table of Contents
- 1. Introduction
- 1.1. Research Scope
- 1.2. Market Segmentation
- 1.3. Research Objective
- 1.4. Definitions and Assumptions
- 2. Executive Summary
- 2.1. Market Snapshot
- 3. Market Dynamics
- 3.1. Market Drivers
- 3.2. Market Restrains
- 3.3. Market Trends
- 3.4. Market Opportunities
- 4. Market Factor Analysis
- 4.1. Porters Five Forces
- 4.1.1. Bargaining Power of Suppliers
- 4.1.2. Bargaining Power of Buyers
- 4.1.3. Threat of New Entrants
- 4.1.4. Threat of Substitutes
- 4.1.5. Competitive Rivalry
- 4.2. PESTEL analysis
- 4.3. BCG Analysis
- 4.3.1. Stars (High Growth, High Market Share)
- 4.3.2. Cash Cows (Low Growth, High Market Share)
- 4.3.3. Question Mark (High Growth, Low Market Share)
- 4.3.4. Dogs (Low Growth, Low Market Share)
- 4.4. Ansoff Matrix Analysis
- 4.5. Supply Chain Analysis
- 4.6. Regulatory Landscape
- 4.7. Current Market Potential and Opportunity Assessment (TAM–SAM–SOM Framework)
- 4.8. IMR Analyst Note
- 4.1. Porters Five Forces
- 5. Market Analysis, Insights and Forecast 2021-2033
- 5.1. Market Analysis, Insights and Forecast - by Application
- 5.1.1. Bank
- 5.1.2. Enterprise
- 5.1.3. School
- 5.1.4. Others
- 5.2. Market Analysis, Insights and Forecast - by Types
- 5.2.1. Load below 10 Tons
- 5.2.2. Load above 10 Tons
- 5.3. Market Analysis, Insights and Forecast - by Region
- 5.3.1. North America
- 5.3.2. South America
- 5.3.3. Europe
- 5.3.4. Middle East & Africa
- 5.3.5. Asia Pacific
- 5.1. Market Analysis, Insights and Forecast - by Application
- 6. Global Armoured Bank Vehicle Analysis, Insights and Forecast, 2021-2033
- 6.1. Market Analysis, Insights and Forecast - by Application
- 6.1.1. Bank
- 6.1.2. Enterprise
- 6.1.3. School
- 6.1.4. Others
- 6.2. Market Analysis, Insights and Forecast - by Types
- 6.2.1. Load below 10 Tons
- 6.2.2. Load above 10 Tons
- 6.1. Market Analysis, Insights and Forecast - by Application
- 7. North America Armoured Bank Vehicle Analysis, Insights and Forecast, 2020-2032
- 7.1. Market Analysis, Insights and Forecast - by Application
- 7.1.1. Bank
- 7.1.2. Enterprise
- 7.1.3. School
- 7.1.4. Others
- 7.2. Market Analysis, Insights and Forecast - by Types
- 7.2.1. Load below 10 Tons
- 7.2.2. Load above 10 Tons
- 7.1. Market Analysis, Insights and Forecast - by Application
- 8. South America Armoured Bank Vehicle Analysis, Insights and Forecast, 2020-2032
- 8.1. Market Analysis, Insights and Forecast - by Application
- 8.1.1. Bank
- 8.1.2. Enterprise
- 8.1.3. School
- 8.1.4. Others
- 8.2. Market Analysis, Insights and Forecast - by Types
- 8.2.1. Load below 10 Tons
- 8.2.2. Load above 10 Tons
- 8.1. Market Analysis, Insights and Forecast - by Application
- 9. Europe Armoured Bank Vehicle Analysis, Insights and Forecast, 2020-2032
- 9.1. Market Analysis, Insights and Forecast - by Application
- 9.1.1. Bank
- 9.1.2. Enterprise
- 9.1.3. School
- 9.1.4. Others
- 9.2. Market Analysis, Insights and Forecast - by Types
- 9.2.1. Load below 10 Tons
- 9.2.2. Load above 10 Tons
- 9.1. Market Analysis, Insights and Forecast - by Application
- 10. Middle East & Africa Armoured Bank Vehicle Analysis, Insights and Forecast, 2020-2032
- 10.1. Market Analysis, Insights and Forecast - by Application
- 10.1.1. Bank
- 10.1.2. Enterprise
- 10.1.3. School
- 10.1.4. Others
- 10.2. Market Analysis, Insights and Forecast - by Types
- 10.2.1. Load below 10 Tons
- 10.2.2. Load above 10 Tons
- 10.1. Market Analysis, Insights and Forecast - by Application
- 11. Asia Pacific Armoured Bank Vehicle Analysis, Insights and Forecast, 2020-2032
- 11.1. Market Analysis, Insights and Forecast - by Application
- 11.1.1. Bank
- 11.1.2. Enterprise
- 11.1.3. School
- 11.1.4. Others
- 11.2. Market Analysis, Insights and Forecast - by Types
- 11.2.1. Load below 10 Tons
- 11.2.2. Load above 10 Tons
- 11.1. Market Analysis, Insights and Forecast - by Application
- 12. Competitive Analysis
- 12.1. Company Profiles
- 12.1.1 Centigon Security Group
- 12.1.1.1. Company Overview
- 12.1.1.2. Products
- 12.1.1.3. Company Financials
- 12.1.1.4. SWOT Analysis
- 12.1.2 Mahindra Emirates Vehicle Armouring Fz LLC
- 12.1.2.1. Company Overview
- 12.1.2.2. Products
- 12.1.2.3. Company Financials
- 12.1.2.4. SWOT Analysis
- 12.1.3 STOOF International GmbH
- 12.1.3.1. Company Overview
- 12.1.3.2. Products
- 12.1.3.3. Company Financials
- 12.1.3.4. SWOT Analysis
- 12.1.4 INKAS
- 12.1.4.1. Company Overview
- 12.1.4.2. Products
- 12.1.4.3. Company Financials
- 12.1.4.4. SWOT Analysis
- 12.1.5 International Armoring Corporation
- 12.1.5.1. Company Overview
- 12.1.5.2. Products
- 12.1.5.3. Company Financials
- 12.1.5.4. SWOT Analysis
- 12.1.6 Babcock
- 12.1.6.1. Company Overview
- 12.1.6.2. Products
- 12.1.6.3. Company Financials
- 12.1.6.4. SWOT Analysis
- 12.1.7 ALPINE ARMORING INC.
- 12.1.7.1. Company Overview
- 12.1.7.2. Products
- 12.1.7.3. Company Financials
- 12.1.7.4. SWOT Analysis
- 12.1.8 The Armored Group
- 12.1.8.1. Company Overview
- 12.1.8.2. Products
- 12.1.8.3. Company Financials
- 12.1.8.4. SWOT Analysis
- 12.1.9 LLC (TAG)
- 12.1.9.1. Company Overview
- 12.1.9.2. Products
- 12.1.9.3. Company Financials
- 12.1.9.4. SWOT Analysis
- 12.1.10 MSCA
- 12.1.10.1. Company Overview
- 12.1.10.2. Products
- 12.1.10.3. Company Financials
- 12.1.10.4. SWOT Analysis
- 12.1.11 Brink's Incorporated
- 12.1.11.1. Company Overview
- 12.1.11.2. Products
- 12.1.11.3. Company Financials
- 12.1.11.4. SWOT Analysis
- 12.1.1 Centigon Security Group
- 12.2. Market Entropy
- 12.2.1 Company's Key Areas Served
- 12.2.2 Recent Developments
- 12.3. Company Market Share Analysis 2025
- 12.3.1 Top 5 Companies Market Share Analysis
- 12.3.2 Top 3 Companies Market Share Analysis
- 12.4. List of Potential Customers
- 13. Research Methodology
List of Figures
- Figure 1: Global Armoured Bank Vehicle Revenue Breakdown (undefined, %) by Region 2025 & 2033
- Figure 2: Global Armoured Bank Vehicle Volume Breakdown (K, %) by Region 2025 & 2033
- Figure 3: North America Armoured Bank Vehicle Revenue (undefined), by Application 2025 & 2033
- Figure 4: North America Armoured Bank Vehicle Volume (K), by Application 2025 & 2033
- Figure 5: North America Armoured Bank Vehicle Revenue Share (%), by Application 2025 & 2033
- Figure 6: North America Armoured Bank Vehicle Volume Share (%), by Application 2025 & 2033
- Figure 7: North America Armoured Bank Vehicle Revenue (undefined), by Types 2025 & 2033
- Figure 8: North America Armoured Bank Vehicle Volume (K), by Types 2025 & 2033
- Figure 9: North America Armoured Bank Vehicle Revenue Share (%), by Types 2025 & 2033
- Figure 10: North America Armoured Bank Vehicle Volume Share (%), by Types 2025 & 2033
- Figure 11: North America Armoured Bank Vehicle Revenue (undefined), by Country 2025 & 2033
- Figure 12: North America Armoured Bank Vehicle Volume (K), by Country 2025 & 2033
- Figure 13: North America Armoured Bank Vehicle Revenue Share (%), by Country 2025 & 2033
- Figure 14: North America Armoured Bank Vehicle Volume Share (%), by Country 2025 & 2033
- Figure 15: South America Armoured Bank Vehicle Revenue (undefined), by Application 2025 & 2033
- Figure 16: South America Armoured Bank Vehicle Volume (K), by Application 2025 & 2033
- Figure 17: South America Armoured Bank Vehicle Revenue Share (%), by Application 2025 & 2033
- Figure 18: South America Armoured Bank Vehicle Volume Share (%), by Application 2025 & 2033
- Figure 19: South America Armoured Bank Vehicle Revenue (undefined), by Types 2025 & 2033
- Figure 20: South America Armoured Bank Vehicle Volume (K), by Types 2025 & 2033
- Figure 21: South America Armoured Bank Vehicle Revenue Share (%), by Types 2025 & 2033
- Figure 22: South America Armoured Bank Vehicle Volume Share (%), by Types 2025 & 2033
- Figure 23: South America Armoured Bank Vehicle Revenue (undefined), by Country 2025 & 2033
- Figure 24: South America Armoured Bank Vehicle Volume (K), by Country 2025 & 2033
- Figure 25: South America Armoured Bank Vehicle Revenue Share (%), by Country 2025 & 2033
- Figure 26: South America Armoured Bank Vehicle Volume Share (%), by Country 2025 & 2033
- Figure 27: Europe Armoured Bank Vehicle Revenue (undefined), by Application 2025 & 2033
- Figure 28: Europe Armoured Bank Vehicle Volume (K), by Application 2025 & 2033
- Figure 29: Europe Armoured Bank Vehicle Revenue Share (%), by Application 2025 & 2033
- Figure 30: Europe Armoured Bank Vehicle Volume Share (%), by Application 2025 & 2033
- Figure 31: Europe Armoured Bank Vehicle Revenue (undefined), by Types 2025 & 2033
- Figure 32: Europe Armoured Bank Vehicle Volume (K), by Types 2025 & 2033
- Figure 33: Europe Armoured Bank Vehicle Revenue Share (%), by Types 2025 & 2033
- Figure 34: Europe Armoured Bank Vehicle Volume Share (%), by Types 2025 & 2033
- Figure 35: Europe Armoured Bank Vehicle Revenue (undefined), by Country 2025 & 2033
- Figure 36: Europe Armoured Bank Vehicle Volume (K), by Country 2025 & 2033
- Figure 37: Europe Armoured Bank Vehicle Revenue Share (%), by Country 2025 & 2033
- Figure 38: Europe Armoured Bank Vehicle Volume Share (%), by Country 2025 & 2033
- Figure 39: Middle East & Africa Armoured Bank Vehicle Revenue (undefined), by Application 2025 & 2033
- Figure 40: Middle East & Africa Armoured Bank Vehicle Volume (K), by Application 2025 & 2033
- Figure 41: Middle East & Africa Armoured Bank Vehicle Revenue Share (%), by Application 2025 & 2033
- Figure 42: Middle East & Africa Armoured Bank Vehicle Volume Share (%), by Application 2025 & 2033
- Figure 43: Middle East & Africa Armoured Bank Vehicle Revenue (undefined), by Types 2025 & 2033
- Figure 44: Middle East & Africa Armoured Bank Vehicle Volume (K), by Types 2025 & 2033
- Figure 45: Middle East & Africa Armoured Bank Vehicle Revenue Share (%), by Types 2025 & 2033
- Figure 46: Middle East & Africa Armoured Bank Vehicle Volume Share (%), by Types 2025 & 2033
- Figure 47: Middle East & Africa Armoured Bank Vehicle Revenue (undefined), by Country 2025 & 2033
- Figure 48: Middle East & Africa Armoured Bank Vehicle Volume (K), by Country 2025 & 2033
- Figure 49: Middle East & Africa Armoured Bank Vehicle Revenue Share (%), by Country 2025 & 2033
- Figure 50: Middle East & Africa Armoured Bank Vehicle Volume Share (%), by Country 2025 & 2033
- Figure 51: Asia Pacific Armoured Bank Vehicle Revenue (undefined), by Application 2025 & 2033
- Figure 52: Asia Pacific Armoured Bank Vehicle Volume (K), by Application 2025 & 2033
- Figure 53: Asia Pacific Armoured Bank Vehicle Revenue Share (%), by Application 2025 & 2033
- Figure 54: Asia Pacific Armoured Bank Vehicle Volume Share (%), by Application 2025 & 2033
- Figure 55: Asia Pacific Armoured Bank Vehicle Revenue (undefined), by Types 2025 & 2033
- Figure 56: Asia Pacific Armoured Bank Vehicle Volume (K), by Types 2025 & 2033
- Figure 57: Asia Pacific Armoured Bank Vehicle Revenue Share (%), by Types 2025 & 2033
- Figure 58: Asia Pacific Armoured Bank Vehicle Volume Share (%), by Types 2025 & 2033
- Figure 59: Asia Pacific Armoured Bank Vehicle Revenue (undefined), by Country 2025 & 2033
- Figure 60: Asia Pacific Armoured Bank Vehicle Volume (K), by Country 2025 & 2033
- Figure 61: Asia Pacific Armoured Bank Vehicle Revenue Share (%), by Country 2025 & 2033
- Figure 62: Asia Pacific Armoured Bank Vehicle Volume Share (%), by Country 2025 & 2033
List of Tables
- Table 1: Global Armoured Bank Vehicle Revenue undefined Forecast, by Application 2020 & 2033
- Table 2: Global Armoured Bank Vehicle Volume K Forecast, by Application 2020 & 2033
- Table 3: Global Armoured Bank Vehicle Revenue undefined Forecast, by Types 2020 & 2033
- Table 4: Global Armoured Bank Vehicle Volume K Forecast, by Types 2020 & 2033
- Table 5: Global Armoured Bank Vehicle Revenue undefined Forecast, by Region 2020 & 2033
- Table 6: Global Armoured Bank Vehicle Volume K Forecast, by Region 2020 & 2033
- Table 7: Global Armoured Bank Vehicle Revenue undefined Forecast, by Application 2020 & 2033
- Table 8: Global Armoured Bank Vehicle Volume K Forecast, by Application 2020 & 2033
- Table 9: Global Armoured Bank Vehicle Revenue undefined Forecast, by Types 2020 & 2033
- Table 10: Global Armoured Bank Vehicle Volume K Forecast, by Types 2020 & 2033
- Table 11: Global Armoured Bank Vehicle Revenue undefined Forecast, by Country 2020 & 2033
- Table 12: Global Armoured Bank Vehicle Volume K Forecast, by Country 2020 & 2033
- Table 13: United States Armoured Bank Vehicle Revenue (undefined) Forecast, by Application 2020 & 2033
- Table 14: United States Armoured Bank Vehicle Volume (K) Forecast, by Application 2020 & 2033
- Table 15: Canada Armoured Bank Vehicle Revenue (undefined) Forecast, by Application 2020 & 2033
- Table 16: Canada Armoured Bank Vehicle Volume (K) Forecast, by Application 2020 & 2033
- Table 17: Mexico Armoured Bank Vehicle Revenue (undefined) Forecast, by Application 2020 & 2033
- Table 18: Mexico Armoured Bank Vehicle Volume (K) Forecast, by Application 2020 & 2033
- Table 19: Global Armoured Bank Vehicle Revenue undefined Forecast, by Application 2020 & 2033
- Table 20: Global Armoured Bank Vehicle Volume K Forecast, by Application 2020 & 2033
- Table 21: Global Armoured Bank Vehicle Revenue undefined Forecast, by Types 2020 & 2033
- Table 22: Global Armoured Bank Vehicle Volume K Forecast, by Types 2020 & 2033
- Table 23: Global Armoured Bank Vehicle Revenue undefined Forecast, by Country 2020 & 2033
- Table 24: Global Armoured Bank Vehicle Volume K Forecast, by Country 2020 & 2033
- Table 25: Brazil Armoured Bank Vehicle Revenue (undefined) Forecast, by Application 2020 & 2033
- Table 26: Brazil Armoured Bank Vehicle Volume (K) Forecast, by Application 2020 & 2033
- Table 27: Argentina Armoured Bank Vehicle Revenue (undefined) Forecast, by Application 2020 & 2033
- Table 28: Argentina Armoured Bank Vehicle Volume (K) Forecast, by Application 2020 & 2033
- Table 29: Rest of South America Armoured Bank Vehicle Revenue (undefined) Forecast, by Application 2020 & 2033
- Table 30: Rest of South America Armoured Bank Vehicle Volume (K) Forecast, by Application 2020 & 2033
- Table 31: Global Armoured Bank Vehicle Revenue undefined Forecast, by Application 2020 & 2033
- Table 32: Global Armoured Bank Vehicle Volume K Forecast, by Application 2020 & 2033
- Table 33: Global Armoured Bank Vehicle Revenue undefined Forecast, by Types 2020 & 2033
- Table 34: Global Armoured Bank Vehicle Volume K Forecast, by Types 2020 & 2033
- Table 35: Global Armoured Bank Vehicle Revenue undefined Forecast, by Country 2020 & 2033
- Table 36: Global Armoured Bank Vehicle Volume K Forecast, by Country 2020 & 2033
- Table 37: United Kingdom Armoured Bank Vehicle Revenue (undefined) Forecast, by Application 2020 & 2033
- Table 38: United Kingdom Armoured Bank Vehicle Volume (K) Forecast, by Application 2020 & 2033
- Table 39: Germany Armoured Bank Vehicle Revenue (undefined) Forecast, by Application 2020 & 2033
- Table 40: Germany Armoured Bank Vehicle Volume (K) Forecast, by Application 2020 & 2033
- Table 41: France Armoured Bank Vehicle Revenue (undefined) Forecast, by Application 2020 & 2033
- Table 42: France Armoured Bank Vehicle Volume (K) Forecast, by Application 2020 & 2033
- Table 43: Italy Armoured Bank Vehicle Revenue (undefined) Forecast, by Application 2020 & 2033
- Table 44: Italy Armoured Bank Vehicle Volume (K) Forecast, by Application 2020 & 2033
- Table 45: Spain Armoured Bank Vehicle Revenue (undefined) Forecast, by Application 2020 & 2033
- Table 46: Spain Armoured Bank Vehicle Volume (K) Forecast, by Application 2020 & 2033
- Table 47: Russia Armoured Bank Vehicle Revenue (undefined) Forecast, by Application 2020 & 2033
- Table 48: Russia Armoured Bank Vehicle Volume (K) Forecast, by Application 2020 & 2033
- Table 49: Benelux Armoured Bank Vehicle Revenue (undefined) Forecast, by Application 2020 & 2033
- Table 50: Benelux Armoured Bank Vehicle Volume (K) Forecast, by Application 2020 & 2033
- Table 51: Nordics Armoured Bank Vehicle Revenue (undefined) Forecast, by Application 2020 & 2033
- Table 52: Nordics Armoured Bank Vehicle Volume (K) Forecast, by Application 2020 & 2033
- Table 53: Rest of Europe Armoured Bank Vehicle Revenue (undefined) Forecast, by Application 2020 & 2033
- Table 54: Rest of Europe Armoured Bank Vehicle Volume (K) Forecast, by Application 2020 & 2033
- Table 55: Global Armoured Bank Vehicle Revenue undefined Forecast, by Application 2020 & 2033
- Table 56: Global Armoured Bank Vehicle Volume K Forecast, by Application 2020 & 2033
- Table 57: Global Armoured Bank Vehicle Revenue undefined Forecast, by Types 2020 & 2033
- Table 58: Global Armoured Bank Vehicle Volume K Forecast, by Types 2020 & 2033
- Table 59: Global Armoured Bank Vehicle Revenue undefined Forecast, by Country 2020 & 2033
- Table 60: Global Armoured Bank Vehicle Volume K Forecast, by Country 2020 & 2033
- Table 61: Turkey Armoured Bank Vehicle Revenue (undefined) Forecast, by Application 2020 & 2033
- Table 62: Turkey Armoured Bank Vehicle Volume (K) Forecast, by Application 2020 & 2033
- Table 63: Israel Armoured Bank Vehicle Revenue (undefined) Forecast, by Application 2020 & 2033
- Table 64: Israel Armoured Bank Vehicle Volume (K) Forecast, by Application 2020 & 2033
- Table 65: GCC Armoured Bank Vehicle Revenue (undefined) Forecast, by Application 2020 & 2033
- Table 66: GCC Armoured Bank Vehicle Volume (K) Forecast, by Application 2020 & 2033
- Table 67: North Africa Armoured Bank Vehicle Revenue (undefined) Forecast, by Application 2020 & 2033
- Table 68: North Africa Armoured Bank Vehicle Volume (K) Forecast, by Application 2020 & 2033
- Table 69: South Africa Armoured Bank Vehicle Revenue (undefined) Forecast, by Application 2020 & 2033
- Table 70: South Africa Armoured Bank Vehicle Volume (K) Forecast, by Application 2020 & 2033
- Table 71: Rest of Middle East & Africa Armoured Bank Vehicle Revenue (undefined) Forecast, by Application 2020 & 2033
- Table 72: Rest of Middle East & Africa Armoured Bank Vehicle Volume (K) Forecast, by Application 2020 & 2033
- Table 73: Global Armoured Bank Vehicle Revenue undefined Forecast, by Application 2020 & 2033
- Table 74: Global Armoured Bank Vehicle Volume K Forecast, by Application 2020 & 2033
- Table 75: Global Armoured Bank Vehicle Revenue undefined Forecast, by Types 2020 & 2033
- Table 76: Global Armoured Bank Vehicle Volume K Forecast, by Types 2020 & 2033
- Table 77: Global Armoured Bank Vehicle Revenue undefined Forecast, by Country 2020 & 2033
- Table 78: Global Armoured Bank Vehicle Volume K Forecast, by Country 2020 & 2033
- Table 79: China Armoured Bank Vehicle Revenue (undefined) Forecast, by Application 2020 & 2033
- Table 80: China Armoured Bank Vehicle Volume (K) Forecast, by Application 2020 & 2033
- Table 81: India Armoured Bank Vehicle Revenue (undefined) Forecast, by Application 2020 & 2033
- Table 82: India Armoured Bank Vehicle Volume (K) Forecast, by Application 2020 & 2033
- Table 83: Japan Armoured Bank Vehicle Revenue (undefined) Forecast, by Application 2020 & 2033
- Table 84: Japan Armoured Bank Vehicle Volume (K) Forecast, by Application 2020 & 2033
- Table 85: South Korea Armoured Bank Vehicle Revenue (undefined) Forecast, by Application 2020 & 2033
- Table 86: South Korea Armoured Bank Vehicle Volume (K) Forecast, by Application 2020 & 2033
- Table 87: ASEAN Armoured Bank Vehicle Revenue (undefined) Forecast, by Application 2020 & 2033
- Table 88: ASEAN Armoured Bank Vehicle Volume (K) Forecast, by Application 2020 & 2033
- Table 89: Oceania Armoured Bank Vehicle Revenue (undefined) Forecast, by Application 2020 & 2033
- Table 90: Oceania Armoured Bank Vehicle Volume (K) Forecast, by Application 2020 & 2033
- Table 91: Rest of Asia Pacific Armoured Bank Vehicle Revenue (undefined) Forecast, by Application 2020 & 2033
- Table 92: Rest of Asia Pacific Armoured Bank Vehicle Volume (K) Forecast, by Application 2020 & 2033
Frequently Asked Questions
1. What is the projected Compound Annual Growth Rate (CAGR) of the Armoured Bank Vehicle?
The projected CAGR is approximately 5.4%.
2. Which companies are prominent players in the Armoured Bank Vehicle?
Key companies in the market include Centigon Security Group, Mahindra Emirates Vehicle Armouring Fz LLC, STOOF International GmbH, INKAS, International Armoring Corporation, Babcock, ALPINE ARMORING INC., The Armored Group, LLC (TAG), MSCA, Brink's Incorporated.
3. What are the main segments of the Armoured Bank Vehicle?
The market segments include Application, Types.
4. Can you provide details about the market size?
The market size is estimated to be USD XXX N/A as of 2022.
5. What are some drivers contributing to market growth?
N/A
6. What are the notable trends driving market growth?
N/A
7. Are there any restraints impacting market growth?
N/A
8. Can you provide examples of recent developments in the market?
N/A
9. What pricing options are available for accessing the report?
Pricing options include single-user, multi-user, and enterprise licenses priced at USD 3350.00, USD 5025.00, and USD 6700.00 respectively.
10. Is the market size provided in terms of value or volume?
The market size is provided in terms of value, measured in N/A and volume, measured in K.
11. Are there any specific market keywords associated with the report?
Yes, the market keyword associated with the report is "Armoured Bank Vehicle," which aids in identifying and referencing the specific market segment covered.
12. How do I determine which pricing option suits my needs best?
The pricing options vary based on user requirements and access needs. Individual users may opt for single-user licenses, while businesses requiring broader access may choose multi-user or enterprise licenses for cost-effective access to the report.
13. Are there any additional resources or data provided in the Armoured Bank Vehicle report?
While the report offers comprehensive insights, it's advisable to review the specific contents or supplementary materials provided to ascertain if additional resources or data are available.
14. How can I stay updated on further developments or reports in the Armoured Bank Vehicle?
To stay informed about further developments, trends, and reports in the Armoured Bank Vehicle, consider subscribing to industry newsletters, following relevant companies and organizations, or regularly checking reputable industry news sources and publications.
Methodology
Step 1 - Identification of Relevant Samples Size from Population Database


Step 2 - Approaches for Defining Global Market Size (Value, Volume* & Price*)

Note*: In applicable scenarios
Step 3 - Data Sources
Primary Research
- Web Analytics
- Survey Reports
- Research Institute
- Latest Research Reports
- Opinion Leaders
Secondary Research
- Annual Reports
- White Paper
- Latest Press Release
- Industry Association
- Paid Database
- Investor Presentations

Step 4 - Data Triangulation
Involves using different sources of information in order to increase the validity of a study
These sources are likely to be stakeholders in a program - participants, other researchers, program staff, other community members, and so on.
Then we put all data in single framework & apply various statistical tools to find out the dynamic on the market.
During the analysis stage, feedback from the stakeholder groups would be compared to determine areas of agreement as well as areas of divergence