

Key Insights
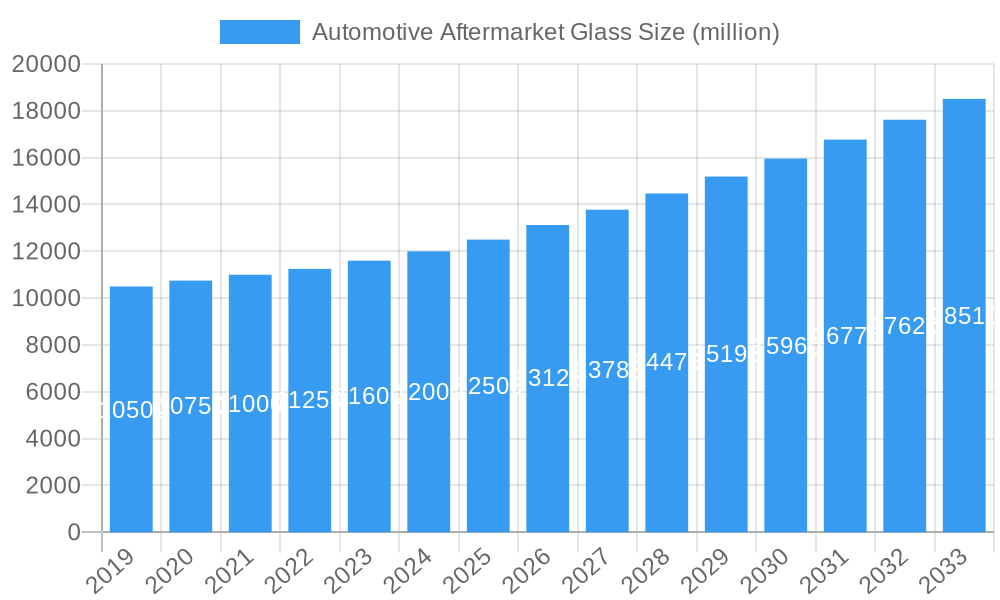
The Automotive Aftermarket Glass market is projected to experience robust growth, estimated at a market size of approximately USD 12,500 million in 2025, and is expected to expand at a Compound Annual Growth Rate (CAGR) of 5.2% through 2033. This significant expansion is fueled by a confluence of factors, primarily the increasing global vehicle parc and the aging vehicle population, leading to a greater demand for replacement glass. As vehicles age, components like windshields and other glass parts are more susceptible to damage from wear and tear, road debris, and weather conditions, necessitating timely replacements. Furthermore, advancements in automotive technology, such as the integration of Advanced Driver-Assistance Systems (ADAS) that rely on precisely calibrated sensors embedded within the windshield, are also driving demand for specialized and high-quality aftermarket glass solutions. Stringent safety regulations mandating the use of certified and high-performance automotive glass for both new vehicles and replacements further bolster market expansion. The growing adoption of electric and autonomous vehicles, which often incorporate more complex and integrated glass components, presents a nascent but promising growth avenue for the aftermarket sector.
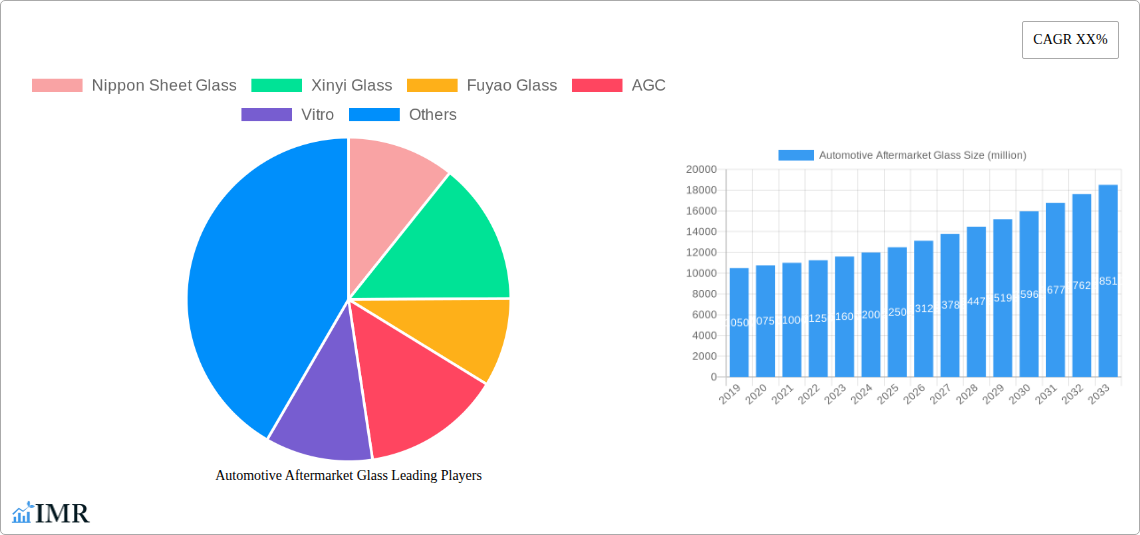
Automotive Aftermarket Glass Market Size (In Billion)
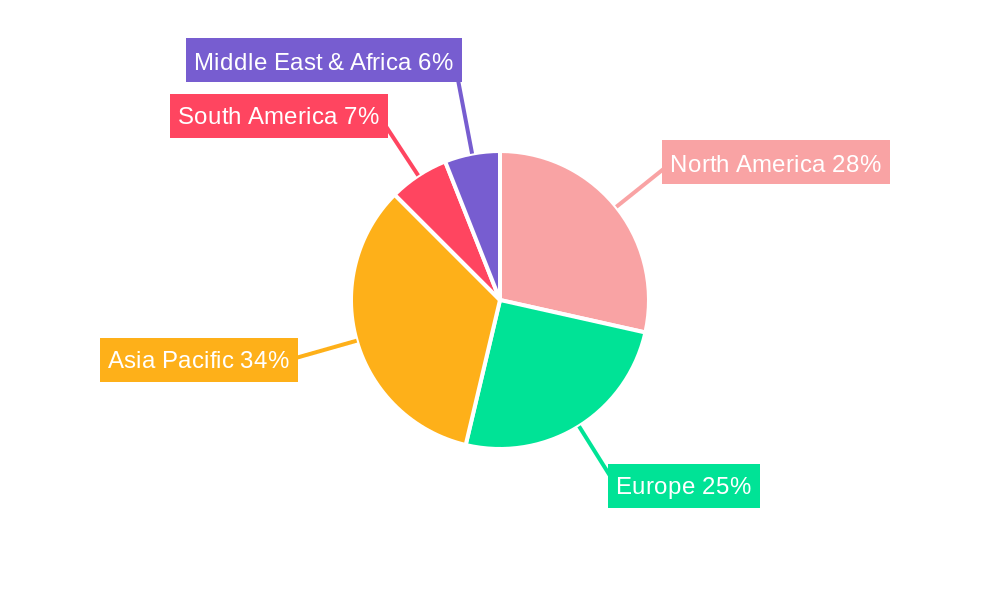
The market segmentation highlights the dominant role of passenger cars in driving aftermarket glass demand, owing to their sheer volume in global vehicle ownership. However, light and heavy commercial vehicles also represent significant segments, with commercial fleets undergoing regular maintenance and replacements to ensure operational efficiency and safety. Laminated glass, known for its superior safety features and sound insulation properties, is the preferred type in windshield applications, while tempered glass finds wider use in side and rear windows. Geographically, the Asia Pacific region, led by China and India, is anticipated to be the fastest-growing market due to its burgeoning automotive industry, increasing vehicle ownership, and a rising disposable income. North America and Europe, with their mature automotive markets and a high density of older vehicles, will continue to be substantial markets for automotive aftermarket glass. Key industry players such as Nippon Sheet Glass, Xinyi Glass, Fuyao Glass, and AGC are actively investing in expanding their production capacities and developing innovative glass solutions to cater to evolving market demands and maintain a competitive edge.
Automotive Aftermarket Glass Company Market Share
Automotive Aftermarket Glass Market Dynamics & Structure
The global automotive aftermarket glass market is characterized by a moderate concentration, with major players like Nippon Sheet Glass, Xinyi Glass, Fuyao Glass, AGC, Vitro, Saint Gobain, Carlex Glass America, and Sisecam Group holding significant market share. Technological innovation is a key driver, with advancements in areas such as advanced driver-assistance systems (ADAS) integration, lighter and stronger glass compositions, and enhanced UV/IR coatings. Regulatory frameworks, particularly concerning safety standards and vehicle emissions, indirectly influence the demand for specific types of automotive glass. Competitive product substitutes are limited, with the primary substitute being repair rather than outright replacement. End-user demographics are shifting, with an aging vehicle parc in developed regions and growing demand for passenger cars in emerging economies influencing replacement cycles. Mergers and acquisitions (M&A) are observed as companies seek to consolidate their market position, expand their geographic reach, and acquire new technologies. For instance, the acquisition of a smaller regional distributor by a global manufacturer can lead to increased market share and improved supply chain efficiency. Innovation barriers include the high cost of research and development for novel glass technologies and the stringent certification processes required for automotive components.
- Market Concentration: Moderate, with leading players holding substantial shares.
- Technological Innovation Drivers: ADAS integration, advanced coatings, lightweight glass.
- Regulatory Frameworks: Safety standards (e.g., ECE R43), emissions regulations.
- Competitive Product Substitutes: Limited; focus on repair over replacement.
- End-User Demographics: Aging vehicle parc, growing emerging market demand for passenger cars.
- M&A Trends: Consolidation, geographic expansion, technology acquisition.
- Innovation Barriers: High R&D costs, stringent certification processes.
Automotive Aftermarket Glass Growth Trends & Insights
The automotive aftermarket glass market is poised for robust growth, projected to reach approximately XX million units by 2033, exhibiting a Compound Annual Growth Rate (CAGR) of X.X% from 2025 to 2033. The base year of 2025 sees the market at a substantial volume of XX million units. This expansion is fueled by an increasing global vehicle parc, a rising trend of vehicle ownership in emerging economies, and the growing average age of vehicles on the road, leading to a higher frequency of replacements. Adoption rates for advanced automotive glass solutions, including those with integrated sensors for ADAS and Heads-Up Displays (HUDs), are on the rise. Technological disruptions, such as advancements in autonomous driving systems and the increasing complexity of vehicle electronics, necessitate specialized and often higher-value aftermarket glass solutions. Consumer behavior is also evolving, with a greater emphasis on safety, comfort, and convenience features, driving demand for premium aftermarket glass products. The replacement of cracked or damaged windshields, side windows, and rear windows remains the primary demand driver, with an estimated XX% of aftermarket glass sales attributed to these repairs. Furthermore, the increasing adoption of electric vehicles (EVs), which often feature larger and more complex glass components, is expected to contribute to market expansion. The penetration of sophisticated automotive glass technologies, such as acoustic glass for enhanced cabin quietness and solar-control glass for improved energy efficiency, is gradually increasing as consumers become more aware of their benefits. The market's resilience is also attributed to the essential nature of vehicle glass for safety and operational integrity, making it less susceptible to economic downturns compared to discretionary automotive upgrades.
Dominant Regions, Countries, or Segments in Automotive Aftermarket Glass
The Passenger Cars segment, within the Application classification, is the undisputed dominant force driving growth in the global automotive aftermarket glass market. Accounting for an estimated XX% of the total market volume in 2025, passenger cars represent the largest and most frequently serviced segment of the vehicle parc worldwide. This dominance is underpinned by several key factors. Firstly, the sheer volume of passenger cars on global roads, estimated to be over XX million units in 2025, inherently translates to a larger pool of vehicles requiring aftermarket glass services. Secondly, the relatively shorter replacement cycles for passenger car glass, often necessitated by common road hazards like stone chips and impacts, contribute to consistent demand. Economic policies in major automotive manufacturing and consuming nations play a crucial role. For example, government incentives for vehicle purchases and favorable taxation policies in countries like China and India have led to rapid growth in their passenger car fleets, consequently boosting the aftermarket glass demand.
Within the Types of automotive aftermarket glass, Laminated Glass, primarily used for windshields, holds a significant market share, estimated at XX% in 2025. This is due to its superior safety properties, preventing shattering and retaining fragments upon impact, which is a critical requirement for modern vehicle windshields, especially those equipped with ADAS sensors. The market share of laminated glass is projected to grow as safety regulations become more stringent globally.
Geographically, Asia-Pacific emerges as the leading region in the automotive aftermarket glass market, expected to account for XX% of the global market share in 2025. This leadership is attributed to:
- Massive Vehicle Parc: The region is home to the world's largest vehicle parc, with China and India being significant contributors.
- Rapidly Growing Automotive Production & Sales: Continued growth in new vehicle sales, particularly passenger cars, directly fuels the aftermarket demand.
- Increasing Disposable Income: Rising incomes in developing nations lead to higher vehicle ownership and a greater willingness to invest in vehicle maintenance and repair, including glass replacement.
- Aging Vehicle Population: As vehicles age, the incidence of glass damage and the need for replacements increase.
- Favorable Economic Policies: Government initiatives promoting automotive manufacturing and consumption support the overall ecosystem.
The country of China within the Asia-Pacific region is a prime example of this dominance, expected to contribute XX% to the global aftermarket glass market in 2025. Its massive domestic vehicle production, a substantial installed base of passenger cars, and a growing middle class with increased purchasing power make it a critical market. Infrastructure development also plays a role, as better road networks can paradoxically lead to more frequent, albeit minor, glass damage due to varied road conditions.
Automotive Aftermarket Glass Product Landscape
The automotive aftermarket glass product landscape is increasingly defined by sophisticated innovations aimed at enhancing safety, comfort, and functionality. Laminated glass, the standard for windshields, is evolving with integrated functionalities such as antennas, heating elements, and embedded sensors for ADAS. Tempered glass, used for side and rear windows, continues to be refined for improved strength and safety fracture patterns. Advanced coatings are becoming standard, including solar-control coatings to reduce heat and UV penetration, acoustic coatings for a quieter cabin experience, and hydrophobic coatings that repel water for improved visibility. These product advancements directly contribute to enhanced vehicle performance metrics, such as improved fuel efficiency through reduced HVAC load and enhanced driver safety through better visibility and ADAS functionality.
Key Drivers, Barriers & Challenges in Automotive Aftermarket Glass
Key Drivers:
- Growing Global Vehicle Parc: An increasing number of vehicles on the road directly translates to a larger demand for aftermarket glass replacement.
- Aging Vehicle Population: As vehicles age, the likelihood of glass damage increases, necessitating replacements.
- Technological Advancements in Vehicles: The integration of ADAS and other complex electronic systems in modern vehicles often requires specialized, high-value replacement glass.
- Consumer Demand for Safety and Comfort: Growing awareness of safety features and the desire for a comfortable driving experience drive demand for advanced glass solutions.
- Insurance Payouts: Widespread acceptance of comprehensive insurance policies often covers glass damage, facilitating prompt replacement.
Key Barriers & Challenges:
- Supply Chain Disruptions: Geopolitical events, natural disasters, and logistical complexities can impact the availability and cost of raw materials and finished products, leading to delays and increased prices, impacting an estimated X% of potential replacements.
- Skilled Labor Shortages: The proper installation of advanced automotive glass, especially with integrated sensors, requires trained technicians, and a shortage of such professionals can hinder market growth.
- Counterfeit Products: The proliferation of low-quality counterfeit glass can damage brand reputation and pose safety risks, estimated to capture X% of the market in certain regions.
- Economic Volatility: Significant economic downturns can lead to reduced consumer spending on vehicle maintenance and repairs, impacting discretionary replacements.
- Regulatory Compliance Costs: Meeting evolving safety and manufacturing standards can incur significant costs for manufacturers.
Emerging Opportunities in Automotive Aftermarket Glass
Emerging opportunities in the automotive aftermarket glass sector lie in the growing demand for smart glass technologies, including electrochromic (dimmable) glass and solar-powered glass. The increasing adoption of electric vehicles (EVs) presents a significant opportunity, as EVs often feature larger, more complex glass structures, including panoramic roofs and advanced aerodynamic designs, requiring specialized aftermarket solutions. Furthermore, the aftermarket repair and calibration services for ADAS sensors embedded in windshields are rapidly evolving, creating a new revenue stream for glass providers and installers. The untapped potential in emerging markets, where vehicle ownership is rising but aftermarket infrastructure is still developing, offers substantial growth prospects.
Growth Accelerators in the Automotive Aftermarket Glass Industry
The automotive aftermarket glass industry's growth is being significantly accelerated by several key factors. The rapid advancement and widespread adoption of Advanced Driver-Assistance Systems (ADAS) are paramount, as these systems rely heavily on precise calibration and specialized glass components, driving demand for high-tech replacements. Strategic partnerships between glass manufacturers and automotive OEMs, as well as aftermarket service providers, are crucial for ensuring seamless integration and distribution of new technologies. Furthermore, the increasing global focus on vehicle safety regulations and mandates for features like automatic emergency braking (AEB) directly boost the demand for laminated glass with integrated sensor capabilities. The expansion into emerging economies, capitalizing on their growing vehicle parc and rising consumer spending, also acts as a significant growth accelerator.
Key Players Shaping the Automotive Aftermarket Glass Market
- Nippon Sheet Glass
- Xinyi Glass
- Fuyao Glass
- AGC
- Vitro
- Saint Gobain
- Carlex Glass America
- Sisecam Group
Notable Milestones in Automotive Aftermarket Glass Sector
- 2019: Increased adoption of camera-based ADAS systems, driving demand for recalibration services and specialized windshields.
- 2020: Supply chain disruptions due to global events highlighted vulnerabilities and spurred efforts for diversification and localized production.
- 2021: Growing consumer interest in enhanced vehicle comfort features, such as acoustic glass and solar-control coatings, gained traction.
- 2022: Advancements in bonding technologies for stronger and more durable windshield installations.
- 2023: Increased focus on sustainability in manufacturing processes and the use of recycled materials in glass production.
- 2024: Continued innovation in lightweight glass solutions to improve vehicle fuel efficiency.
In-Depth Automotive Aftermarket Glass Market Outlook
The automotive aftermarket glass market is set for a period of sustained and dynamic growth, propelled by ongoing technological integration and evolving consumer preferences. The increasing sophistication of vehicles, particularly the ubiquitous integration of ADAS, will continue to drive demand for specialized and higher-value aftermarket glass. Emerging opportunities in smart glass technologies and the burgeoning electric vehicle segment offer significant potential for innovation and market expansion. Strategic collaborations and a focus on robust supply chain management will be critical for players to capitalize on these growth accelerators. The market outlook points towards a future where aftermarket glass is not merely a replacement part but an integral component contributing to vehicle safety, efficiency, and advanced functionalities.
Automotive Aftermarket Glass Segmentation
-
1. Application
- 1.1. Passenger Cars
- 1.2. Light Commercial Vehicles
- 1.3. Heavy Commercial Vehicles
-
2. Types
- 2.1. Laminated Glass
- 2.2. Tempered Glass
Automotive Aftermarket Glass Segmentation By Geography
-
1. North America
- 1.1. United States
- 1.2. Canada
- 1.3. Mexico
-
2. South America
- 2.1. Brazil
- 2.2. Argentina
- 2.3. Rest of South America
-
3. Europe
- 3.1. United Kingdom
- 3.2. Germany
- 3.3. France
- 3.4. Italy
- 3.5. Spain
- 3.6. Russia
- 3.7. Benelux
- 3.8. Nordics
- 3.9. Rest of Europe
-
4. Middle East & Africa
- 4.1. Turkey
- 4.2. Israel
- 4.3. GCC
- 4.4. North Africa
- 4.5. South Africa
- 4.6. Rest of Middle East & Africa
-
5. Asia Pacific
- 5.1. China
- 5.2. India
- 5.3. Japan
- 5.4. South Korea
- 5.5. ASEAN
- 5.6. Oceania
- 5.7. Rest of Asia Pacific
Automotive Aftermarket Glass Regional Market Share
Geographic Coverage of Automotive Aftermarket Glass
Automotive Aftermarket Glass REPORT HIGHLIGHTS
| Aspects | Details |
|---|---|
| Study Period | 2020-2034 |
| Base Year | 2025 |
| Estimated Year | 2026 |
| Forecast Period | 2026-2034 |
| Historical Period | 2020-2025 |
| Growth Rate | CAGR of XX% from 2020-2034 |
| Segmentation |
|
Table of Contents
- 1. Introduction
- 1.1. Research Scope
- 1.2. Market Segmentation
- 1.3. Research Objective
- 1.4. Definitions and Assumptions
- 2. Executive Summary
- 2.1. Market Snapshot
- 3. Market Dynamics
- 3.1. Market Drivers
- 3.2. Market Restrains
- 3.3. Market Trends
- 3.4. Market Opportunities
- 4. Market Factor Analysis
- 4.1. Porters Five Forces
- 4.1.1. Bargaining Power of Suppliers
- 4.1.2. Bargaining Power of Buyers
- 4.1.3. Threat of New Entrants
- 4.1.4. Threat of Substitutes
- 4.1.5. Competitive Rivalry
- 4.2. PESTEL analysis
- 4.3. BCG Analysis
- 4.3.1. Stars (High Growth, High Market Share)
- 4.3.2. Cash Cows (Low Growth, High Market Share)
- 4.3.3. Question Mark (High Growth, Low Market Share)
- 4.3.4. Dogs (Low Growth, Low Market Share)
- 4.4. Ansoff Matrix Analysis
- 4.5. Supply Chain Analysis
- 4.6. Regulatory Landscape
- 4.7. Current Market Potential and Opportunity Assessment (TAM–SAM–SOM Framework)
- 4.8. IMR Analyst Note
- 4.1. Porters Five Forces
- 5. Market Analysis, Insights and Forecast 2021-2033
- 5.1. Market Analysis, Insights and Forecast - by Application
- 5.1.1. Passenger Cars
- 5.1.2. Light Commercial Vehicles
- 5.1.3. Heavy Commercial Vehicles
- 5.2. Market Analysis, Insights and Forecast - by Types
- 5.2.1. Laminated Glass
- 5.2.2. Tempered Glass
- 5.3. Market Analysis, Insights and Forecast - by Region
- 5.3.1. North America
- 5.3.2. South America
- 5.3.3. Europe
- 5.3.4. Middle East & Africa
- 5.3.5. Asia Pacific
- 5.1. Market Analysis, Insights and Forecast - by Application
- 6. Global Automotive Aftermarket Glass Analysis, Insights and Forecast, 2021-2033
- 6.1. Market Analysis, Insights and Forecast - by Application
- 6.1.1. Passenger Cars
- 6.1.2. Light Commercial Vehicles
- 6.1.3. Heavy Commercial Vehicles
- 6.2. Market Analysis, Insights and Forecast - by Types
- 6.2.1. Laminated Glass
- 6.2.2. Tempered Glass
- 6.1. Market Analysis, Insights and Forecast - by Application
- 7. North America Automotive Aftermarket Glass Analysis, Insights and Forecast, 2020-2032
- 7.1. Market Analysis, Insights and Forecast - by Application
- 7.1.1. Passenger Cars
- 7.1.2. Light Commercial Vehicles
- 7.1.3. Heavy Commercial Vehicles
- 7.2. Market Analysis, Insights and Forecast - by Types
- 7.2.1. Laminated Glass
- 7.2.2. Tempered Glass
- 7.1. Market Analysis, Insights and Forecast - by Application
- 8. South America Automotive Aftermarket Glass Analysis, Insights and Forecast, 2020-2032
- 8.1. Market Analysis, Insights and Forecast - by Application
- 8.1.1. Passenger Cars
- 8.1.2. Light Commercial Vehicles
- 8.1.3. Heavy Commercial Vehicles
- 8.2. Market Analysis, Insights and Forecast - by Types
- 8.2.1. Laminated Glass
- 8.2.2. Tempered Glass
- 8.1. Market Analysis, Insights and Forecast - by Application
- 9. Europe Automotive Aftermarket Glass Analysis, Insights and Forecast, 2020-2032
- 9.1. Market Analysis, Insights and Forecast - by Application
- 9.1.1. Passenger Cars
- 9.1.2. Light Commercial Vehicles
- 9.1.3. Heavy Commercial Vehicles
- 9.2. Market Analysis, Insights and Forecast - by Types
- 9.2.1. Laminated Glass
- 9.2.2. Tempered Glass
- 9.1. Market Analysis, Insights and Forecast - by Application
- 10. Middle East & Africa Automotive Aftermarket Glass Analysis, Insights and Forecast, 2020-2032
- 10.1. Market Analysis, Insights and Forecast - by Application
- 10.1.1. Passenger Cars
- 10.1.2. Light Commercial Vehicles
- 10.1.3. Heavy Commercial Vehicles
- 10.2. Market Analysis, Insights and Forecast - by Types
- 10.2.1. Laminated Glass
- 10.2.2. Tempered Glass
- 10.1. Market Analysis, Insights and Forecast - by Application
- 11. Asia Pacific Automotive Aftermarket Glass Analysis, Insights and Forecast, 2020-2032
- 11.1. Market Analysis, Insights and Forecast - by Application
- 11.1.1. Passenger Cars
- 11.1.2. Light Commercial Vehicles
- 11.1.3. Heavy Commercial Vehicles
- 11.2. Market Analysis, Insights and Forecast - by Types
- 11.2.1. Laminated Glass
- 11.2.2. Tempered Glass
- 11.1. Market Analysis, Insights and Forecast - by Application
- 12. Competitive Analysis
- 12.1. Company Profiles
- 12.1.1 Nippon Sheet Glass
- 12.1.1.1. Company Overview
- 12.1.1.2. Products
- 12.1.1.3. Company Financials
- 12.1.1.4. SWOT Analysis
- 12.1.2 Xinyi Glass
- 12.1.2.1. Company Overview
- 12.1.2.2. Products
- 12.1.2.3. Company Financials
- 12.1.2.4. SWOT Analysis
- 12.1.3 Fuyao Glass
- 12.1.3.1. Company Overview
- 12.1.3.2. Products
- 12.1.3.3. Company Financials
- 12.1.3.4. SWOT Analysis
- 12.1.4 AGC
- 12.1.4.1. Company Overview
- 12.1.4.2. Products
- 12.1.4.3. Company Financials
- 12.1.4.4. SWOT Analysis
- 12.1.5 Vitro
- 12.1.5.1. Company Overview
- 12.1.5.2. Products
- 12.1.5.3. Company Financials
- 12.1.5.4. SWOT Analysis
- 12.1.6 Saint Gobain
- 12.1.6.1. Company Overview
- 12.1.6.2. Products
- 12.1.6.3. Company Financials
- 12.1.6.4. SWOT Analysis
- 12.1.7 Carlex Glass America
- 12.1.7.1. Company Overview
- 12.1.7.2. Products
- 12.1.7.3. Company Financials
- 12.1.7.4. SWOT Analysis
- 12.1.8 Sisecam Group
- 12.1.8.1. Company Overview
- 12.1.8.2. Products
- 12.1.8.3. Company Financials
- 12.1.8.4. SWOT Analysis
- 12.1.1 Nippon Sheet Glass
- 12.2. Market Entropy
- 12.2.1 Company's Key Areas Served
- 12.2.2 Recent Developments
- 12.3. Company Market Share Analysis 2025
- 12.3.1 Top 5 Companies Market Share Analysis
- 12.3.2 Top 3 Companies Market Share Analysis
- 12.4. List of Potential Customers
- 13. Research Methodology
List of Figures
- Figure 1: Global Automotive Aftermarket Glass Revenue Breakdown (million, %) by Region 2025 & 2033
- Figure 2: Global Automotive Aftermarket Glass Volume Breakdown (K, %) by Region 2025 & 2033
- Figure 3: North America Automotive Aftermarket Glass Revenue (million), by Application 2025 & 2033
- Figure 4: North America Automotive Aftermarket Glass Volume (K), by Application 2025 & 2033
- Figure 5: North America Automotive Aftermarket Glass Revenue Share (%), by Application 2025 & 2033
- Figure 6: North America Automotive Aftermarket Glass Volume Share (%), by Application 2025 & 2033
- Figure 7: North America Automotive Aftermarket Glass Revenue (million), by Types 2025 & 2033
- Figure 8: North America Automotive Aftermarket Glass Volume (K), by Types 2025 & 2033
- Figure 9: North America Automotive Aftermarket Glass Revenue Share (%), by Types 2025 & 2033
- Figure 10: North America Automotive Aftermarket Glass Volume Share (%), by Types 2025 & 2033
- Figure 11: North America Automotive Aftermarket Glass Revenue (million), by Country 2025 & 2033
- Figure 12: North America Automotive Aftermarket Glass Volume (K), by Country 2025 & 2033
- Figure 13: North America Automotive Aftermarket Glass Revenue Share (%), by Country 2025 & 2033
- Figure 14: North America Automotive Aftermarket Glass Volume Share (%), by Country 2025 & 2033
- Figure 15: South America Automotive Aftermarket Glass Revenue (million), by Application 2025 & 2033
- Figure 16: South America Automotive Aftermarket Glass Volume (K), by Application 2025 & 2033
- Figure 17: South America Automotive Aftermarket Glass Revenue Share (%), by Application 2025 & 2033
- Figure 18: South America Automotive Aftermarket Glass Volume Share (%), by Application 2025 & 2033
- Figure 19: South America Automotive Aftermarket Glass Revenue (million), by Types 2025 & 2033
- Figure 20: South America Automotive Aftermarket Glass Volume (K), by Types 2025 & 2033
- Figure 21: South America Automotive Aftermarket Glass Revenue Share (%), by Types 2025 & 2033
- Figure 22: South America Automotive Aftermarket Glass Volume Share (%), by Types 2025 & 2033
- Figure 23: South America Automotive Aftermarket Glass Revenue (million), by Country 2025 & 2033
- Figure 24: South America Automotive Aftermarket Glass Volume (K), by Country 2025 & 2033
- Figure 25: South America Automotive Aftermarket Glass Revenue Share (%), by Country 2025 & 2033
- Figure 26: South America Automotive Aftermarket Glass Volume Share (%), by Country 2025 & 2033
- Figure 27: Europe Automotive Aftermarket Glass Revenue (million), by Application 2025 & 2033
- Figure 28: Europe Automotive Aftermarket Glass Volume (K), by Application 2025 & 2033
- Figure 29: Europe Automotive Aftermarket Glass Revenue Share (%), by Application 2025 & 2033
- Figure 30: Europe Automotive Aftermarket Glass Volume Share (%), by Application 2025 & 2033
- Figure 31: Europe Automotive Aftermarket Glass Revenue (million), by Types 2025 & 2033
- Figure 32: Europe Automotive Aftermarket Glass Volume (K), by Types 2025 & 2033
- Figure 33: Europe Automotive Aftermarket Glass Revenue Share (%), by Types 2025 & 2033
- Figure 34: Europe Automotive Aftermarket Glass Volume Share (%), by Types 2025 & 2033
- Figure 35: Europe Automotive Aftermarket Glass Revenue (million), by Country 2025 & 2033
- Figure 36: Europe Automotive Aftermarket Glass Volume (K), by Country 2025 & 2033
- Figure 37: Europe Automotive Aftermarket Glass Revenue Share (%), by Country 2025 & 2033
- Figure 38: Europe Automotive Aftermarket Glass Volume Share (%), by Country 2025 & 2033
- Figure 39: Middle East & Africa Automotive Aftermarket Glass Revenue (million), by Application 2025 & 2033
- Figure 40: Middle East & Africa Automotive Aftermarket Glass Volume (K), by Application 2025 & 2033
- Figure 41: Middle East & Africa Automotive Aftermarket Glass Revenue Share (%), by Application 2025 & 2033
- Figure 42: Middle East & Africa Automotive Aftermarket Glass Volume Share (%), by Application 2025 & 2033
- Figure 43: Middle East & Africa Automotive Aftermarket Glass Revenue (million), by Types 2025 & 2033
- Figure 44: Middle East & Africa Automotive Aftermarket Glass Volume (K), by Types 2025 & 2033
- Figure 45: Middle East & Africa Automotive Aftermarket Glass Revenue Share (%), by Types 2025 & 2033
- Figure 46: Middle East & Africa Automotive Aftermarket Glass Volume Share (%), by Types 2025 & 2033
- Figure 47: Middle East & Africa Automotive Aftermarket Glass Revenue (million), by Country 2025 & 2033
- Figure 48: Middle East & Africa Automotive Aftermarket Glass Volume (K), by Country 2025 & 2033
- Figure 49: Middle East & Africa Automotive Aftermarket Glass Revenue Share (%), by Country 2025 & 2033
- Figure 50: Middle East & Africa Automotive Aftermarket Glass Volume Share (%), by Country 2025 & 2033
- Figure 51: Asia Pacific Automotive Aftermarket Glass Revenue (million), by Application 2025 & 2033
- Figure 52: Asia Pacific Automotive Aftermarket Glass Volume (K), by Application 2025 & 2033
- Figure 53: Asia Pacific Automotive Aftermarket Glass Revenue Share (%), by Application 2025 & 2033
- Figure 54: Asia Pacific Automotive Aftermarket Glass Volume Share (%), by Application 2025 & 2033
- Figure 55: Asia Pacific Automotive Aftermarket Glass Revenue (million), by Types 2025 & 2033
- Figure 56: Asia Pacific Automotive Aftermarket Glass Volume (K), by Types 2025 & 2033
- Figure 57: Asia Pacific Automotive Aftermarket Glass Revenue Share (%), by Types 2025 & 2033
- Figure 58: Asia Pacific Automotive Aftermarket Glass Volume Share (%), by Types 2025 & 2033
- Figure 59: Asia Pacific Automotive Aftermarket Glass Revenue (million), by Country 2025 & 2033
- Figure 60: Asia Pacific Automotive Aftermarket Glass Volume (K), by Country 2025 & 2033
- Figure 61: Asia Pacific Automotive Aftermarket Glass Revenue Share (%), by Country 2025 & 2033
- Figure 62: Asia Pacific Automotive Aftermarket Glass Volume Share (%), by Country 2025 & 2033
List of Tables
- Table 1: Global Automotive Aftermarket Glass Revenue million Forecast, by Application 2020 & 2033
- Table 2: Global Automotive Aftermarket Glass Volume K Forecast, by Application 2020 & 2033
- Table 3: Global Automotive Aftermarket Glass Revenue million Forecast, by Types 2020 & 2033
- Table 4: Global Automotive Aftermarket Glass Volume K Forecast, by Types 2020 & 2033
- Table 5: Global Automotive Aftermarket Glass Revenue million Forecast, by Region 2020 & 2033
- Table 6: Global Automotive Aftermarket Glass Volume K Forecast, by Region 2020 & 2033
- Table 7: Global Automotive Aftermarket Glass Revenue million Forecast, by Application 2020 & 2033
- Table 8: Global Automotive Aftermarket Glass Volume K Forecast, by Application 2020 & 2033
- Table 9: Global Automotive Aftermarket Glass Revenue million Forecast, by Types 2020 & 2033
- Table 10: Global Automotive Aftermarket Glass Volume K Forecast, by Types 2020 & 2033
- Table 11: Global Automotive Aftermarket Glass Revenue million Forecast, by Country 2020 & 2033
- Table 12: Global Automotive Aftermarket Glass Volume K Forecast, by Country 2020 & 2033
- Table 13: United States Automotive Aftermarket Glass Revenue (million) Forecast, by Application 2020 & 2033
- Table 14: United States Automotive Aftermarket Glass Volume (K) Forecast, by Application 2020 & 2033
- Table 15: Canada Automotive Aftermarket Glass Revenue (million) Forecast, by Application 2020 & 2033
- Table 16: Canada Automotive Aftermarket Glass Volume (K) Forecast, by Application 2020 & 2033
- Table 17: Mexico Automotive Aftermarket Glass Revenue (million) Forecast, by Application 2020 & 2033
- Table 18: Mexico Automotive Aftermarket Glass Volume (K) Forecast, by Application 2020 & 2033
- Table 19: Global Automotive Aftermarket Glass Revenue million Forecast, by Application 2020 & 2033
- Table 20: Global Automotive Aftermarket Glass Volume K Forecast, by Application 2020 & 2033
- Table 21: Global Automotive Aftermarket Glass Revenue million Forecast, by Types 2020 & 2033
- Table 22: Global Automotive Aftermarket Glass Volume K Forecast, by Types 2020 & 2033
- Table 23: Global Automotive Aftermarket Glass Revenue million Forecast, by Country 2020 & 2033
- Table 24: Global Automotive Aftermarket Glass Volume K Forecast, by Country 2020 & 2033
- Table 25: Brazil Automotive Aftermarket Glass Revenue (million) Forecast, by Application 2020 & 2033
- Table 26: Brazil Automotive Aftermarket Glass Volume (K) Forecast, by Application 2020 & 2033
- Table 27: Argentina Automotive Aftermarket Glass Revenue (million) Forecast, by Application 2020 & 2033
- Table 28: Argentina Automotive Aftermarket Glass Volume (K) Forecast, by Application 2020 & 2033
- Table 29: Rest of South America Automotive Aftermarket Glass Revenue (million) Forecast, by Application 2020 & 2033
- Table 30: Rest of South America Automotive Aftermarket Glass Volume (K) Forecast, by Application 2020 & 2033
- Table 31: Global Automotive Aftermarket Glass Revenue million Forecast, by Application 2020 & 2033
- Table 32: Global Automotive Aftermarket Glass Volume K Forecast, by Application 2020 & 2033
- Table 33: Global Automotive Aftermarket Glass Revenue million Forecast, by Types 2020 & 2033
- Table 34: Global Automotive Aftermarket Glass Volume K Forecast, by Types 2020 & 2033
- Table 35: Global Automotive Aftermarket Glass Revenue million Forecast, by Country 2020 & 2033
- Table 36: Global Automotive Aftermarket Glass Volume K Forecast, by Country 2020 & 2033
- Table 37: United Kingdom Automotive Aftermarket Glass Revenue (million) Forecast, by Application 2020 & 2033
- Table 38: United Kingdom Automotive Aftermarket Glass Volume (K) Forecast, by Application 2020 & 2033
- Table 39: Germany Automotive Aftermarket Glass Revenue (million) Forecast, by Application 2020 & 2033
- Table 40: Germany Automotive Aftermarket Glass Volume (K) Forecast, by Application 2020 & 2033
- Table 41: France Automotive Aftermarket Glass Revenue (million) Forecast, by Application 2020 & 2033
- Table 42: France Automotive Aftermarket Glass Volume (K) Forecast, by Application 2020 & 2033
- Table 43: Italy Automotive Aftermarket Glass Revenue (million) Forecast, by Application 2020 & 2033
- Table 44: Italy Automotive Aftermarket Glass Volume (K) Forecast, by Application 2020 & 2033
- Table 45: Spain Automotive Aftermarket Glass Revenue (million) Forecast, by Application 2020 & 2033
- Table 46: Spain Automotive Aftermarket Glass Volume (K) Forecast, by Application 2020 & 2033
- Table 47: Russia Automotive Aftermarket Glass Revenue (million) Forecast, by Application 2020 & 2033
- Table 48: Russia Automotive Aftermarket Glass Volume (K) Forecast, by Application 2020 & 2033
- Table 49: Benelux Automotive Aftermarket Glass Revenue (million) Forecast, by Application 2020 & 2033
- Table 50: Benelux Automotive Aftermarket Glass Volume (K) Forecast, by Application 2020 & 2033
- Table 51: Nordics Automotive Aftermarket Glass Revenue (million) Forecast, by Application 2020 & 2033
- Table 52: Nordics Automotive Aftermarket Glass Volume (K) Forecast, by Application 2020 & 2033
- Table 53: Rest of Europe Automotive Aftermarket Glass Revenue (million) Forecast, by Application 2020 & 2033
- Table 54: Rest of Europe Automotive Aftermarket Glass Volume (K) Forecast, by Application 2020 & 2033
- Table 55: Global Automotive Aftermarket Glass Revenue million Forecast, by Application 2020 & 2033
- Table 56: Global Automotive Aftermarket Glass Volume K Forecast, by Application 2020 & 2033
- Table 57: Global Automotive Aftermarket Glass Revenue million Forecast, by Types 2020 & 2033
- Table 58: Global Automotive Aftermarket Glass Volume K Forecast, by Types 2020 & 2033
- Table 59: Global Automotive Aftermarket Glass Revenue million Forecast, by Country 2020 & 2033
- Table 60: Global Automotive Aftermarket Glass Volume K Forecast, by Country 2020 & 2033
- Table 61: Turkey Automotive Aftermarket Glass Revenue (million) Forecast, by Application 2020 & 2033
- Table 62: Turkey Automotive Aftermarket Glass Volume (K) Forecast, by Application 2020 & 2033
- Table 63: Israel Automotive Aftermarket Glass Revenue (million) Forecast, by Application 2020 & 2033
- Table 64: Israel Automotive Aftermarket Glass Volume (K) Forecast, by Application 2020 & 2033
- Table 65: GCC Automotive Aftermarket Glass Revenue (million) Forecast, by Application 2020 & 2033
- Table 66: GCC Automotive Aftermarket Glass Volume (K) Forecast, by Application 2020 & 2033
- Table 67: North Africa Automotive Aftermarket Glass Revenue (million) Forecast, by Application 2020 & 2033
- Table 68: North Africa Automotive Aftermarket Glass Volume (K) Forecast, by Application 2020 & 2033
- Table 69: South Africa Automotive Aftermarket Glass Revenue (million) Forecast, by Application 2020 & 2033
- Table 70: South Africa Automotive Aftermarket Glass Volume (K) Forecast, by Application 2020 & 2033
- Table 71: Rest of Middle East & Africa Automotive Aftermarket Glass Revenue (million) Forecast, by Application 2020 & 2033
- Table 72: Rest of Middle East & Africa Automotive Aftermarket Glass Volume (K) Forecast, by Application 2020 & 2033
- Table 73: Global Automotive Aftermarket Glass Revenue million Forecast, by Application 2020 & 2033
- Table 74: Global Automotive Aftermarket Glass Volume K Forecast, by Application 2020 & 2033
- Table 75: Global Automotive Aftermarket Glass Revenue million Forecast, by Types 2020 & 2033
- Table 76: Global Automotive Aftermarket Glass Volume K Forecast, by Types 2020 & 2033
- Table 77: Global Automotive Aftermarket Glass Revenue million Forecast, by Country 2020 & 2033
- Table 78: Global Automotive Aftermarket Glass Volume K Forecast, by Country 2020 & 2033
- Table 79: China Automotive Aftermarket Glass Revenue (million) Forecast, by Application 2020 & 2033
- Table 80: China Automotive Aftermarket Glass Volume (K) Forecast, by Application 2020 & 2033
- Table 81: India Automotive Aftermarket Glass Revenue (million) Forecast, by Application 2020 & 2033
- Table 82: India Automotive Aftermarket Glass Volume (K) Forecast, by Application 2020 & 2033
- Table 83: Japan Automotive Aftermarket Glass Revenue (million) Forecast, by Application 2020 & 2033
- Table 84: Japan Automotive Aftermarket Glass Volume (K) Forecast, by Application 2020 & 2033
- Table 85: South Korea Automotive Aftermarket Glass Revenue (million) Forecast, by Application 2020 & 2033
- Table 86: South Korea Automotive Aftermarket Glass Volume (K) Forecast, by Application 2020 & 2033
- Table 87: ASEAN Automotive Aftermarket Glass Revenue (million) Forecast, by Application 2020 & 2033
- Table 88: ASEAN Automotive Aftermarket Glass Volume (K) Forecast, by Application 2020 & 2033
- Table 89: Oceania Automotive Aftermarket Glass Revenue (million) Forecast, by Application 2020 & 2033
- Table 90: Oceania Automotive Aftermarket Glass Volume (K) Forecast, by Application 2020 & 2033
- Table 91: Rest of Asia Pacific Automotive Aftermarket Glass Revenue (million) Forecast, by Application 2020 & 2033
- Table 92: Rest of Asia Pacific Automotive Aftermarket Glass Volume (K) Forecast, by Application 2020 & 2033
Frequently Asked Questions
1. What is the projected Compound Annual Growth Rate (CAGR) of the Automotive Aftermarket Glass?
The projected CAGR is approximately XX%.
2. Which companies are prominent players in the Automotive Aftermarket Glass?
Key companies in the market include Nippon Sheet Glass, Xinyi Glass, Fuyao Glass, AGC, Vitro, Saint Gobain, Carlex Glass America, Sisecam Group.
3. What are the main segments of the Automotive Aftermarket Glass?
The market segments include Application, Types.
4. Can you provide details about the market size?
The market size is estimated to be USD XXX million as of 2022.
5. What are some drivers contributing to market growth?
N/A
6. What are the notable trends driving market growth?
N/A
7. Are there any restraints impacting market growth?
N/A
8. Can you provide examples of recent developments in the market?
N/A
9. What pricing options are available for accessing the report?
Pricing options include single-user, multi-user, and enterprise licenses priced at USD 3350.00, USD 5025.00, and USD 6700.00 respectively.
10. Is the market size provided in terms of value or volume?
The market size is provided in terms of value, measured in million and volume, measured in K.
11. Are there any specific market keywords associated with the report?
Yes, the market keyword associated with the report is "Automotive Aftermarket Glass," which aids in identifying and referencing the specific market segment covered.
12. How do I determine which pricing option suits my needs best?
The pricing options vary based on user requirements and access needs. Individual users may opt for single-user licenses, while businesses requiring broader access may choose multi-user or enterprise licenses for cost-effective access to the report.
13. Are there any additional resources or data provided in the Automotive Aftermarket Glass report?
While the report offers comprehensive insights, it's advisable to review the specific contents or supplementary materials provided to ascertain if additional resources or data are available.
14. How can I stay updated on further developments or reports in the Automotive Aftermarket Glass?
To stay informed about further developments, trends, and reports in the Automotive Aftermarket Glass, consider subscribing to industry newsletters, following relevant companies and organizations, or regularly checking reputable industry news sources and publications.
Methodology
Step 1 - Identification of Relevant Samples Size from Population Database


Step 2 - Approaches for Defining Global Market Size (Value, Volume* & Price*)

Note*: In applicable scenarios
Step 3 - Data Sources
Primary Research
- Web Analytics
- Survey Reports
- Research Institute
- Latest Research Reports
- Opinion Leaders
Secondary Research
- Annual Reports
- White Paper
- Latest Press Release
- Industry Association
- Paid Database
- Investor Presentations

Step 4 - Data Triangulation
Involves using different sources of information in order to increase the validity of a study
These sources are likely to be stakeholders in a program - participants, other researchers, program staff, other community members, and so on.
Then we put all data in single framework & apply various statistical tools to find out the dynamic on the market.
During the analysis stage, feedback from the stakeholder groups would be compared to determine areas of agreement as well as areas of divergence