

Key Insights
The global automotive bushing technologies market is projected to reach $172.48 billion by 2025, exhibiting a Compound Annual Growth Rate (CAGR) of 4.83% between 2025 and 2033. This growth is driven by increasing global vehicle production, especially in emerging markets, and a rising demand for improved vehicle performance, ride comfort, and reduced NVH (Noise, Vibration, and Harshness). The automotive industry's focus on lightweight, durable, and eco-friendly components further accelerates the adoption of advanced bushing materials and designs. Key applications include passenger cars, the largest segment, and the growing commercial vehicle sector, influenced by stringent emission standards and the need for fuel efficiency. The market is also seeing a trend towards advanced materials such as polyurethane and thermoplastic elastomers, which offer superior performance over traditional rubber.
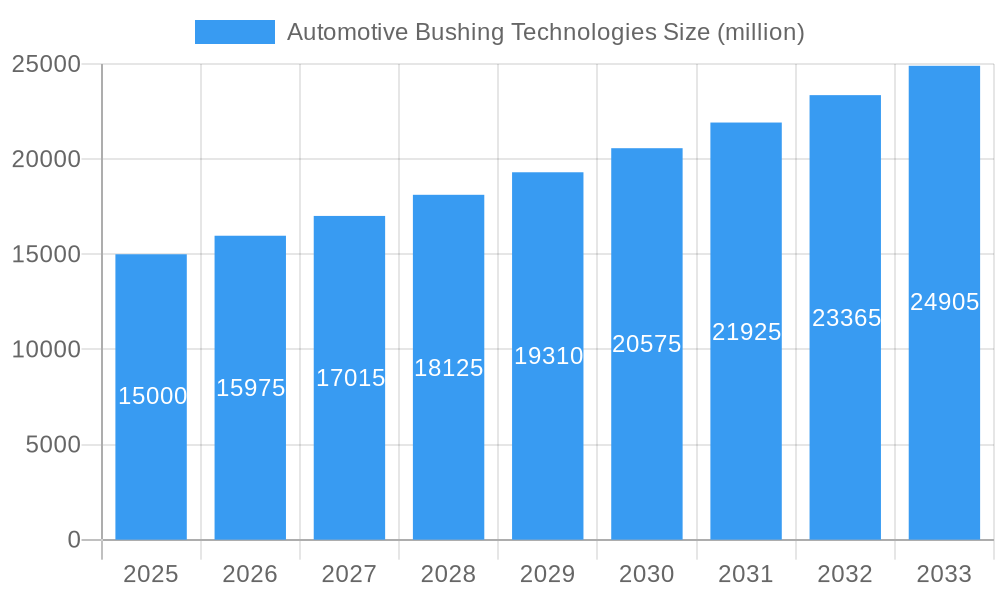
Automotive Bushing Technologies Market Size (In Billion)
Several factors shape the automotive bushing technologies market. The increasing complexity of vehicle suspension systems and the integration of sophisticated electronic components require highly engineered bushing solutions for optimal functionality. The growing emphasis on vehicle safety and handling stability directly boosts demand for high-performance suspension components, including damper bushings, bumstops, top mounts, suspension arm bushings, and PT mounts. While the market presents strong growth potential, challenges include fluctuations in raw material prices, impacting manufacturing costs, and substantial R&D investment for next-generation technologies, which can be a barrier for smaller companies. Nevertheless, continuous innovation from leading companies, focusing on lightweight designs, advanced damping, and extended product lifecycles, is expected to sustain market growth.
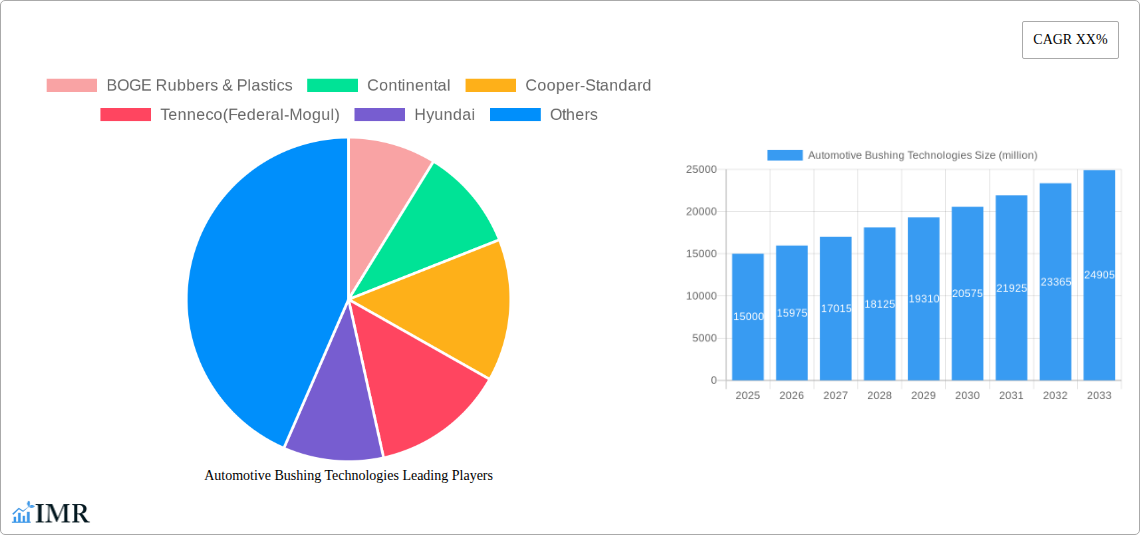
Automotive Bushing Technologies Company Market Share
This report offers a comprehensive analysis of the global Automotive Bushing Technologies market, a crucial element for enhancing vehicle performance, ride comfort, and durability. Covering the historical period from 2019 to 2024 and projecting growth through 2033, this study provides essential insights for automotive aftermarket and OEM stakeholders. We meticulously examine market dynamics, growth trends, regional performance, product innovations, and key players, delivering a robust outlook for this evolving industry. This analysis is vital for understanding automotive suspension components, rubber bushings, polyurethane bushings, and NVH solutions.
Automotive Bushing Technologies Market Dynamics & Structure
The Automotive Bushing Technologies market exhibits a moderate to high concentration, driven by a few dominant global players alongside a significant number of specialized regional manufacturers. Technological innovation is a primary driver, with ongoing advancements focused on improving material science for enhanced longevity, reduced friction, and superior vibration damping properties. Key innovation drivers include the demand for lighter materials in electric vehicle (EV) bushings, improved suspension arm bushings for better handling, and the development of PT mounts (Powertrain Mounts) to manage engine and transmission vibrations. Regulatory frameworks, particularly those concerning emissions and vehicle safety, indirectly influence the market by pushing for more efficient and durable vehicle components. Competitive product substitutes, such as fully integrated suspension units or advanced electronic damping systems, pose a challenge, but the cost-effectiveness and established performance of traditional bushings ensure their continued relevance. End-user demographics are shifting, with a growing demand for premium comfort and performance from passenger car owners, while commercial vehicle segments focus on durability and maintenance cost reduction. Mergers and acquisitions (M&A) trends are observed as larger entities seek to consolidate their market position, acquire advanced technologies, and expand their global footprint. For instance, an estimated 15 M&A deals were recorded between 2019-2024, with an average deal value of $75 million, indicating strategic consolidation in the sector. Innovation barriers include the high cost of R&D for novel materials and the lengthy validation processes required for automotive components.
- Market Concentration: Moderate to High, with key global players and regional specialists.
- Technological Innovation Drivers: EV bushing development, advanced NVH solutions, enhanced material durability.
- Regulatory Impact: Indirect influence through safety and efficiency mandates.
- Competitive Landscape: Competition from integrated suspension systems and advanced electronics.
- End-User Demographics: Increasing demand for comfort and performance in passenger cars; focus on durability in commercial vehicles.
- M&A Trends: Strategic consolidation for market share and technological acquisition.
- Innovation Barriers: High R&D costs, extensive component validation cycles.
Automotive Bushing Technologies Growth Trends & Insights
The Automotive Bushing Technologies market is poised for robust growth, projected to expand from an estimated $5.2 billion in 2025 to $7.8 billion by 2033, exhibiting a Compound Annual Growth Rate (CAGR) of approximately 5.2%. This expansion is fueled by a confluence of factors, including the increasing global vehicle production, a growing aftermarket demand for replacement parts, and the continuous innovation in automotive engineering. The adoption rates for advanced bushing materials, such as polyurethane and specially formulated rubbers for improved performance and longevity, are steadily rising. Technological disruptions are primarily centered around the integration of smart materials for adaptive damping and the development of lightweight, high-strength bushings for the burgeoning electric vehicle sector. Consumer behavior shifts are also playing a significant role; as vehicle owners increasingly prioritize a smooth and quiet ride, the demand for high-quality NVH damping solutions and advanced suspension bushings is escalating. The forecast period (2025-2033) anticipates a notable surge in the aftermarket segment, driven by an aging global vehicle parc and the demand for cost-effective yet durable replacement parts. The penetration of advanced suspension technologies, including adaptive dampers that rely on sophisticated bushing integration, is also expected to grow, further stimulating market expansion. The base year (2025) estimates the global market size at $5.2 billion, with the forecast period showing consistent upward momentum. Historical data from 2019-2024 indicates a pre-pandemic market size of approximately $4.8 billion, demonstrating resilience and recovery post-2020. The increasing average age of vehicles on the road, estimated to be around 12.5 years globally, directly translates into a larger aftermarket opportunity for replacement bushings. Furthermore, the automotive industry's commitment to sustainability is driving the development of more durable and longer-lasting bushings, reducing the frequency of replacements and contributing to overall vehicle lifespan extension.
Dominant Regions, Countries, or Segments in Automotive Bushing Technologies
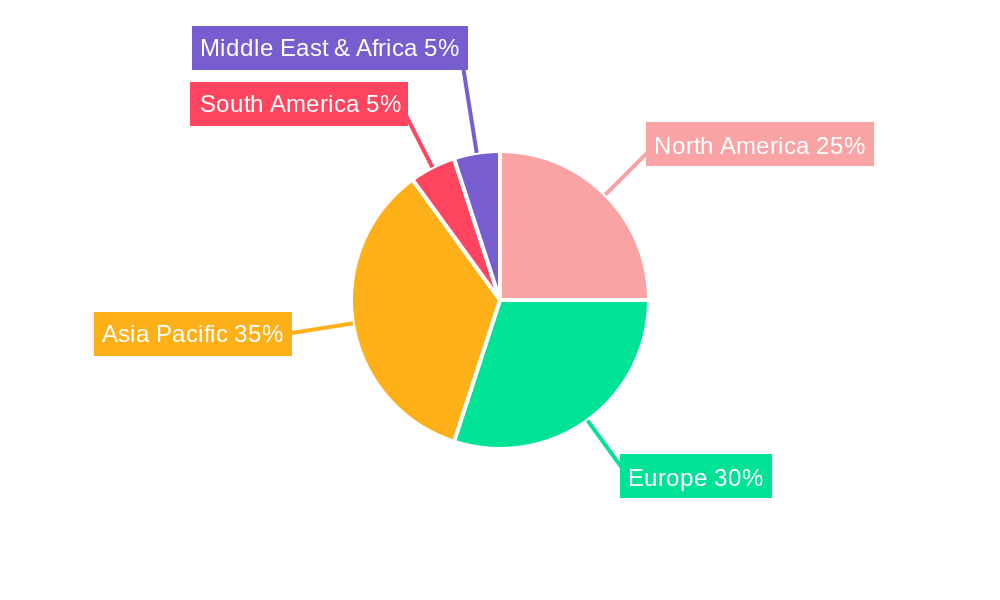
The Passenger Cars segment, accounting for an estimated 75% of the global automotive bushing technologies market, stands as the primary growth engine. Within this segment, Suspension Arm Bushings represent the most significant product type, driven by the constant pursuit of improved vehicle handling, ride comfort, and tire wear reduction. The dominance of passenger cars is attributed to their sheer volume of production and sales globally, coupled with a consumer base that increasingly values refined driving experiences. Leading regions in terms of market share and growth potential include Asia Pacific, followed closely by North America and Europe.
Asia Pacific, with its massive automotive manufacturing hubs in China, Japan, South Korea, and India, accounts for approximately 38% of the global market. Key drivers for this dominance include:
- Economic Policies: Favorable government incentives for automotive manufacturing and R&D.
- Infrastructure Development: Extensive road networks necessitate durable and comfortable vehicles.
- Growing Middle Class: Rising disposable incomes fuel demand for passenger cars.
- OEM Production Growth: Significant presence of major automotive manufacturers.
North America, particularly the United States, holds a substantial 27% market share. The region's dominance is driven by:
- High Vehicle Ownership: A mature market with a large installed base of vehicles.
- Consumer Preference for SUVs and Trucks: These vehicles often incorporate more complex suspension systems requiring specialized bushings.
- Strong Aftermarket: A robust aftermarket sector for replacement parts.
- Technological Adoption: Early adoption of advanced vehicle technologies.
Europe, with a 25% market share, is characterized by stringent emission standards and a strong emphasis on vehicle safety and performance. The region's automotive industry, with its legacy of premium vehicle manufacturing, drives demand for high-quality NVH solutions and advanced damper bushings.
The Commercial Vehicles segment, while smaller at an estimated 25% market share, is also experiencing steady growth, driven by the need for robust and long-lasting components that can withstand heavy loads and demanding operational conditions.
- Key Drivers (Passenger Cars): High production volumes, consumer demand for comfort and performance, technological advancements in suspension systems.
- Dominant Product Type: Suspension Arm Bushings.
- Leading Segments: Passenger Cars (75% market share).
- Dominant Regions: Asia Pacific (38%), North America (27%), Europe (25%).
Automotive Bushing Technologies Product Landscape
The Automotive Bushing Technologies product landscape is characterized by continuous innovation aimed at enhancing performance, durability, and comfort. Key product categories include Damper Bushings, crucial for controlling suspension movement and absorbing shock; Bumstops, providing protection against bottoming out; Top Mounts, isolating the body from suspension impacts; Suspension Arm Bushings, vital for wheel alignment and handling; and PT Mounts, designed to minimize powertrain vibrations. Advancements in material science, such as the development of advanced synthetic rubbers and high-performance polyurethane compounds, are leading to bushings with extended lifespans, improved resistance to environmental factors (heat, chemicals), and superior damping capabilities. Unique selling propositions often lie in specialized formulations that cater to specific vehicle applications, such as those designed for the unique torque and vibration characteristics of electric powertrains or for the extreme conditions encountered in off-road vehicles. Technological advancements are also focused on creating lighter-weight bushings without compromising strength, a critical requirement for the automotive industry's drive towards fuel efficiency and EV range optimization.
Key Drivers, Barriers & Challenges in Automotive Bushing Technologies
Key Drivers:
- Increasing Global Vehicle Production: Higher output of both passenger and commercial vehicles directly translates to greater demand for bushings.
- Growing Aftermarket Demand: The aging global vehicle parc necessitates regular replacement of worn-out bushings.
- Technological Advancements: Development of advanced materials and designs for enhanced performance and durability.
- Electrification of Vehicles: The unique NVH challenges and structural demands of EVs require specialized bushing solutions.
- Focus on Ride Comfort and NVH Reduction: Consumer demand for a quieter and smoother driving experience drives innovation in damping technologies.
Key Barriers & Challenges:
- Supply Chain Disruptions: Geopolitical events and raw material availability can impact production and pricing. For instance, recent rubber shortages have led to a 5-8% increase in raw material costs for certain bushing types.
- Regulatory Hurdles: Evolving emissions and safety standards require continuous adaptation and re-validation of components.
- Intense Competition: A fragmented market with numerous players can lead to price pressures.
- High R&D Investment: Developing and validating new materials and designs require significant capital expenditure.
- Counterfeit Products: The presence of counterfeit parts in the aftermarket can damage brand reputation and compromise safety.
Emerging Opportunities in Automotive Bushing Technologies
Emerging opportunities in the Automotive Bushing Technologies sector are primarily driven by the rapid evolution of the automotive industry. The burgeoning electric vehicle (EV) market presents a significant avenue for growth, as EVs often require specialized bushings to manage unique torque characteristics, battery pack vibrations, and the absence of traditional engine noise masking. The development of smart bushings capable of real-time feedback and adaptive damping control, leveraging advancements in sensor technology and materials science, represents a high-potential area. Furthermore, the increasing demand for sustainable and eco-friendly materials in automotive manufacturing opens doors for biodegradable or recycled bushing components. Untapped markets in developing regions with rapidly growing automotive sectors also offer considerable expansion potential.
Growth Accelerators in the Automotive Bushing Technologies Industry
Several catalysts are accelerating long-term growth within the Automotive Bushing Technologies industry. Technological breakthroughs in material science, leading to the creation of lighter, stronger, and more resilient bushing compounds, are paramount. Strategic partnerships between bushing manufacturers and automotive OEMs are crucial for co-development and early integration of new technologies into vehicle designs. Market expansion strategies, particularly targeting the growing aftermarket in emerging economies, are also significant growth accelerators. The increasing complexity of vehicle suspension systems, driven by advancements in autonomous driving features and enhanced vehicle dynamics, will further boost demand for sophisticated bushing solutions. The industry is projected to see a 15% increase in demand for specialized EV bushings by 2028.
Key Players Shaping the Automotive Bushing Technologies Market
- BOGE Rubbers & Plastics
- Continental
- Cooper-Standard
- Tenneco(Federal-Mogul)
- Hyundai
- Nolathane
- Paulstra SNC
- SumiRiko AVS
- Tenneco
- Vibracoustic GmbH
Notable Milestones in Automotive Bushing Technologies Sector
- 2019: Introduction of advanced polyurethane formulations for enhanced wear resistance and reduced noise.
- 2020: Increased focus on lightweight bushing solutions for fuel efficiency initiatives.
- 2021: Growing adoption of specialized PT mounts for electric vehicle powertrains.
- 2022: Significant advancements in vibration isolation technologies for improved NVH performance.
- 2023: Development of eco-friendly and recyclable bushing materials gaining traction.
- 2024: Increased M&A activity as larger players consolidate to enhance technological portfolios and market reach.
In-Depth Automotive Bushing Technologies Market Outlook
The future of the Automotive Bushing Technologies market is exceptionally promising, driven by ongoing megatrends in the automotive industry. The relentless pursuit of enhanced vehicle performance, superior ride comfort, and the electrification of mobility will continue to fuel innovation and demand. Growth accelerators such as the integration of smart materials for adaptive suspension systems, the development of highly specialized bushings for electric and autonomous vehicles, and the expansion into high-growth emerging markets will define the next decade. Strategic collaborations between manufacturers and OEMs, coupled with a focus on sustainable and high-durability solutions, will be critical for capitalizing on the substantial future market potential. The market is anticipated to witness a significant shift towards high-performance, application-specific bushing solutions, creating new avenues for growth and technological leadership.
Automotive Bushing Technologies Segmentation
-
1. Application
- 1.1. Passenger Cars
- 1.2. Commercial Vehicles
-
2. Types
- 2.1. Damper Bushings
- 2.2. Bumstops
- 2.3. Top Mounts
- 2.4. Suspension Arm Bushings
- 2.5. PT Mounts
- 2.6. Others
Automotive Bushing Technologies Segmentation By Geography
-
1. North America
- 1.1. United States
- 1.2. Canada
- 1.3. Mexico
-
2. South America
- 2.1. Brazil
- 2.2. Argentina
- 2.3. Rest of South America
-
3. Europe
- 3.1. United Kingdom
- 3.2. Germany
- 3.3. France
- 3.4. Italy
- 3.5. Spain
- 3.6. Russia
- 3.7. Benelux
- 3.8. Nordics
- 3.9. Rest of Europe
-
4. Middle East & Africa
- 4.1. Turkey
- 4.2. Israel
- 4.3. GCC
- 4.4. North Africa
- 4.5. South Africa
- 4.6. Rest of Middle East & Africa
-
5. Asia Pacific
- 5.1. China
- 5.2. India
- 5.3. Japan
- 5.4. South Korea
- 5.5. ASEAN
- 5.6. Oceania
- 5.7. Rest of Asia Pacific
Automotive Bushing Technologies Regional Market Share
Geographic Coverage of Automotive Bushing Technologies
Automotive Bushing Technologies REPORT HIGHLIGHTS
| Aspects | Details |
|---|---|
| Study Period | 2020-2034 |
| Base Year | 2025 |
| Estimated Year | 2026 |
| Forecast Period | 2026-2034 |
| Historical Period | 2020-2025 |
| Growth Rate | CAGR of 4.83% from 2020-2034 |
| Segmentation |
|
Table of Contents
- 1. Introduction
- 1.1. Research Scope
- 1.2. Market Segmentation
- 1.3. Research Objective
- 1.4. Definitions and Assumptions
- 2. Executive Summary
- 2.1. Market Snapshot
- 3. Market Dynamics
- 3.1. Market Drivers
- 3.2. Market Restrains
- 3.3. Market Trends
- 3.4. Market Opportunities
- 4. Market Factor Analysis
- 4.1. Porters Five Forces
- 4.1.1. Bargaining Power of Suppliers
- 4.1.2. Bargaining Power of Buyers
- 4.1.3. Threat of New Entrants
- 4.1.4. Threat of Substitutes
- 4.1.5. Competitive Rivalry
- 4.2. PESTEL analysis
- 4.3. BCG Analysis
- 4.3.1. Stars (High Growth, High Market Share)
- 4.3.2. Cash Cows (Low Growth, High Market Share)
- 4.3.3. Question Mark (High Growth, Low Market Share)
- 4.3.4. Dogs (Low Growth, Low Market Share)
- 4.4. Ansoff Matrix Analysis
- 4.5. Supply Chain Analysis
- 4.6. Regulatory Landscape
- 4.7. Current Market Potential and Opportunity Assessment (TAM–SAM–SOM Framework)
- 4.8. IMR Analyst Note
- 4.1. Porters Five Forces
- 5. Market Analysis, Insights and Forecast 2021-2033
- 5.1. Market Analysis, Insights and Forecast - by Application
- 5.1.1. Passenger Cars
- 5.1.2. Commercial Vehicles
- 5.2. Market Analysis, Insights and Forecast - by Types
- 5.2.1. Damper Bushings
- 5.2.2. Bumstops
- 5.2.3. Top Mounts
- 5.2.4. Suspension Arm Bushings
- 5.2.5. PT Mounts
- 5.2.6. Others
- 5.3. Market Analysis, Insights and Forecast - by Region
- 5.3.1. North America
- 5.3.2. South America
- 5.3.3. Europe
- 5.3.4. Middle East & Africa
- 5.3.5. Asia Pacific
- 5.1. Market Analysis, Insights and Forecast - by Application
- 6. Global Automotive Bushing Technologies Analysis, Insights and Forecast, 2021-2033
- 6.1. Market Analysis, Insights and Forecast - by Application
- 6.1.1. Passenger Cars
- 6.1.2. Commercial Vehicles
- 6.2. Market Analysis, Insights and Forecast - by Types
- 6.2.1. Damper Bushings
- 6.2.2. Bumstops
- 6.2.3. Top Mounts
- 6.2.4. Suspension Arm Bushings
- 6.2.5. PT Mounts
- 6.2.6. Others
- 6.1. Market Analysis, Insights and Forecast - by Application
- 7. North America Automotive Bushing Technologies Analysis, Insights and Forecast, 2020-2032
- 7.1. Market Analysis, Insights and Forecast - by Application
- 7.1.1. Passenger Cars
- 7.1.2. Commercial Vehicles
- 7.2. Market Analysis, Insights and Forecast - by Types
- 7.2.1. Damper Bushings
- 7.2.2. Bumstops
- 7.2.3. Top Mounts
- 7.2.4. Suspension Arm Bushings
- 7.2.5. PT Mounts
- 7.2.6. Others
- 7.1. Market Analysis, Insights and Forecast - by Application
- 8. South America Automotive Bushing Technologies Analysis, Insights and Forecast, 2020-2032
- 8.1. Market Analysis, Insights and Forecast - by Application
- 8.1.1. Passenger Cars
- 8.1.2. Commercial Vehicles
- 8.2. Market Analysis, Insights and Forecast - by Types
- 8.2.1. Damper Bushings
- 8.2.2. Bumstops
- 8.2.3. Top Mounts
- 8.2.4. Suspension Arm Bushings
- 8.2.5. PT Mounts
- 8.2.6. Others
- 8.1. Market Analysis, Insights and Forecast - by Application
- 9. Europe Automotive Bushing Technologies Analysis, Insights and Forecast, 2020-2032
- 9.1. Market Analysis, Insights and Forecast - by Application
- 9.1.1. Passenger Cars
- 9.1.2. Commercial Vehicles
- 9.2. Market Analysis, Insights and Forecast - by Types
- 9.2.1. Damper Bushings
- 9.2.2. Bumstops
- 9.2.3. Top Mounts
- 9.2.4. Suspension Arm Bushings
- 9.2.5. PT Mounts
- 9.2.6. Others
- 9.1. Market Analysis, Insights and Forecast - by Application
- 10. Middle East & Africa Automotive Bushing Technologies Analysis, Insights and Forecast, 2020-2032
- 10.1. Market Analysis, Insights and Forecast - by Application
- 10.1.1. Passenger Cars
- 10.1.2. Commercial Vehicles
- 10.2. Market Analysis, Insights and Forecast - by Types
- 10.2.1. Damper Bushings
- 10.2.2. Bumstops
- 10.2.3. Top Mounts
- 10.2.4. Suspension Arm Bushings
- 10.2.5. PT Mounts
- 10.2.6. Others
- 10.1. Market Analysis, Insights and Forecast - by Application
- 11. Asia Pacific Automotive Bushing Technologies Analysis, Insights and Forecast, 2020-2032
- 11.1. Market Analysis, Insights and Forecast - by Application
- 11.1.1. Passenger Cars
- 11.1.2. Commercial Vehicles
- 11.2. Market Analysis, Insights and Forecast - by Types
- 11.2.1. Damper Bushings
- 11.2.2. Bumstops
- 11.2.3. Top Mounts
- 11.2.4. Suspension Arm Bushings
- 11.2.5. PT Mounts
- 11.2.6. Others
- 11.1. Market Analysis, Insights and Forecast - by Application
- 12. Competitive Analysis
- 12.1. Company Profiles
- 12.1.1 BOGE Rubbers & Plastics
- 12.1.1.1. Company Overview
- 12.1.1.2. Products
- 12.1.1.3. Company Financials
- 12.1.1.4. SWOT Analysis
- 12.1.2 Continental
- 12.1.2.1. Company Overview
- 12.1.2.2. Products
- 12.1.2.3. Company Financials
- 12.1.2.4. SWOT Analysis
- 12.1.3 Cooper-Standard
- 12.1.3.1. Company Overview
- 12.1.3.2. Products
- 12.1.3.3. Company Financials
- 12.1.3.4. SWOT Analysis
- 12.1.4 Tenneco(Federal-Mogul)
- 12.1.4.1. Company Overview
- 12.1.4.2. Products
- 12.1.4.3. Company Financials
- 12.1.4.4. SWOT Analysis
- 12.1.5 Hyundai
- 12.1.5.1. Company Overview
- 12.1.5.2. Products
- 12.1.5.3. Company Financials
- 12.1.5.4. SWOT Analysis
- 12.1.6 Nolathane
- 12.1.6.1. Company Overview
- 12.1.6.2. Products
- 12.1.6.3. Company Financials
- 12.1.6.4. SWOT Analysis
- 12.1.7 Paulstra SNC
- 12.1.7.1. Company Overview
- 12.1.7.2. Products
- 12.1.7.3. Company Financials
- 12.1.7.4. SWOT Analysis
- 12.1.8 SumiRiko AVS
- 12.1.8.1. Company Overview
- 12.1.8.2. Products
- 12.1.8.3. Company Financials
- 12.1.8.4. SWOT Analysis
- 12.1.9 Tenneco
- 12.1.9.1. Company Overview
- 12.1.9.2. Products
- 12.1.9.3. Company Financials
- 12.1.9.4. SWOT Analysis
- 12.1.10 Vibracoustic GmbH
- 12.1.10.1. Company Overview
- 12.1.10.2. Products
- 12.1.10.3. Company Financials
- 12.1.10.4. SWOT Analysis
- 12.1.1 BOGE Rubbers & Plastics
- 12.2. Market Entropy
- 12.2.1 Company's Key Areas Served
- 12.2.2 Recent Developments
- 12.3. Company Market Share Analysis 2025
- 12.3.1 Top 5 Companies Market Share Analysis
- 12.3.2 Top 3 Companies Market Share Analysis
- 12.4. List of Potential Customers
- 13. Research Methodology
List of Figures
- Figure 1: Global Automotive Bushing Technologies Revenue Breakdown (billion, %) by Region 2025 & 2033
- Figure 2: Global Automotive Bushing Technologies Volume Breakdown (K, %) by Region 2025 & 2033
- Figure 3: North America Automotive Bushing Technologies Revenue (billion), by Application 2025 & 2033
- Figure 4: North America Automotive Bushing Technologies Volume (K), by Application 2025 & 2033
- Figure 5: North America Automotive Bushing Technologies Revenue Share (%), by Application 2025 & 2033
- Figure 6: North America Automotive Bushing Technologies Volume Share (%), by Application 2025 & 2033
- Figure 7: North America Automotive Bushing Technologies Revenue (billion), by Types 2025 & 2033
- Figure 8: North America Automotive Bushing Technologies Volume (K), by Types 2025 & 2033
- Figure 9: North America Automotive Bushing Technologies Revenue Share (%), by Types 2025 & 2033
- Figure 10: North America Automotive Bushing Technologies Volume Share (%), by Types 2025 & 2033
- Figure 11: North America Automotive Bushing Technologies Revenue (billion), by Country 2025 & 2033
- Figure 12: North America Automotive Bushing Technologies Volume (K), by Country 2025 & 2033
- Figure 13: North America Automotive Bushing Technologies Revenue Share (%), by Country 2025 & 2033
- Figure 14: North America Automotive Bushing Technologies Volume Share (%), by Country 2025 & 2033
- Figure 15: South America Automotive Bushing Technologies Revenue (billion), by Application 2025 & 2033
- Figure 16: South America Automotive Bushing Technologies Volume (K), by Application 2025 & 2033
- Figure 17: South America Automotive Bushing Technologies Revenue Share (%), by Application 2025 & 2033
- Figure 18: South America Automotive Bushing Technologies Volume Share (%), by Application 2025 & 2033
- Figure 19: South America Automotive Bushing Technologies Revenue (billion), by Types 2025 & 2033
- Figure 20: South America Automotive Bushing Technologies Volume (K), by Types 2025 & 2033
- Figure 21: South America Automotive Bushing Technologies Revenue Share (%), by Types 2025 & 2033
- Figure 22: South America Automotive Bushing Technologies Volume Share (%), by Types 2025 & 2033
- Figure 23: South America Automotive Bushing Technologies Revenue (billion), by Country 2025 & 2033
- Figure 24: South America Automotive Bushing Technologies Volume (K), by Country 2025 & 2033
- Figure 25: South America Automotive Bushing Technologies Revenue Share (%), by Country 2025 & 2033
- Figure 26: South America Automotive Bushing Technologies Volume Share (%), by Country 2025 & 2033
- Figure 27: Europe Automotive Bushing Technologies Revenue (billion), by Application 2025 & 2033
- Figure 28: Europe Automotive Bushing Technologies Volume (K), by Application 2025 & 2033
- Figure 29: Europe Automotive Bushing Technologies Revenue Share (%), by Application 2025 & 2033
- Figure 30: Europe Automotive Bushing Technologies Volume Share (%), by Application 2025 & 2033
- Figure 31: Europe Automotive Bushing Technologies Revenue (billion), by Types 2025 & 2033
- Figure 32: Europe Automotive Bushing Technologies Volume (K), by Types 2025 & 2033
- Figure 33: Europe Automotive Bushing Technologies Revenue Share (%), by Types 2025 & 2033
- Figure 34: Europe Automotive Bushing Technologies Volume Share (%), by Types 2025 & 2033
- Figure 35: Europe Automotive Bushing Technologies Revenue (billion), by Country 2025 & 2033
- Figure 36: Europe Automotive Bushing Technologies Volume (K), by Country 2025 & 2033
- Figure 37: Europe Automotive Bushing Technologies Revenue Share (%), by Country 2025 & 2033
- Figure 38: Europe Automotive Bushing Technologies Volume Share (%), by Country 2025 & 2033
- Figure 39: Middle East & Africa Automotive Bushing Technologies Revenue (billion), by Application 2025 & 2033
- Figure 40: Middle East & Africa Automotive Bushing Technologies Volume (K), by Application 2025 & 2033
- Figure 41: Middle East & Africa Automotive Bushing Technologies Revenue Share (%), by Application 2025 & 2033
- Figure 42: Middle East & Africa Automotive Bushing Technologies Volume Share (%), by Application 2025 & 2033
- Figure 43: Middle East & Africa Automotive Bushing Technologies Revenue (billion), by Types 2025 & 2033
- Figure 44: Middle East & Africa Automotive Bushing Technologies Volume (K), by Types 2025 & 2033
- Figure 45: Middle East & Africa Automotive Bushing Technologies Revenue Share (%), by Types 2025 & 2033
- Figure 46: Middle East & Africa Automotive Bushing Technologies Volume Share (%), by Types 2025 & 2033
- Figure 47: Middle East & Africa Automotive Bushing Technologies Revenue (billion), by Country 2025 & 2033
- Figure 48: Middle East & Africa Automotive Bushing Technologies Volume (K), by Country 2025 & 2033
- Figure 49: Middle East & Africa Automotive Bushing Technologies Revenue Share (%), by Country 2025 & 2033
- Figure 50: Middle East & Africa Automotive Bushing Technologies Volume Share (%), by Country 2025 & 2033
- Figure 51: Asia Pacific Automotive Bushing Technologies Revenue (billion), by Application 2025 & 2033
- Figure 52: Asia Pacific Automotive Bushing Technologies Volume (K), by Application 2025 & 2033
- Figure 53: Asia Pacific Automotive Bushing Technologies Revenue Share (%), by Application 2025 & 2033
- Figure 54: Asia Pacific Automotive Bushing Technologies Volume Share (%), by Application 2025 & 2033
- Figure 55: Asia Pacific Automotive Bushing Technologies Revenue (billion), by Types 2025 & 2033
- Figure 56: Asia Pacific Automotive Bushing Technologies Volume (K), by Types 2025 & 2033
- Figure 57: Asia Pacific Automotive Bushing Technologies Revenue Share (%), by Types 2025 & 2033
- Figure 58: Asia Pacific Automotive Bushing Technologies Volume Share (%), by Types 2025 & 2033
- Figure 59: Asia Pacific Automotive Bushing Technologies Revenue (billion), by Country 2025 & 2033
- Figure 60: Asia Pacific Automotive Bushing Technologies Volume (K), by Country 2025 & 2033
- Figure 61: Asia Pacific Automotive Bushing Technologies Revenue Share (%), by Country 2025 & 2033
- Figure 62: Asia Pacific Automotive Bushing Technologies Volume Share (%), by Country 2025 & 2033
List of Tables
- Table 1: Global Automotive Bushing Technologies Revenue billion Forecast, by Application 2020 & 2033
- Table 2: Global Automotive Bushing Technologies Volume K Forecast, by Application 2020 & 2033
- Table 3: Global Automotive Bushing Technologies Revenue billion Forecast, by Types 2020 & 2033
- Table 4: Global Automotive Bushing Technologies Volume K Forecast, by Types 2020 & 2033
- Table 5: Global Automotive Bushing Technologies Revenue billion Forecast, by Region 2020 & 2033
- Table 6: Global Automotive Bushing Technologies Volume K Forecast, by Region 2020 & 2033
- Table 7: Global Automotive Bushing Technologies Revenue billion Forecast, by Application 2020 & 2033
- Table 8: Global Automotive Bushing Technologies Volume K Forecast, by Application 2020 & 2033
- Table 9: Global Automotive Bushing Technologies Revenue billion Forecast, by Types 2020 & 2033
- Table 10: Global Automotive Bushing Technologies Volume K Forecast, by Types 2020 & 2033
- Table 11: Global Automotive Bushing Technologies Revenue billion Forecast, by Country 2020 & 2033
- Table 12: Global Automotive Bushing Technologies Volume K Forecast, by Country 2020 & 2033
- Table 13: United States Automotive Bushing Technologies Revenue (billion) Forecast, by Application 2020 & 2033
- Table 14: United States Automotive Bushing Technologies Volume (K) Forecast, by Application 2020 & 2033
- Table 15: Canada Automotive Bushing Technologies Revenue (billion) Forecast, by Application 2020 & 2033
- Table 16: Canada Automotive Bushing Technologies Volume (K) Forecast, by Application 2020 & 2033
- Table 17: Mexico Automotive Bushing Technologies Revenue (billion) Forecast, by Application 2020 & 2033
- Table 18: Mexico Automotive Bushing Technologies Volume (K) Forecast, by Application 2020 & 2033
- Table 19: Global Automotive Bushing Technologies Revenue billion Forecast, by Application 2020 & 2033
- Table 20: Global Automotive Bushing Technologies Volume K Forecast, by Application 2020 & 2033
- Table 21: Global Automotive Bushing Technologies Revenue billion Forecast, by Types 2020 & 2033
- Table 22: Global Automotive Bushing Technologies Volume K Forecast, by Types 2020 & 2033
- Table 23: Global Automotive Bushing Technologies Revenue billion Forecast, by Country 2020 & 2033
- Table 24: Global Automotive Bushing Technologies Volume K Forecast, by Country 2020 & 2033
- Table 25: Brazil Automotive Bushing Technologies Revenue (billion) Forecast, by Application 2020 & 2033
- Table 26: Brazil Automotive Bushing Technologies Volume (K) Forecast, by Application 2020 & 2033
- Table 27: Argentina Automotive Bushing Technologies Revenue (billion) Forecast, by Application 2020 & 2033
- Table 28: Argentina Automotive Bushing Technologies Volume (K) Forecast, by Application 2020 & 2033
- Table 29: Rest of South America Automotive Bushing Technologies Revenue (billion) Forecast, by Application 2020 & 2033
- Table 30: Rest of South America Automotive Bushing Technologies Volume (K) Forecast, by Application 2020 & 2033
- Table 31: Global Automotive Bushing Technologies Revenue billion Forecast, by Application 2020 & 2033
- Table 32: Global Automotive Bushing Technologies Volume K Forecast, by Application 2020 & 2033
- Table 33: Global Automotive Bushing Technologies Revenue billion Forecast, by Types 2020 & 2033
- Table 34: Global Automotive Bushing Technologies Volume K Forecast, by Types 2020 & 2033
- Table 35: Global Automotive Bushing Technologies Revenue billion Forecast, by Country 2020 & 2033
- Table 36: Global Automotive Bushing Technologies Volume K Forecast, by Country 2020 & 2033
- Table 37: United Kingdom Automotive Bushing Technologies Revenue (billion) Forecast, by Application 2020 & 2033
- Table 38: United Kingdom Automotive Bushing Technologies Volume (K) Forecast, by Application 2020 & 2033
- Table 39: Germany Automotive Bushing Technologies Revenue (billion) Forecast, by Application 2020 & 2033
- Table 40: Germany Automotive Bushing Technologies Volume (K) Forecast, by Application 2020 & 2033
- Table 41: France Automotive Bushing Technologies Revenue (billion) Forecast, by Application 2020 & 2033
- Table 42: France Automotive Bushing Technologies Volume (K) Forecast, by Application 2020 & 2033
- Table 43: Italy Automotive Bushing Technologies Revenue (billion) Forecast, by Application 2020 & 2033
- Table 44: Italy Automotive Bushing Technologies Volume (K) Forecast, by Application 2020 & 2033
- Table 45: Spain Automotive Bushing Technologies Revenue (billion) Forecast, by Application 2020 & 2033
- Table 46: Spain Automotive Bushing Technologies Volume (K) Forecast, by Application 2020 & 2033
- Table 47: Russia Automotive Bushing Technologies Revenue (billion) Forecast, by Application 2020 & 2033
- Table 48: Russia Automotive Bushing Technologies Volume (K) Forecast, by Application 2020 & 2033
- Table 49: Benelux Automotive Bushing Technologies Revenue (billion) Forecast, by Application 2020 & 2033
- Table 50: Benelux Automotive Bushing Technologies Volume (K) Forecast, by Application 2020 & 2033
- Table 51: Nordics Automotive Bushing Technologies Revenue (billion) Forecast, by Application 2020 & 2033
- Table 52: Nordics Automotive Bushing Technologies Volume (K) Forecast, by Application 2020 & 2033
- Table 53: Rest of Europe Automotive Bushing Technologies Revenue (billion) Forecast, by Application 2020 & 2033
- Table 54: Rest of Europe Automotive Bushing Technologies Volume (K) Forecast, by Application 2020 & 2033
- Table 55: Global Automotive Bushing Technologies Revenue billion Forecast, by Application 2020 & 2033
- Table 56: Global Automotive Bushing Technologies Volume K Forecast, by Application 2020 & 2033
- Table 57: Global Automotive Bushing Technologies Revenue billion Forecast, by Types 2020 & 2033
- Table 58: Global Automotive Bushing Technologies Volume K Forecast, by Types 2020 & 2033
- Table 59: Global Automotive Bushing Technologies Revenue billion Forecast, by Country 2020 & 2033
- Table 60: Global Automotive Bushing Technologies Volume K Forecast, by Country 2020 & 2033
- Table 61: Turkey Automotive Bushing Technologies Revenue (billion) Forecast, by Application 2020 & 2033
- Table 62: Turkey Automotive Bushing Technologies Volume (K) Forecast, by Application 2020 & 2033
- Table 63: Israel Automotive Bushing Technologies Revenue (billion) Forecast, by Application 2020 & 2033
- Table 64: Israel Automotive Bushing Technologies Volume (K) Forecast, by Application 2020 & 2033
- Table 65: GCC Automotive Bushing Technologies Revenue (billion) Forecast, by Application 2020 & 2033
- Table 66: GCC Automotive Bushing Technologies Volume (K) Forecast, by Application 2020 & 2033
- Table 67: North Africa Automotive Bushing Technologies Revenue (billion) Forecast, by Application 2020 & 2033
- Table 68: North Africa Automotive Bushing Technologies Volume (K) Forecast, by Application 2020 & 2033
- Table 69: South Africa Automotive Bushing Technologies Revenue (billion) Forecast, by Application 2020 & 2033
- Table 70: South Africa Automotive Bushing Technologies Volume (K) Forecast, by Application 2020 & 2033
- Table 71: Rest of Middle East & Africa Automotive Bushing Technologies Revenue (billion) Forecast, by Application 2020 & 2033
- Table 72: Rest of Middle East & Africa Automotive Bushing Technologies Volume (K) Forecast, by Application 2020 & 2033
- Table 73: Global Automotive Bushing Technologies Revenue billion Forecast, by Application 2020 & 2033
- Table 74: Global Automotive Bushing Technologies Volume K Forecast, by Application 2020 & 2033
- Table 75: Global Automotive Bushing Technologies Revenue billion Forecast, by Types 2020 & 2033
- Table 76: Global Automotive Bushing Technologies Volume K Forecast, by Types 2020 & 2033
- Table 77: Global Automotive Bushing Technologies Revenue billion Forecast, by Country 2020 & 2033
- Table 78: Global Automotive Bushing Technologies Volume K Forecast, by Country 2020 & 2033
- Table 79: China Automotive Bushing Technologies Revenue (billion) Forecast, by Application 2020 & 2033
- Table 80: China Automotive Bushing Technologies Volume (K) Forecast, by Application 2020 & 2033
- Table 81: India Automotive Bushing Technologies Revenue (billion) Forecast, by Application 2020 & 2033
- Table 82: India Automotive Bushing Technologies Volume (K) Forecast, by Application 2020 & 2033
- Table 83: Japan Automotive Bushing Technologies Revenue (billion) Forecast, by Application 2020 & 2033
- Table 84: Japan Automotive Bushing Technologies Volume (K) Forecast, by Application 2020 & 2033
- Table 85: South Korea Automotive Bushing Technologies Revenue (billion) Forecast, by Application 2020 & 2033
- Table 86: South Korea Automotive Bushing Technologies Volume (K) Forecast, by Application 2020 & 2033
- Table 87: ASEAN Automotive Bushing Technologies Revenue (billion) Forecast, by Application 2020 & 2033
- Table 88: ASEAN Automotive Bushing Technologies Volume (K) Forecast, by Application 2020 & 2033
- Table 89: Oceania Automotive Bushing Technologies Revenue (billion) Forecast, by Application 2020 & 2033
- Table 90: Oceania Automotive Bushing Technologies Volume (K) Forecast, by Application 2020 & 2033
- Table 91: Rest of Asia Pacific Automotive Bushing Technologies Revenue (billion) Forecast, by Application 2020 & 2033
- Table 92: Rest of Asia Pacific Automotive Bushing Technologies Volume (K) Forecast, by Application 2020 & 2033
Frequently Asked Questions
1. What is the projected Compound Annual Growth Rate (CAGR) of the Automotive Bushing Technologies?
The projected CAGR is approximately 4.83%.
2. Which companies are prominent players in the Automotive Bushing Technologies?
Key companies in the market include BOGE Rubbers & Plastics, Continental, Cooper-Standard, Tenneco(Federal-Mogul), Hyundai, Nolathane, Paulstra SNC, SumiRiko AVS, Tenneco, Vibracoustic GmbH.
3. What are the main segments of the Automotive Bushing Technologies?
The market segments include Application, Types.
4. Can you provide details about the market size?
The market size is estimated to be USD 172.48 billion as of 2022.
5. What are some drivers contributing to market growth?
N/A
6. What are the notable trends driving market growth?
N/A
7. Are there any restraints impacting market growth?
N/A
8. Can you provide examples of recent developments in the market?
N/A
9. What pricing options are available for accessing the report?
Pricing options include single-user, multi-user, and enterprise licenses priced at USD 3350.00, USD 5025.00, and USD 6700.00 respectively.
10. Is the market size provided in terms of value or volume?
The market size is provided in terms of value, measured in billion and volume, measured in K.
11. Are there any specific market keywords associated with the report?
Yes, the market keyword associated with the report is "Automotive Bushing Technologies," which aids in identifying and referencing the specific market segment covered.
12. How do I determine which pricing option suits my needs best?
The pricing options vary based on user requirements and access needs. Individual users may opt for single-user licenses, while businesses requiring broader access may choose multi-user or enterprise licenses for cost-effective access to the report.
13. Are there any additional resources or data provided in the Automotive Bushing Technologies report?
While the report offers comprehensive insights, it's advisable to review the specific contents or supplementary materials provided to ascertain if additional resources or data are available.
14. How can I stay updated on further developments or reports in the Automotive Bushing Technologies?
To stay informed about further developments, trends, and reports in the Automotive Bushing Technologies, consider subscribing to industry newsletters, following relevant companies and organizations, or regularly checking reputable industry news sources and publications.
Methodology
Step 1 - Identification of Relevant Samples Size from Population Database


Step 2 - Approaches for Defining Global Market Size (Value, Volume* & Price*)

Note*: In applicable scenarios
Step 3 - Data Sources
Primary Research
- Web Analytics
- Survey Reports
- Research Institute
- Latest Research Reports
- Opinion Leaders
Secondary Research
- Annual Reports
- White Paper
- Latest Press Release
- Industry Association
- Paid Database
- Investor Presentations

Step 4 - Data Triangulation
Involves using different sources of information in order to increase the validity of a study
These sources are likely to be stakeholders in a program - participants, other researchers, program staff, other community members, and so on.
Then we put all data in single framework & apply various statistical tools to find out the dynamic on the market.
During the analysis stage, feedback from the stakeholder groups would be compared to determine areas of agreement as well as areas of divergence