

Key Insights
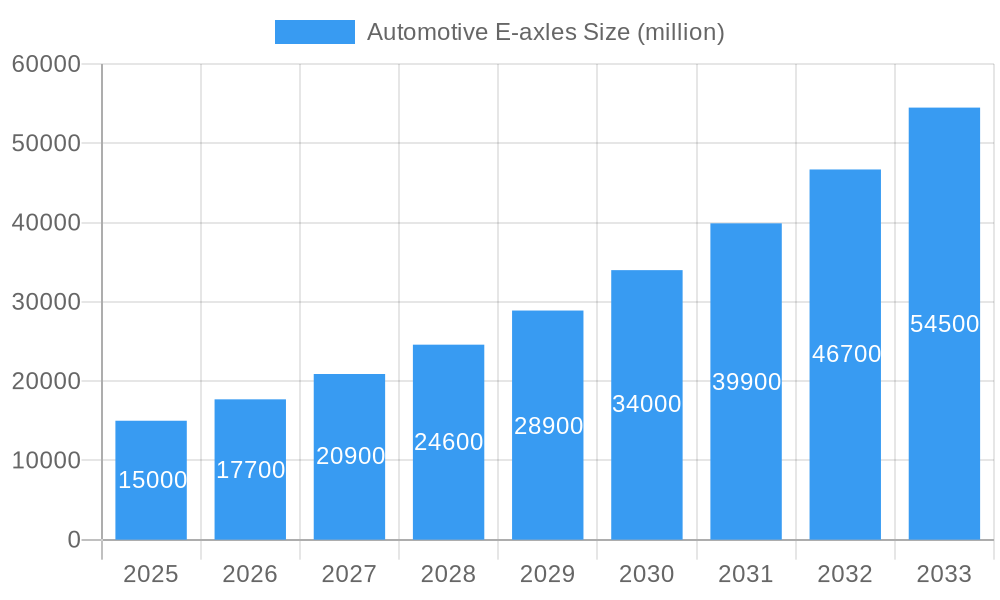
The global automotive e-axle market is experiencing significant expansion, propelled by the escalating adoption of electric vehicles (EVs) and stringent emission standards. With a base year of 2025, the market is valued at $13.05 billion. Projections indicate a Compound Annual Growth Rate (CAGR) of 10.65%, forecasting substantial growth through 2033. This upward trajectory is primarily attributed to the inherent advantages of e-axles, including enhanced energy efficiency that boosts EV range and performance. Moreover, the integrated design of motors, inverters, and gearboxes simplifies vehicle architecture and manufacturing processes, leading to considerable cost efficiencies. Ongoing technological innovations, particularly in high-power density motors and advanced power electronics, are further stimulating market development. Leading industry players are actively pursuing research and development and forging strategic alliances to strengthen their market presence.
Automotive E-axles Market Size (In Billion)
Despite the promising growth, the market navigates certain hurdles. The substantial upfront investment required for e-axle technology can pose a barrier for smaller automotive manufacturers. Additionally, the development of effective thermal management systems for high-performance e-axles is critical for ensuring optimal operation and extended lifespan. Nevertheless, the future outlook for the automotive e-axle market remains exceptionally robust, driven by the accelerating global shift toward electric mobility. The increasing demand for improved vehicle efficiency, performance, and reduced environmental impact will continue to drive e-axle adoption across diverse vehicle segments, cementing its position as a pivotal technology in future automotive design.
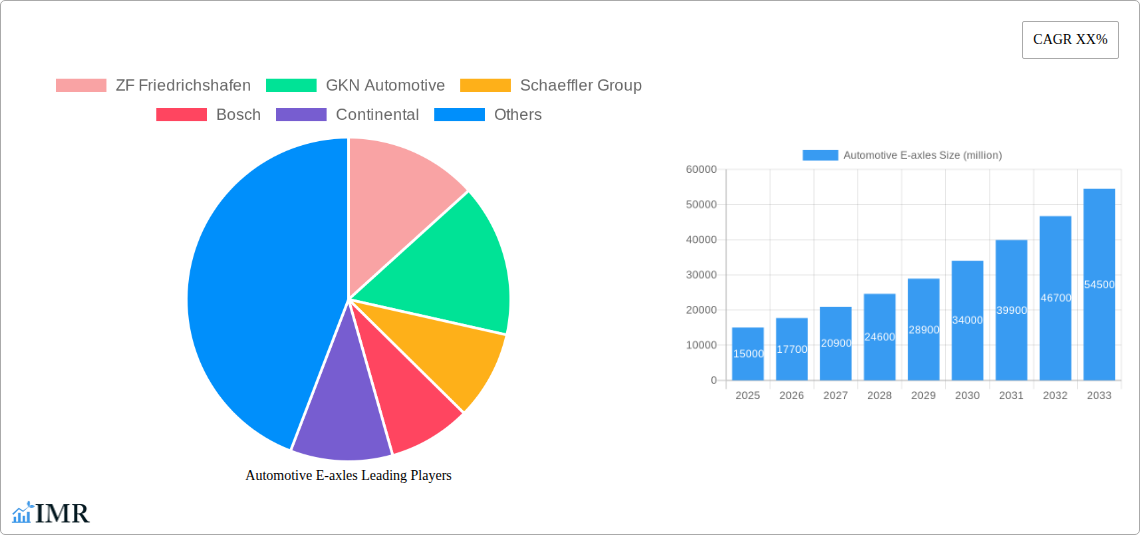
Automotive E-axles Company Market Share
Automotive E-axles Market Report: 2019-2033
This comprehensive report provides an in-depth analysis of the global automotive e-axle market, encompassing market dynamics, growth trends, regional analysis, competitive landscape, and future outlook. The study period covers 2019-2033, with a base year of 2025 and a forecast period of 2025-2033. This report is crucial for industry professionals, investors, and strategists seeking to understand and capitalize on opportunities within this rapidly evolving sector. The report forecasts the global market to reach xx million units by 2033.
Automotive E-axles Market Dynamics & Structure
This section analyzes the competitive landscape, technological advancements, regulatory influences, and market trends impacting the automotive e-axle market. We delve into market concentration, identifying key players and their market share percentages. Furthermore, we explore the impact of mergers and acquisitions (M&A) activity, analyzing deal volumes and their effect on market consolidation.
- Market Concentration: The global automotive e-axle market exhibits a moderately concentrated structure, with key players holding significant market share (ZF Friedrichshafen, GKN Automotive, Schaeffler Group, Bosch hold approximately xx% combined market share in 2025). Smaller players contribute significantly to innovation and niche applications.
- Technological Innovation: Continuous advancements in electric motor technology, power electronics, and software integration are driving efficiency and performance gains in e-axles. Innovation in areas like silicon carbide (SiC) power semiconductors and high-density permanent magnets is crucial.
- Regulatory Framework: Stringent emission regulations globally are pushing automakers toward electrification, boosting the demand for e-axles. Government incentives and subsidies further accelerate market growth.
- Competitive Product Substitutes: While e-axles dominate the electric vehicle (EV) powertrain market, there is some competition from alternative solutions, though limited in scale.
- End-User Demographics: The growing demand for EVs across various vehicle segments, from passenger cars to commercial vehicles, drives the adoption of e-axles. The expanding EV infrastructure further fuels this demand.
- M&A Trends: The past five years have seen xx M&A deals in the automotive e-axle space (2019-2024), indicating a trend of consolidation and technological acquisition within the sector. These deals highlight strategic moves to secure technology and broaden market reach. Innovation barriers include high R&D costs and the need for specialized manufacturing capabilities.
Automotive E-axles Growth Trends & Insights
This section analyzes market size evolution, adoption rates, technological disruptions, and shifts in consumer behavior influencing the automotive e-axle market. We examine historical data (2019-2024), base year (2025) estimations and forecast future trends (2025-2033). Utilizing comprehensive market research data, we project significant growth. The compound annual growth rate (CAGR) is estimated at xx% during the forecast period, driven primarily by the increasing adoption of electric vehicles globally.
The increasing demand for EVs is the primary driver of e-axle market growth. Technological advancements, such as the development of high-efficiency electric motors and power electronics, are further enhancing market growth. Consumer preferences are shifting towards electric vehicles due to environmental concerns and government regulations. The expansion of charging infrastructure and improving battery technology are also contributing factors. Market penetration is projected to reach xx% by 2033.
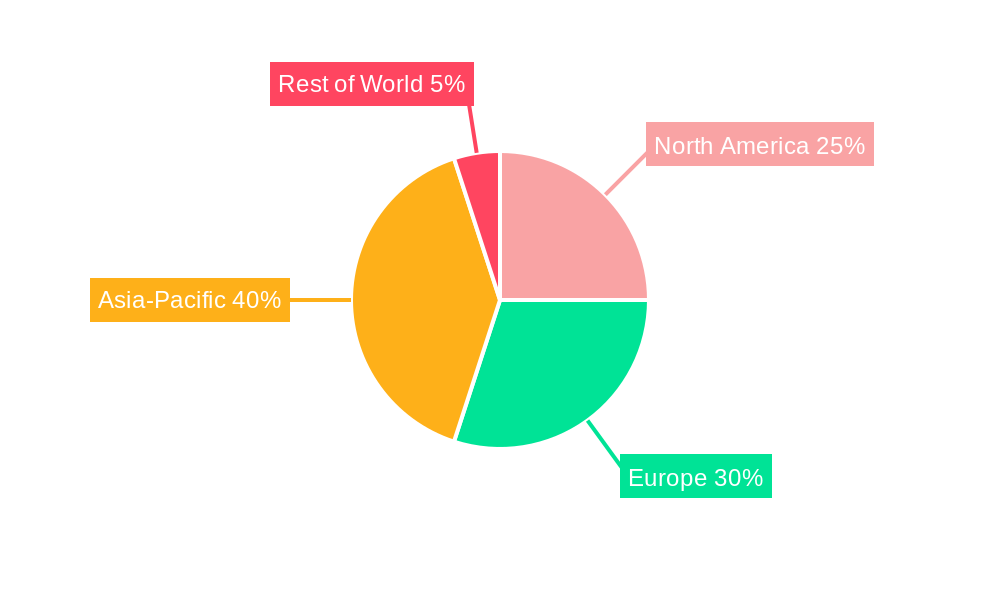
Dominant Regions, Countries, or Segments in Automotive E-axles
This section identifies the leading regions, countries, or segments driving market growth. We explore specific factors contributing to their dominance, including economic policies, infrastructure development, and consumer preferences.
- Leading Regions: The xx region is currently dominating the market, followed by xx and xx, primarily driven by high EV adoption rates and supportive government policies. These regions also benefit from well-established automotive manufacturing ecosystems.
- Key Drivers: Stringent emission regulations in the EU and China are leading to rapid adoption of EVs, boosting e-axle demand. Government incentives such as subsidies and tax breaks are further accelerating market growth. Rapid growth in EV production and sales are fueling market expansion in these regions. Well-developed automotive supply chains further support e-axle production.
Automotive E-axles Product Landscape
E-axles encompass a range of configurations and designs, optimized for various vehicle types and performance requirements. Innovations focus on maximizing efficiency, power density, and integration with other vehicle systems. Key improvements include higher torque density motors, advanced power electronics incorporating SiC, and sophisticated control algorithms for optimal energy management. These advancements translate to improved vehicle range, performance, and reduced emissions.
Key Drivers, Barriers & Challenges in Automotive E-axles
Key Drivers: The primary drivers include the global push towards electrification, stringent emission regulations, and rising demand for EVs. Government incentives and technological advancements in motor and power electronics technologies are also key factors.
Key Challenges: High initial investment costs for e-axle production and integration are significant barriers. The complexity of e-axle technology and the need for specialized manufacturing capabilities present challenges. Supply chain disruptions, specifically for rare earth materials used in electric motors, pose risks to market growth. The competitive landscape, with numerous players vying for market share, presents ongoing challenges.
Emerging Opportunities in Automotive E-axles
Emerging opportunities lie in the expansion into untapped markets, particularly in developing economies. The development of more affordable and efficient e-axle solutions will open up new market segments. Furthermore, advancements in battery technology are expected to further increase the adoption of EVs, leading to increased demand for e-axles.
Growth Accelerators in the Automotive E-axles Industry
Technological breakthroughs, such as the development of highly efficient electric motors, advanced power electronics and innovative cooling systems, are driving long-term growth. Strategic partnerships between automotive manufacturers and e-axle suppliers are accelerating innovation and market penetration. Expansion into new geographic markets, especially developing economies, presents significant growth opportunities.
Key Players Shaping the Automotive E-axles Market
- ZF Friedrichshafen
- GKN Automotive
- Schaeffler Group
- Bosch
- Continental
- Dana Incorporated
- Siemens
- Nidec Corporation
- Magna International
- Valeo
- Mahle Group
- BorgWarner
- Punch Powertrain
- AVID Technology
- NTN-SNR
- AVL
- Elaphe Propulsion Technologies
- Bühler Motor
- Brusa Elektronik
- Rimac Automobili
- AKKA Technologies
- YASA
- e-Traction
- Inmotion Technologies
- EFA France
- Magtec
- Echogen Power Systems
- Protean Electric
- Emoss Mobile Systems
- Equipmake
- E-Traction Europe
- EDrive Systems
- NORMA Group
- Siemens eMobility
- TQ Group
- REO-USA
- E-T-A Elektrotechnische Apparate
- Flanders Make
- Frazer-Nash Energy Systems
- ElringKlinger
- BENTELER Automotive
- Horiba MIRA
- IAV Automotive Engineering
- Ricardo
- FEV Europe
- FEDIT
Notable Milestones in Automotive E-axles Sector
- 2020: Launch of xx e-axle by xx, marking a significant advancement in power density.
- 2022: Acquisition of xx by xx, enhancing vertical integration within the supply chain.
- 2023: Introduction of xx e-axle platform by xx focusing on cost reduction and scalability.
In-Depth Automotive E-axles Market Outlook
The automotive e-axle market is poised for sustained growth, driven by the ongoing shift toward electric mobility. Future market potential is significant, with opportunities for innovation in areas such as higher power density, improved efficiency, and enhanced integration with vehicle control systems. Strategic partnerships and investments in R&D will play crucial roles in shaping the future of this dynamic market. The focus on sustainable and cost-effective solutions will be crucial for long-term success.
Automotive E-axles Segmentation
- 1. Application
- 2. Types
Automotive E-axles Segmentation By Geography
-
1. Europe
- 1.1. United Kingdom
- 1.2. Germany
- 1.3. France
- 1.4. Italy
- 1.5. Spain
- 1.6. Netherlands
- 1.7. Belgium
- 1.8. Sweden
- 1.9. Norway
- 1.10. Poland
- 1.11. Denmark
Automotive E-axles Regional Market Share
Geographic Coverage of Automotive E-axles
Automotive E-axles REPORT HIGHLIGHTS
| Aspects | Details |
|---|---|
| Study Period | 2020-2034 |
| Base Year | 2025 |
| Estimated Year | 2026 |
| Forecast Period | 2026-2034 |
| Historical Period | 2020-2025 |
| Growth Rate | CAGR of 10.65% from 2020-2034 |
| Segmentation |
|
Table of Contents
- 1. Introduction
- 1.1. Research Scope
- 1.2. Market Segmentation
- 1.3. Research Objective
- 1.4. Definitions and Assumptions
- 2. Executive Summary
- 2.1. Market Snapshot
- 3. Market Dynamics
- 3.1. Market Drivers
- 3.2. Market Restrains
- 3.3. Market Trends
- 3.4. Market Opportunities
- 4. Market Factor Analysis
- 4.1. Porters Five Forces
- 4.1.1. Bargaining Power of Suppliers
- 4.1.2. Bargaining Power of Buyers
- 4.1.3. Threat of New Entrants
- 4.1.4. Threat of Substitutes
- 4.1.5. Competitive Rivalry
- 4.2. PESTEL analysis
- 4.3. BCG Analysis
- 4.3.1. Stars (High Growth, High Market Share)
- 4.3.2. Cash Cows (Low Growth, High Market Share)
- 4.3.3. Question Mark (High Growth, Low Market Share)
- 4.3.4. Dogs (Low Growth, Low Market Share)
- 4.4. Ansoff Matrix Analysis
- 4.5. Supply Chain Analysis
- 4.6. Regulatory Landscape
- 4.7. Current Market Potential and Opportunity Assessment (TAM–SAM–SOM Framework)
- 4.8. IMR Analyst Note
- 4.1. Porters Five Forces
- 5. Market Analysis, Insights and Forecast 2021-2033
- 5.1. Market Analysis, Insights and Forecast - by Application
- 5.2. Market Analysis, Insights and Forecast - by Types
- 5.3. Market Analysis, Insights and Forecast - by Region
- 5.3.1. Europe
- 6. Automotive E-axles Analysis, Insights and Forecast, 2021-2033
- 6.1. Market Analysis, Insights and Forecast - by Application
- 6.2. Market Analysis, Insights and Forecast - by Types
- 7. Competitive Analysis
- 7.1. Company Profiles
- 7.1.1 ZF Friedrichshafen
- 7.1.1.1. Company Overview
- 7.1.1.2. Products
- 7.1.1.3. Company Financials
- 7.1.1.4. SWOT Analysis
- 7.1.2 GKN Automotive
- 7.1.2.1. Company Overview
- 7.1.2.2. Products
- 7.1.2.3. Company Financials
- 7.1.2.4. SWOT Analysis
- 7.1.3 Schaeffler Group
- 7.1.3.1. Company Overview
- 7.1.3.2. Products
- 7.1.3.3. Company Financials
- 7.1.3.4. SWOT Analysis
- 7.1.4 Bosch
- 7.1.4.1. Company Overview
- 7.1.4.2. Products
- 7.1.4.3. Company Financials
- 7.1.4.4. SWOT Analysis
- 7.1.5 Continental
- 7.1.5.1. Company Overview
- 7.1.5.2. Products
- 7.1.5.3. Company Financials
- 7.1.5.4. SWOT Analysis
- 7.1.6 Dana Incorporated
- 7.1.6.1. Company Overview
- 7.1.6.2. Products
- 7.1.6.3. Company Financials
- 7.1.6.4. SWOT Analysis
- 7.1.7 Siemens
- 7.1.7.1. Company Overview
- 7.1.7.2. Products
- 7.1.7.3. Company Financials
- 7.1.7.4. SWOT Analysis
- 7.1.8 Nidec Corporation
- 7.1.8.1. Company Overview
- 7.1.8.2. Products
- 7.1.8.3. Company Financials
- 7.1.8.4. SWOT Analysis
- 7.1.9 Magna International
- 7.1.9.1. Company Overview
- 7.1.9.2. Products
- 7.1.9.3. Company Financials
- 7.1.9.4. SWOT Analysis
- 7.1.10 Valeo
- 7.1.10.1. Company Overview
- 7.1.10.2. Products
- 7.1.10.3. Company Financials
- 7.1.10.4. SWOT Analysis
- 7.1.11 Mahle Group
- 7.1.11.1. Company Overview
- 7.1.11.2. Products
- 7.1.11.3. Company Financials
- 7.1.11.4. SWOT Analysis
- 7.1.12 BorgWarner
- 7.1.12.1. Company Overview
- 7.1.12.2. Products
- 7.1.12.3. Company Financials
- 7.1.12.4. SWOT Analysis
- 7.1.13 Punch Powertrain
- 7.1.13.1. Company Overview
- 7.1.13.2. Products
- 7.1.13.3. Company Financials
- 7.1.13.4. SWOT Analysis
- 7.1.14 AVID Technology
- 7.1.14.1. Company Overview
- 7.1.14.2. Products
- 7.1.14.3. Company Financials
- 7.1.14.4. SWOT Analysis
- 7.1.15 NTN-SNR
- 7.1.15.1. Company Overview
- 7.1.15.2. Products
- 7.1.15.3. Company Financials
- 7.1.15.4. SWOT Analysis
- 7.1.16 AVL
- 7.1.16.1. Company Overview
- 7.1.16.2. Products
- 7.1.16.3. Company Financials
- 7.1.16.4. SWOT Analysis
- 7.1.17 Elaphe Propulsion Technologies
- 7.1.17.1. Company Overview
- 7.1.17.2. Products
- 7.1.17.3. Company Financials
- 7.1.17.4. SWOT Analysis
- 7.1.18 Bühler Motor
- 7.1.18.1. Company Overview
- 7.1.18.2. Products
- 7.1.18.3. Company Financials
- 7.1.18.4. SWOT Analysis
- 7.1.19 Brusa Elektronik
- 7.1.19.1. Company Overview
- 7.1.19.2. Products
- 7.1.19.3. Company Financials
- 7.1.19.4. SWOT Analysis
- 7.1.20 Rimac Automobili
- 7.1.20.1. Company Overview
- 7.1.20.2. Products
- 7.1.20.3. Company Financials
- 7.1.20.4. SWOT Analysis
- 7.1.21 AKKA Technologies
- 7.1.21.1. Company Overview
- 7.1.21.2. Products
- 7.1.21.3. Company Financials
- 7.1.21.4. SWOT Analysis
- 7.1.22 YASA
- 7.1.22.1. Company Overview
- 7.1.22.2. Products
- 7.1.22.3. Company Financials
- 7.1.22.4. SWOT Analysis
- 7.1.23 e-Traction
- 7.1.23.1. Company Overview
- 7.1.23.2. Products
- 7.1.23.3. Company Financials
- 7.1.23.4. SWOT Analysis
- 7.1.24 Inmotion Technologies
- 7.1.24.1. Company Overview
- 7.1.24.2. Products
- 7.1.24.3. Company Financials
- 7.1.24.4. SWOT Analysis
- 7.1.25 EFA France
- 7.1.25.1. Company Overview
- 7.1.25.2. Products
- 7.1.25.3. Company Financials
- 7.1.25.4. SWOT Analysis
- 7.1.26 Magtec
- 7.1.26.1. Company Overview
- 7.1.26.2. Products
- 7.1.26.3. Company Financials
- 7.1.26.4. SWOT Analysis
- 7.1.27 Echogen Power Systems
- 7.1.27.1. Company Overview
- 7.1.27.2. Products
- 7.1.27.3. Company Financials
- 7.1.27.4. SWOT Analysis
- 7.1.28 Protean Electric
- 7.1.28.1. Company Overview
- 7.1.28.2. Products
- 7.1.28.3. Company Financials
- 7.1.28.4. SWOT Analysis
- 7.1.29 Emoss Mobile Systems
- 7.1.29.1. Company Overview
- 7.1.29.2. Products
- 7.1.29.3. Company Financials
- 7.1.29.4. SWOT Analysis
- 7.1.30 Equipmake
- 7.1.30.1. Company Overview
- 7.1.30.2. Products
- 7.1.30.3. Company Financials
- 7.1.30.4. SWOT Analysis
- 7.1.31 E-Traction Europe
- 7.1.31.1. Company Overview
- 7.1.31.2. Products
- 7.1.31.3. Company Financials
- 7.1.31.4. SWOT Analysis
- 7.1.32 EDrive Systems
- 7.1.32.1. Company Overview
- 7.1.32.2. Products
- 7.1.32.3. Company Financials
- 7.1.32.4. SWOT Analysis
- 7.1.33 NORMA Group
- 7.1.33.1. Company Overview
- 7.1.33.2. Products
- 7.1.33.3. Company Financials
- 7.1.33.4. SWOT Analysis
- 7.1.34 Siemens eMobility
- 7.1.34.1. Company Overview
- 7.1.34.2. Products
- 7.1.34.3. Company Financials
- 7.1.34.4. SWOT Analysis
- 7.1.35 TQ Group
- 7.1.35.1. Company Overview
- 7.1.35.2. Products
- 7.1.35.3. Company Financials
- 7.1.35.4. SWOT Analysis
- 7.1.36 REO-USA
- 7.1.36.1. Company Overview
- 7.1.36.2. Products
- 7.1.36.3. Company Financials
- 7.1.36.4. SWOT Analysis
- 7.1.37 E-T-A Elektrotechnische Apparate
- 7.1.37.1. Company Overview
- 7.1.37.2. Products
- 7.1.37.3. Company Financials
- 7.1.37.4. SWOT Analysis
- 7.1.38 Flanders Make
- 7.1.38.1. Company Overview
- 7.1.38.2. Products
- 7.1.38.3. Company Financials
- 7.1.38.4. SWOT Analysis
- 7.1.39 Frazer-Nash Energy Systems
- 7.1.39.1. Company Overview
- 7.1.39.2. Products
- 7.1.39.3. Company Financials
- 7.1.39.4. SWOT Analysis
- 7.1.40 ElringKlinger
- 7.1.40.1. Company Overview
- 7.1.40.2. Products
- 7.1.40.3. Company Financials
- 7.1.40.4. SWOT Analysis
- 7.1.41 BENTELER Automotive
- 7.1.41.1. Company Overview
- 7.1.41.2. Products
- 7.1.41.3. Company Financials
- 7.1.41.4. SWOT Analysis
- 7.1.42 Horiba MIRA
- 7.1.42.1. Company Overview
- 7.1.42.2. Products
- 7.1.42.3. Company Financials
- 7.1.42.4. SWOT Analysis
- 7.1.43 IAV Automotive Engineering
- 7.1.43.1. Company Overview
- 7.1.43.2. Products
- 7.1.43.3. Company Financials
- 7.1.43.4. SWOT Analysis
- 7.1.44 Ricardo
- 7.1.44.1. Company Overview
- 7.1.44.2. Products
- 7.1.44.3. Company Financials
- 7.1.44.4. SWOT Analysis
- 7.1.45 FEV Europe
- 7.1.45.1. Company Overview
- 7.1.45.2. Products
- 7.1.45.3. Company Financials
- 7.1.45.4. SWOT Analysis
- 7.1.46 FEDIT
- 7.1.46.1. Company Overview
- 7.1.46.2. Products
- 7.1.46.3. Company Financials
- 7.1.46.4. SWOT Analysis
- 7.1.1 ZF Friedrichshafen
- 7.2. Market Entropy
- 7.2.1 Company's Key Areas Served
- 7.2.2 Recent Developments
- 7.3. Company Market Share Analysis 2025
- 7.3.1 Top 5 Companies Market Share Analysis
- 7.3.2 Top 3 Companies Market Share Analysis
- 7.4. List of Potential Customers
- 8. Research Methodology
List of Figures
- Figure 1: Automotive E-axles Revenue Breakdown (billion, %) by Product 2025 & 2033
- Figure 2: Automotive E-axles Share (%) by Company 2025
List of Tables
- Table 1: Automotive E-axles Revenue billion Forecast, by Application 2020 & 2033
- Table 2: Automotive E-axles Revenue billion Forecast, by Types 2020 & 2033
- Table 3: Automotive E-axles Revenue billion Forecast, by Region 2020 & 2033
- Table 4: Automotive E-axles Revenue billion Forecast, by Application 2020 & 2033
- Table 5: Automotive E-axles Revenue billion Forecast, by Types 2020 & 2033
- Table 6: Automotive E-axles Revenue billion Forecast, by Country 2020 & 2033
- Table 7: United Kingdom Automotive E-axles Revenue (billion) Forecast, by Application 2020 & 2033
- Table 8: Germany Automotive E-axles Revenue (billion) Forecast, by Application 2020 & 2033
- Table 9: France Automotive E-axles Revenue (billion) Forecast, by Application 2020 & 2033
- Table 10: Italy Automotive E-axles Revenue (billion) Forecast, by Application 2020 & 2033
- Table 11: Spain Automotive E-axles Revenue (billion) Forecast, by Application 2020 & 2033
- Table 12: Netherlands Automotive E-axles Revenue (billion) Forecast, by Application 2020 & 2033
- Table 13: Belgium Automotive E-axles Revenue (billion) Forecast, by Application 2020 & 2033
- Table 14: Sweden Automotive E-axles Revenue (billion) Forecast, by Application 2020 & 2033
- Table 15: Norway Automotive E-axles Revenue (billion) Forecast, by Application 2020 & 2033
- Table 16: Poland Automotive E-axles Revenue (billion) Forecast, by Application 2020 & 2033
- Table 17: Denmark Automotive E-axles Revenue (billion) Forecast, by Application 2020 & 2033
Frequently Asked Questions
1. What is the projected Compound Annual Growth Rate (CAGR) of the Automotive E-axles?
The projected CAGR is approximately 10.65%.
2. Which companies are prominent players in the Automotive E-axles?
Key companies in the market include ZF Friedrichshafen, GKN Automotive, Schaeffler Group, Bosch, Continental, Dana Incorporated, Siemens, Nidec Corporation, Magna International, Valeo, Mahle Group, BorgWarner, Punch Powertrain, AVID Technology, NTN-SNR, AVL, Elaphe Propulsion Technologies, Bühler Motor, Brusa Elektronik, Rimac Automobili, AKKA Technologies, YASA, e-Traction, Inmotion Technologies, EFA France, Magtec, Echogen Power Systems, Protean Electric, Emoss Mobile Systems, Equipmake, E-Traction Europe, EDrive Systems, NORMA Group, Siemens eMobility, TQ Group, REO-USA, E-T-A Elektrotechnische Apparate, Flanders Make, Frazer-Nash Energy Systems, ElringKlinger, BENTELER Automotive, Horiba MIRA, IAV Automotive Engineering, Ricardo, FEV Europe, FEDIT.
3. What are the main segments of the Automotive E-axles?
The market segments include Application, Types.
4. Can you provide details about the market size?
The market size is estimated to be USD 13.05 billion as of 2022.
5. What are some drivers contributing to market growth?
N/A
6. What are the notable trends driving market growth?
N/A
7. Are there any restraints impacting market growth?
N/A
8. Can you provide examples of recent developments in the market?
N/A
9. What pricing options are available for accessing the report?
Pricing options include single-user, multi-user, and enterprise licenses priced at USD 3900.00, USD 5850.00, and USD 7800.00 respectively.
10. Is the market size provided in terms of value or volume?
The market size is provided in terms of value, measured in billion.
11. Are there any specific market keywords associated with the report?
Yes, the market keyword associated with the report is "Automotive E-axles," which aids in identifying and referencing the specific market segment covered.
12. How do I determine which pricing option suits my needs best?
The pricing options vary based on user requirements and access needs. Individual users may opt for single-user licenses, while businesses requiring broader access may choose multi-user or enterprise licenses for cost-effective access to the report.
13. Are there any additional resources or data provided in the Automotive E-axles report?
While the report offers comprehensive insights, it's advisable to review the specific contents or supplementary materials provided to ascertain if additional resources or data are available.
14. How can I stay updated on further developments or reports in the Automotive E-axles?
To stay informed about further developments, trends, and reports in the Automotive E-axles, consider subscribing to industry newsletters, following relevant companies and organizations, or regularly checking reputable industry news sources and publications.
Methodology
Step 1 - Identification of Relevant Samples Size from Population Database


Step 2 - Approaches for Defining Global Market Size (Value, Volume* & Price*)

Note*: In applicable scenarios
Step 3 - Data Sources
Primary Research
- Web Analytics
- Survey Reports
- Research Institute
- Latest Research Reports
- Opinion Leaders
Secondary Research
- Annual Reports
- White Paper
- Latest Press Release
- Industry Association
- Paid Database
- Investor Presentations

Step 4 - Data Triangulation
Involves using different sources of information in order to increase the validity of a study
These sources are likely to be stakeholders in a program - participants, other researchers, program staff, other community members, and so on.
Then we put all data in single framework & apply various statistical tools to find out the dynamic on the market.
During the analysis stage, feedback from the stakeholder groups would be compared to determine areas of agreement as well as areas of divergence