

Key Insights
The automotive flywheel market is experiencing robust growth, driven by the increasing demand for fuel-efficient vehicles and the adoption of hybrid and electric powertrains. The market's expansion is fueled by stringent government regulations aimed at reducing carbon emissions, prompting automakers to integrate advanced technologies like regenerative braking systems that rely heavily on efficient flywheels. Furthermore, the rising popularity of start-stop systems in vehicles further bolsters the demand for durable and high-performance flywheels. Key players like Schaeffler, ZF, and Valeo are at the forefront of innovation, continuously developing lighter, stronger, and more efficient flywheel designs using advanced materials and manufacturing processes. The market is segmented by type (dual-mass flywheels, single-mass flywheels, etc.), vehicle type (passenger cars, commercial vehicles), and geographic region. While the market faces challenges such as fluctuating raw material prices and the complexities of integrating advanced flywheel technologies into existing vehicle architectures, the long-term outlook remains positive, projecting sustained growth over the forecast period.
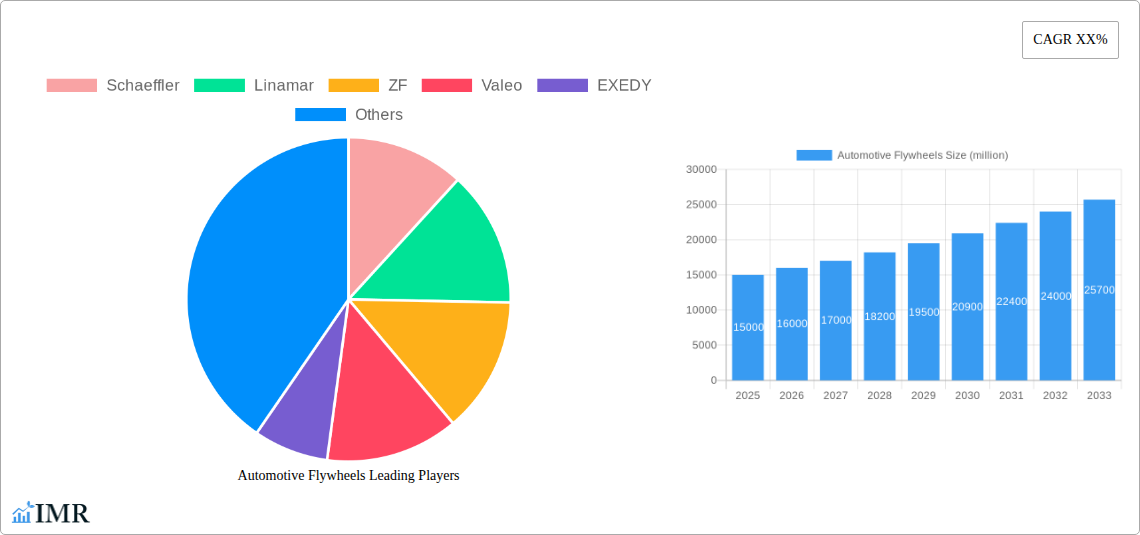
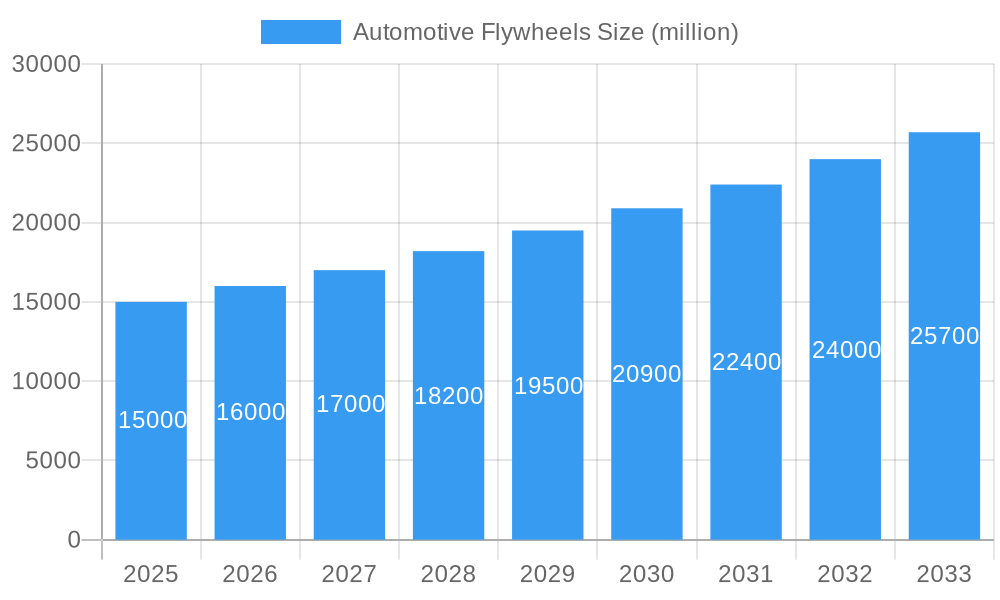
Automotive Flywheels Market Size (In Billion)
The competitive landscape is marked by both established players and emerging companies vying for market share. While companies like Schaeffler and ZF hold significant positions due to their established expertise and global reach, smaller players are making inroads through specialization and cost-effective manufacturing. The market's geographical distribution is likely spread across major automotive manufacturing hubs, with North America, Europe, and Asia-Pacific representing significant regions. The future of the automotive flywheel market hinges on ongoing advancements in materials science, further miniaturization, enhanced integration with hybrid and electric vehicle systems, and potentially the incorporation of energy storage capabilities beyond simple inertia. This evolution promises to deliver even greater fuel efficiency, improved performance, and reduced emissions, ensuring continued growth in the coming years.
Automotive Flywheels Company Market Share
Automotive Flywheels Market Report: 2019-2033
This comprehensive report provides an in-depth analysis of the global automotive flywheels market, encompassing market dynamics, growth trends, regional performance, product landscape, and key player strategies. With a study period spanning 2019-2033, a base year of 2025, and a forecast period of 2025-2033, this report offers invaluable insights for industry professionals, investors, and strategic decision-makers. The report analyzes the parent market of automotive components and the child market of flywheel energy storage systems, providing a holistic view of the market landscape.
Automotive Flywheels Market Dynamics & Structure
The automotive flywheel market is characterized by moderate concentration, with key players like Schaeffler, Linamar, ZF, and Valeo holding significant market share. Technological innovation, particularly in materials science and energy storage, is a key driver, while stringent emission regulations are shaping product development. The market witnesses continuous mergers and acquisitions (M&A) activity, with an estimated xx million USD in deal volume between 2019 and 2024. Competitive substitutes include alternative energy storage solutions like batteries and supercapacitors. End-user demographics are shifting towards electric and hybrid vehicles, fueling demand for high-performance flywheels.
- Market Concentration: Moderately concentrated, with top 5 players holding approximately xx% market share in 2024.
- Technological Innovation: Focus on advanced materials (e.g., carbon fiber composites) and improved energy density.
- Regulatory Framework: Stringent emission norms drive adoption of energy-efficient technologies.
- Competitive Substitutes: Batteries, supercapacitors pose challenges to market growth.
- M&A Activity: xx million USD in deal volume (2019-2024), indicating consolidation trends.
- Innovation Barriers: High R&D costs and material sourcing challenges hinder innovation.
Automotive Flywheels Growth Trends & Insights
The global automotive flywheels market experienced a CAGR of xx% during the historical period (2019-2024), reaching a market size of xx million units in 2024. The adoption rate is projected to accelerate during the forecast period (2025-2033), driven by the increasing demand for hybrid and electric vehicles (HEVs and EVs). Technological advancements, such as the integration of advanced materials and improved energy storage capabilities, are fueling market growth. Consumer preferences are shifting towards fuel-efficient and environmentally friendly vehicles, further boosting demand. The market is anticipated to reach xx million units by 2033, with a projected CAGR of xx% during the forecast period.
Dominant Regions, Countries, or Segments in Automotive Flywheels
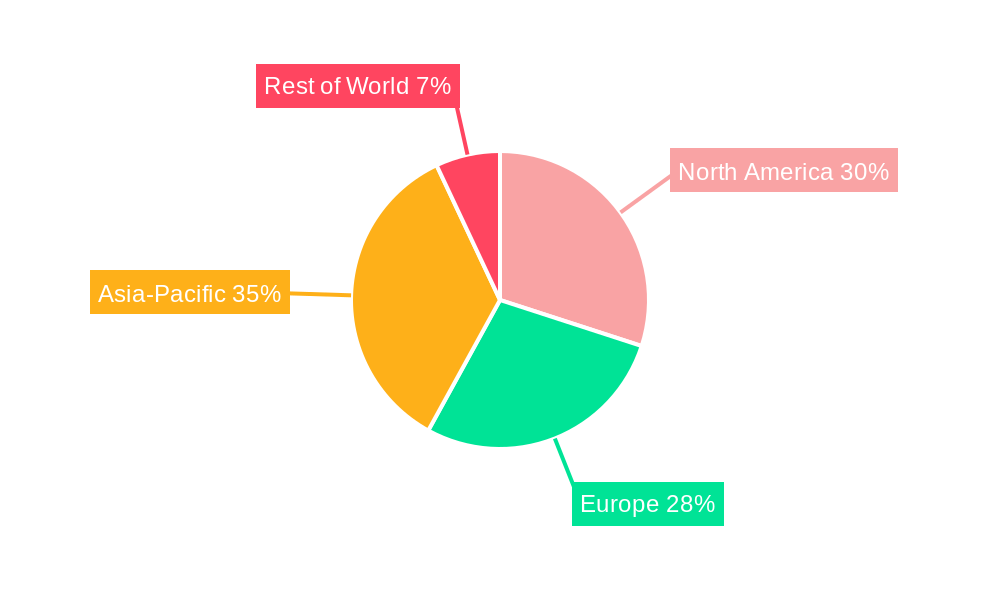
The Asia-Pacific region is projected to dominate the automotive flywheels market throughout the forecast period, driven by robust automotive production and increasing adoption of HEVs and EVs in countries like China, Japan, and South Korea. Stringent emission regulations and supportive government policies in these regions are further accelerating market growth. Europe and North America also contribute significantly, albeit with slower growth rates compared to Asia-Pacific.
- Key Drivers in Asia-Pacific: High automotive production, increasing HEV/EV adoption, supportive government policies.
- Market Share: Asia-Pacific holds an estimated xx% market share in 2024.
- Growth Potential: High growth potential driven by infrastructure development and economic growth.
- Other Regions: Europe and North America exhibit steady growth, driven by stricter emission standards.
Automotive Flywheels Product Landscape
Automotive flywheels are evolving from basic energy storage devices to sophisticated systems integrating advanced materials and control technologies. Key features include improved energy density, higher rotational speeds, and enhanced durability. Applications range from HEVs and EVs to start-stop systems and regenerative braking systems. These advancements offer unique selling propositions such as increased fuel efficiency, reduced emissions, and improved vehicle performance.
Key Drivers, Barriers & Challenges in Automotive Flywheels
Key Drivers:
- The rising demand for fuel-efficient and eco-friendly vehicles is the primary driver.
- Stringent emission regulations globally are pushing the adoption of energy-efficient technologies like flywheels.
- Technological advancements in materials science and energy storage are enhancing flywheel performance.
Key Challenges:
- High manufacturing costs and material prices restrict widespread adoption.
- Competition from alternative energy storage solutions (batteries, supercapacitors) presents a significant challenge.
- Supply chain disruptions and geopolitical uncertainties can impact the availability of raw materials.
Emerging Opportunities in Automotive Flywheels
Emerging opportunities include:
- Expansion into new applications, such as grid-scale energy storage and industrial applications.
- Development of hybrid flywheel systems combining the benefits of flywheels and batteries.
- Integration of advanced control systems and energy management strategies to optimize flywheel performance.
Growth Accelerators in the Automotive Flywheels Industry
Technological breakthroughs in materials science and energy storage will accelerate market growth. Strategic partnerships between automotive manufacturers and flywheel technology providers are crucial. Market expansion strategies focusing on emerging economies will drive further growth.
Key Players Shaping the Automotive Flywheels Market
- Schaeffler
- Linamar
- ZF
- Valeo
- EXEDY
- Mancor
- Metaldyne
- Skyway Precision and Waupaca Foundry
- Iljin
- ATTC
- Waupaca
- Pace
- Tupy
Notable Milestones in Automotive Flywheels Sector
- 2021: Schaeffler launches a new high-performance flywheel system for electric vehicles.
- 2022: ZF and Valeo announce a joint venture to develop advanced flywheel technology for hybrid vehicles.
- 2023: Linamar acquires a key supplier of flywheel components, expanding its market presence.
- 2024: Significant investment in R&D of next-generation flywheel materials is reported by multiple players.
In-Depth Automotive Flywheels Market Outlook
The automotive flywheels market is poised for significant growth, driven by the sustained demand for HEVs and EVs, stricter emission norms, and continuous technological advancements. Strategic partnerships and investments in R&D will further accelerate market expansion. The market presents significant opportunities for players offering innovative and cost-effective flywheel solutions. The future potential is substantial, particularly in emerging markets with growing automotive industries.
Automotive Flywheels Segmentation
-
1. Application
- 1.1. Passenger Cars
- 1.2. Commercial Vehicles
-
2. Types
- 2.1. Single Freewheel
- 2.2. Multilevel Flywheel
Automotive Flywheels Segmentation By Geography
-
1. North America
- 1.1. United States
- 1.2. Canada
- 1.3. Mexico
-
2. South America
- 2.1. Brazil
- 2.2. Argentina
- 2.3. Rest of South America
-
3. Europe
- 3.1. United Kingdom
- 3.2. Germany
- 3.3. France
- 3.4. Italy
- 3.5. Spain
- 3.6. Russia
- 3.7. Benelux
- 3.8. Nordics
- 3.9. Rest of Europe
-
4. Middle East & Africa
- 4.1. Turkey
- 4.2. Israel
- 4.3. GCC
- 4.4. North Africa
- 4.5. South Africa
- 4.6. Rest of Middle East & Africa
-
5. Asia Pacific
- 5.1. China
- 5.2. India
- 5.3. Japan
- 5.4. South Korea
- 5.5. ASEAN
- 5.6. Oceania
- 5.7. Rest of Asia Pacific
Automotive Flywheels Regional Market Share
Geographic Coverage of Automotive Flywheels
Automotive Flywheels REPORT HIGHLIGHTS
| Aspects | Details |
|---|---|
| Study Period | 2020-2034 |
| Base Year | 2025 |
| Estimated Year | 2026 |
| Forecast Period | 2026-2034 |
| Historical Period | 2020-2025 |
| Growth Rate | CAGR of XX% from 2020-2034 |
| Segmentation |
|
Table of Contents
- 1. Introduction
- 1.1. Research Scope
- 1.2. Market Segmentation
- 1.3. Research Objective
- 1.4. Definitions and Assumptions
- 2. Executive Summary
- 2.1. Market Snapshot
- 3. Market Dynamics
- 3.1. Market Drivers
- 3.2. Market Restrains
- 3.3. Market Trends
- 3.4. Market Opportunities
- 4. Market Factor Analysis
- 4.1. Porters Five Forces
- 4.1.1. Bargaining Power of Suppliers
- 4.1.2. Bargaining Power of Buyers
- 4.1.3. Threat of New Entrants
- 4.1.4. Threat of Substitutes
- 4.1.5. Competitive Rivalry
- 4.2. PESTEL analysis
- 4.3. BCG Analysis
- 4.3.1. Stars (High Growth, High Market Share)
- 4.3.2. Cash Cows (Low Growth, High Market Share)
- 4.3.3. Question Mark (High Growth, Low Market Share)
- 4.3.4. Dogs (Low Growth, Low Market Share)
- 4.4. Ansoff Matrix Analysis
- 4.5. Supply Chain Analysis
- 4.6. Regulatory Landscape
- 4.7. Current Market Potential and Opportunity Assessment (TAM–SAM–SOM Framework)
- 4.8. IMR Analyst Note
- 4.1. Porters Five Forces
- 5. Market Analysis, Insights and Forecast 2021-2033
- 5.1. Market Analysis, Insights and Forecast - by Application
- 5.1.1. Passenger Cars
- 5.1.2. Commercial Vehicles
- 5.2. Market Analysis, Insights and Forecast - by Types
- 5.2.1. Single Freewheel
- 5.2.2. Multilevel Flywheel
- 5.3. Market Analysis, Insights and Forecast - by Region
- 5.3.1. North America
- 5.3.2. South America
- 5.3.3. Europe
- 5.3.4. Middle East & Africa
- 5.3.5. Asia Pacific
- 5.1. Market Analysis, Insights and Forecast - by Application
- 6. Global Automotive Flywheels Analysis, Insights and Forecast, 2021-2033
- 6.1. Market Analysis, Insights and Forecast - by Application
- 6.1.1. Passenger Cars
- 6.1.2. Commercial Vehicles
- 6.2. Market Analysis, Insights and Forecast - by Types
- 6.2.1. Single Freewheel
- 6.2.2. Multilevel Flywheel
- 6.1. Market Analysis, Insights and Forecast - by Application
- 7. North America Automotive Flywheels Analysis, Insights and Forecast, 2020-2032
- 7.1. Market Analysis, Insights and Forecast - by Application
- 7.1.1. Passenger Cars
- 7.1.2. Commercial Vehicles
- 7.2. Market Analysis, Insights and Forecast - by Types
- 7.2.1. Single Freewheel
- 7.2.2. Multilevel Flywheel
- 7.1. Market Analysis, Insights and Forecast - by Application
- 8. South America Automotive Flywheels Analysis, Insights and Forecast, 2020-2032
- 8.1. Market Analysis, Insights and Forecast - by Application
- 8.1.1. Passenger Cars
- 8.1.2. Commercial Vehicles
- 8.2. Market Analysis, Insights and Forecast - by Types
- 8.2.1. Single Freewheel
- 8.2.2. Multilevel Flywheel
- 8.1. Market Analysis, Insights and Forecast - by Application
- 9. Europe Automotive Flywheels Analysis, Insights and Forecast, 2020-2032
- 9.1. Market Analysis, Insights and Forecast - by Application
- 9.1.1. Passenger Cars
- 9.1.2. Commercial Vehicles
- 9.2. Market Analysis, Insights and Forecast - by Types
- 9.2.1. Single Freewheel
- 9.2.2. Multilevel Flywheel
- 9.1. Market Analysis, Insights and Forecast - by Application
- 10. Middle East & Africa Automotive Flywheels Analysis, Insights and Forecast, 2020-2032
- 10.1. Market Analysis, Insights and Forecast - by Application
- 10.1.1. Passenger Cars
- 10.1.2. Commercial Vehicles
- 10.2. Market Analysis, Insights and Forecast - by Types
- 10.2.1. Single Freewheel
- 10.2.2. Multilevel Flywheel
- 10.1. Market Analysis, Insights and Forecast - by Application
- 11. Asia Pacific Automotive Flywheels Analysis, Insights and Forecast, 2020-2032
- 11.1. Market Analysis, Insights and Forecast - by Application
- 11.1.1. Passenger Cars
- 11.1.2. Commercial Vehicles
- 11.2. Market Analysis, Insights and Forecast - by Types
- 11.2.1. Single Freewheel
- 11.2.2. Multilevel Flywheel
- 11.1. Market Analysis, Insights and Forecast - by Application
- 12. Competitive Analysis
- 12.1. Company Profiles
- 12.1.1 Schaeffler
- 12.1.1.1. Company Overview
- 12.1.1.2. Products
- 12.1.1.3. Company Financials
- 12.1.1.4. SWOT Analysis
- 12.1.2 Linamar
- 12.1.2.1. Company Overview
- 12.1.2.2. Products
- 12.1.2.3. Company Financials
- 12.1.2.4. SWOT Analysis
- 12.1.3 ZF
- 12.1.3.1. Company Overview
- 12.1.3.2. Products
- 12.1.3.3. Company Financials
- 12.1.3.4. SWOT Analysis
- 12.1.4 Valeo
- 12.1.4.1. Company Overview
- 12.1.4.2. Products
- 12.1.4.3. Company Financials
- 12.1.4.4. SWOT Analysis
- 12.1.5 EXEDY
- 12.1.5.1. Company Overview
- 12.1.5.2. Products
- 12.1.5.3. Company Financials
- 12.1.5.4. SWOT Analysis
- 12.1.6 Mancor
- 12.1.6.1. Company Overview
- 12.1.6.2. Products
- 12.1.6.3. Company Financials
- 12.1.6.4. SWOT Analysis
- 12.1.7 Metaldyne
- 12.1.7.1. Company Overview
- 12.1.7.2. Products
- 12.1.7.3. Company Financials
- 12.1.7.4. SWOT Analysis
- 12.1.8 Skyway Precision and Waupaca Foundry
- 12.1.8.1. Company Overview
- 12.1.8.2. Products
- 12.1.8.3. Company Financials
- 12.1.8.4. SWOT Analysis
- 12.1.9 Iljin
- 12.1.9.1. Company Overview
- 12.1.9.2. Products
- 12.1.9.3. Company Financials
- 12.1.9.4. SWOT Analysis
- 12.1.10 ATTC
- 12.1.10.1. Company Overview
- 12.1.10.2. Products
- 12.1.10.3. Company Financials
- 12.1.10.4. SWOT Analysis
- 12.1.11 Waupaca
- 12.1.11.1. Company Overview
- 12.1.11.2. Products
- 12.1.11.3. Company Financials
- 12.1.11.4. SWOT Analysis
- 12.1.12 Pace
- 12.1.12.1. Company Overview
- 12.1.12.2. Products
- 12.1.12.3. Company Financials
- 12.1.12.4. SWOT Analysis
- 12.1.13 Tupy
- 12.1.13.1. Company Overview
- 12.1.13.2. Products
- 12.1.13.3. Company Financials
- 12.1.13.4. SWOT Analysis
- 12.1.1 Schaeffler
- 12.2. Market Entropy
- 12.2.1 Company's Key Areas Served
- 12.2.2 Recent Developments
- 12.3. Company Market Share Analysis 2025
- 12.3.1 Top 5 Companies Market Share Analysis
- 12.3.2 Top 3 Companies Market Share Analysis
- 12.4. List of Potential Customers
- 13. Research Methodology
List of Figures
- Figure 1: Global Automotive Flywheels Revenue Breakdown (million, %) by Region 2025 & 2033
- Figure 2: Global Automotive Flywheels Volume Breakdown (K, %) by Region 2025 & 2033
- Figure 3: North America Automotive Flywheels Revenue (million), by Application 2025 & 2033
- Figure 4: North America Automotive Flywheels Volume (K), by Application 2025 & 2033
- Figure 5: North America Automotive Flywheels Revenue Share (%), by Application 2025 & 2033
- Figure 6: North America Automotive Flywheels Volume Share (%), by Application 2025 & 2033
- Figure 7: North America Automotive Flywheels Revenue (million), by Types 2025 & 2033
- Figure 8: North America Automotive Flywheels Volume (K), by Types 2025 & 2033
- Figure 9: North America Automotive Flywheels Revenue Share (%), by Types 2025 & 2033
- Figure 10: North America Automotive Flywheels Volume Share (%), by Types 2025 & 2033
- Figure 11: North America Automotive Flywheels Revenue (million), by Country 2025 & 2033
- Figure 12: North America Automotive Flywheels Volume (K), by Country 2025 & 2033
- Figure 13: North America Automotive Flywheels Revenue Share (%), by Country 2025 & 2033
- Figure 14: North America Automotive Flywheels Volume Share (%), by Country 2025 & 2033
- Figure 15: South America Automotive Flywheels Revenue (million), by Application 2025 & 2033
- Figure 16: South America Automotive Flywheels Volume (K), by Application 2025 & 2033
- Figure 17: South America Automotive Flywheels Revenue Share (%), by Application 2025 & 2033
- Figure 18: South America Automotive Flywheels Volume Share (%), by Application 2025 & 2033
- Figure 19: South America Automotive Flywheels Revenue (million), by Types 2025 & 2033
- Figure 20: South America Automotive Flywheels Volume (K), by Types 2025 & 2033
- Figure 21: South America Automotive Flywheels Revenue Share (%), by Types 2025 & 2033
- Figure 22: South America Automotive Flywheels Volume Share (%), by Types 2025 & 2033
- Figure 23: South America Automotive Flywheels Revenue (million), by Country 2025 & 2033
- Figure 24: South America Automotive Flywheels Volume (K), by Country 2025 & 2033
- Figure 25: South America Automotive Flywheels Revenue Share (%), by Country 2025 & 2033
- Figure 26: South America Automotive Flywheels Volume Share (%), by Country 2025 & 2033
- Figure 27: Europe Automotive Flywheels Revenue (million), by Application 2025 & 2033
- Figure 28: Europe Automotive Flywheels Volume (K), by Application 2025 & 2033
- Figure 29: Europe Automotive Flywheels Revenue Share (%), by Application 2025 & 2033
- Figure 30: Europe Automotive Flywheels Volume Share (%), by Application 2025 & 2033
- Figure 31: Europe Automotive Flywheels Revenue (million), by Types 2025 & 2033
- Figure 32: Europe Automotive Flywheels Volume (K), by Types 2025 & 2033
- Figure 33: Europe Automotive Flywheels Revenue Share (%), by Types 2025 & 2033
- Figure 34: Europe Automotive Flywheels Volume Share (%), by Types 2025 & 2033
- Figure 35: Europe Automotive Flywheels Revenue (million), by Country 2025 & 2033
- Figure 36: Europe Automotive Flywheels Volume (K), by Country 2025 & 2033
- Figure 37: Europe Automotive Flywheels Revenue Share (%), by Country 2025 & 2033
- Figure 38: Europe Automotive Flywheels Volume Share (%), by Country 2025 & 2033
- Figure 39: Middle East & Africa Automotive Flywheels Revenue (million), by Application 2025 & 2033
- Figure 40: Middle East & Africa Automotive Flywheels Volume (K), by Application 2025 & 2033
- Figure 41: Middle East & Africa Automotive Flywheels Revenue Share (%), by Application 2025 & 2033
- Figure 42: Middle East & Africa Automotive Flywheels Volume Share (%), by Application 2025 & 2033
- Figure 43: Middle East & Africa Automotive Flywheels Revenue (million), by Types 2025 & 2033
- Figure 44: Middle East & Africa Automotive Flywheels Volume (K), by Types 2025 & 2033
- Figure 45: Middle East & Africa Automotive Flywheels Revenue Share (%), by Types 2025 & 2033
- Figure 46: Middle East & Africa Automotive Flywheels Volume Share (%), by Types 2025 & 2033
- Figure 47: Middle East & Africa Automotive Flywheels Revenue (million), by Country 2025 & 2033
- Figure 48: Middle East & Africa Automotive Flywheels Volume (K), by Country 2025 & 2033
- Figure 49: Middle East & Africa Automotive Flywheels Revenue Share (%), by Country 2025 & 2033
- Figure 50: Middle East & Africa Automotive Flywheels Volume Share (%), by Country 2025 & 2033
- Figure 51: Asia Pacific Automotive Flywheels Revenue (million), by Application 2025 & 2033
- Figure 52: Asia Pacific Automotive Flywheels Volume (K), by Application 2025 & 2033
- Figure 53: Asia Pacific Automotive Flywheels Revenue Share (%), by Application 2025 & 2033
- Figure 54: Asia Pacific Automotive Flywheels Volume Share (%), by Application 2025 & 2033
- Figure 55: Asia Pacific Automotive Flywheels Revenue (million), by Types 2025 & 2033
- Figure 56: Asia Pacific Automotive Flywheels Volume (K), by Types 2025 & 2033
- Figure 57: Asia Pacific Automotive Flywheels Revenue Share (%), by Types 2025 & 2033
- Figure 58: Asia Pacific Automotive Flywheels Volume Share (%), by Types 2025 & 2033
- Figure 59: Asia Pacific Automotive Flywheels Revenue (million), by Country 2025 & 2033
- Figure 60: Asia Pacific Automotive Flywheels Volume (K), by Country 2025 & 2033
- Figure 61: Asia Pacific Automotive Flywheels Revenue Share (%), by Country 2025 & 2033
- Figure 62: Asia Pacific Automotive Flywheels Volume Share (%), by Country 2025 & 2033
List of Tables
- Table 1: Global Automotive Flywheels Revenue million Forecast, by Application 2020 & 2033
- Table 2: Global Automotive Flywheels Volume K Forecast, by Application 2020 & 2033
- Table 3: Global Automotive Flywheels Revenue million Forecast, by Types 2020 & 2033
- Table 4: Global Automotive Flywheels Volume K Forecast, by Types 2020 & 2033
- Table 5: Global Automotive Flywheels Revenue million Forecast, by Region 2020 & 2033
- Table 6: Global Automotive Flywheels Volume K Forecast, by Region 2020 & 2033
- Table 7: Global Automotive Flywheels Revenue million Forecast, by Application 2020 & 2033
- Table 8: Global Automotive Flywheels Volume K Forecast, by Application 2020 & 2033
- Table 9: Global Automotive Flywheels Revenue million Forecast, by Types 2020 & 2033
- Table 10: Global Automotive Flywheels Volume K Forecast, by Types 2020 & 2033
- Table 11: Global Automotive Flywheels Revenue million Forecast, by Country 2020 & 2033
- Table 12: Global Automotive Flywheels Volume K Forecast, by Country 2020 & 2033
- Table 13: United States Automotive Flywheels Revenue (million) Forecast, by Application 2020 & 2033
- Table 14: United States Automotive Flywheels Volume (K) Forecast, by Application 2020 & 2033
- Table 15: Canada Automotive Flywheels Revenue (million) Forecast, by Application 2020 & 2033
- Table 16: Canada Automotive Flywheels Volume (K) Forecast, by Application 2020 & 2033
- Table 17: Mexico Automotive Flywheels Revenue (million) Forecast, by Application 2020 & 2033
- Table 18: Mexico Automotive Flywheels Volume (K) Forecast, by Application 2020 & 2033
- Table 19: Global Automotive Flywheels Revenue million Forecast, by Application 2020 & 2033
- Table 20: Global Automotive Flywheels Volume K Forecast, by Application 2020 & 2033
- Table 21: Global Automotive Flywheels Revenue million Forecast, by Types 2020 & 2033
- Table 22: Global Automotive Flywheels Volume K Forecast, by Types 2020 & 2033
- Table 23: Global Automotive Flywheels Revenue million Forecast, by Country 2020 & 2033
- Table 24: Global Automotive Flywheels Volume K Forecast, by Country 2020 & 2033
- Table 25: Brazil Automotive Flywheels Revenue (million) Forecast, by Application 2020 & 2033
- Table 26: Brazil Automotive Flywheels Volume (K) Forecast, by Application 2020 & 2033
- Table 27: Argentina Automotive Flywheels Revenue (million) Forecast, by Application 2020 & 2033
- Table 28: Argentina Automotive Flywheels Volume (K) Forecast, by Application 2020 & 2033
- Table 29: Rest of South America Automotive Flywheels Revenue (million) Forecast, by Application 2020 & 2033
- Table 30: Rest of South America Automotive Flywheels Volume (K) Forecast, by Application 2020 & 2033
- Table 31: Global Automotive Flywheels Revenue million Forecast, by Application 2020 & 2033
- Table 32: Global Automotive Flywheels Volume K Forecast, by Application 2020 & 2033
- Table 33: Global Automotive Flywheels Revenue million Forecast, by Types 2020 & 2033
- Table 34: Global Automotive Flywheels Volume K Forecast, by Types 2020 & 2033
- Table 35: Global Automotive Flywheels Revenue million Forecast, by Country 2020 & 2033
- Table 36: Global Automotive Flywheels Volume K Forecast, by Country 2020 & 2033
- Table 37: United Kingdom Automotive Flywheels Revenue (million) Forecast, by Application 2020 & 2033
- Table 38: United Kingdom Automotive Flywheels Volume (K) Forecast, by Application 2020 & 2033
- Table 39: Germany Automotive Flywheels Revenue (million) Forecast, by Application 2020 & 2033
- Table 40: Germany Automotive Flywheels Volume (K) Forecast, by Application 2020 & 2033
- Table 41: France Automotive Flywheels Revenue (million) Forecast, by Application 2020 & 2033
- Table 42: France Automotive Flywheels Volume (K) Forecast, by Application 2020 & 2033
- Table 43: Italy Automotive Flywheels Revenue (million) Forecast, by Application 2020 & 2033
- Table 44: Italy Automotive Flywheels Volume (K) Forecast, by Application 2020 & 2033
- Table 45: Spain Automotive Flywheels Revenue (million) Forecast, by Application 2020 & 2033
- Table 46: Spain Automotive Flywheels Volume (K) Forecast, by Application 2020 & 2033
- Table 47: Russia Automotive Flywheels Revenue (million) Forecast, by Application 2020 & 2033
- Table 48: Russia Automotive Flywheels Volume (K) Forecast, by Application 2020 & 2033
- Table 49: Benelux Automotive Flywheels Revenue (million) Forecast, by Application 2020 & 2033
- Table 50: Benelux Automotive Flywheels Volume (K) Forecast, by Application 2020 & 2033
- Table 51: Nordics Automotive Flywheels Revenue (million) Forecast, by Application 2020 & 2033
- Table 52: Nordics Automotive Flywheels Volume (K) Forecast, by Application 2020 & 2033
- Table 53: Rest of Europe Automotive Flywheels Revenue (million) Forecast, by Application 2020 & 2033
- Table 54: Rest of Europe Automotive Flywheels Volume (K) Forecast, by Application 2020 & 2033
- Table 55: Global Automotive Flywheels Revenue million Forecast, by Application 2020 & 2033
- Table 56: Global Automotive Flywheels Volume K Forecast, by Application 2020 & 2033
- Table 57: Global Automotive Flywheels Revenue million Forecast, by Types 2020 & 2033
- Table 58: Global Automotive Flywheels Volume K Forecast, by Types 2020 & 2033
- Table 59: Global Automotive Flywheels Revenue million Forecast, by Country 2020 & 2033
- Table 60: Global Automotive Flywheels Volume K Forecast, by Country 2020 & 2033
- Table 61: Turkey Automotive Flywheels Revenue (million) Forecast, by Application 2020 & 2033
- Table 62: Turkey Automotive Flywheels Volume (K) Forecast, by Application 2020 & 2033
- Table 63: Israel Automotive Flywheels Revenue (million) Forecast, by Application 2020 & 2033
- Table 64: Israel Automotive Flywheels Volume (K) Forecast, by Application 2020 & 2033
- Table 65: GCC Automotive Flywheels Revenue (million) Forecast, by Application 2020 & 2033
- Table 66: GCC Automotive Flywheels Volume (K) Forecast, by Application 2020 & 2033
- Table 67: North Africa Automotive Flywheels Revenue (million) Forecast, by Application 2020 & 2033
- Table 68: North Africa Automotive Flywheels Volume (K) Forecast, by Application 2020 & 2033
- Table 69: South Africa Automotive Flywheels Revenue (million) Forecast, by Application 2020 & 2033
- Table 70: South Africa Automotive Flywheels Volume (K) Forecast, by Application 2020 & 2033
- Table 71: Rest of Middle East & Africa Automotive Flywheels Revenue (million) Forecast, by Application 2020 & 2033
- Table 72: Rest of Middle East & Africa Automotive Flywheels Volume (K) Forecast, by Application 2020 & 2033
- Table 73: Global Automotive Flywheels Revenue million Forecast, by Application 2020 & 2033
- Table 74: Global Automotive Flywheels Volume K Forecast, by Application 2020 & 2033
- Table 75: Global Automotive Flywheels Revenue million Forecast, by Types 2020 & 2033
- Table 76: Global Automotive Flywheels Volume K Forecast, by Types 2020 & 2033
- Table 77: Global Automotive Flywheels Revenue million Forecast, by Country 2020 & 2033
- Table 78: Global Automotive Flywheels Volume K Forecast, by Country 2020 & 2033
- Table 79: China Automotive Flywheels Revenue (million) Forecast, by Application 2020 & 2033
- Table 80: China Automotive Flywheels Volume (K) Forecast, by Application 2020 & 2033
- Table 81: India Automotive Flywheels Revenue (million) Forecast, by Application 2020 & 2033
- Table 82: India Automotive Flywheels Volume (K) Forecast, by Application 2020 & 2033
- Table 83: Japan Automotive Flywheels Revenue (million) Forecast, by Application 2020 & 2033
- Table 84: Japan Automotive Flywheels Volume (K) Forecast, by Application 2020 & 2033
- Table 85: South Korea Automotive Flywheels Revenue (million) Forecast, by Application 2020 & 2033
- Table 86: South Korea Automotive Flywheels Volume (K) Forecast, by Application 2020 & 2033
- Table 87: ASEAN Automotive Flywheels Revenue (million) Forecast, by Application 2020 & 2033
- Table 88: ASEAN Automotive Flywheels Volume (K) Forecast, by Application 2020 & 2033
- Table 89: Oceania Automotive Flywheels Revenue (million) Forecast, by Application 2020 & 2033
- Table 90: Oceania Automotive Flywheels Volume (K) Forecast, by Application 2020 & 2033
- Table 91: Rest of Asia Pacific Automotive Flywheels Revenue (million) Forecast, by Application 2020 & 2033
- Table 92: Rest of Asia Pacific Automotive Flywheels Volume (K) Forecast, by Application 2020 & 2033
Frequently Asked Questions
1. What is the projected Compound Annual Growth Rate (CAGR) of the Automotive Flywheels?
The projected CAGR is approximately XX%.
2. Which companies are prominent players in the Automotive Flywheels?
Key companies in the market include Schaeffler, Linamar, ZF, Valeo, EXEDY, Mancor, Metaldyne, Skyway Precision and Waupaca Foundry, Iljin, ATTC, Waupaca, Pace, Tupy.
3. What are the main segments of the Automotive Flywheels?
The market segments include Application, Types.
4. Can you provide details about the market size?
The market size is estimated to be USD XXX million as of 2022.
5. What are some drivers contributing to market growth?
N/A
6. What are the notable trends driving market growth?
N/A
7. Are there any restraints impacting market growth?
N/A
8. Can you provide examples of recent developments in the market?
N/A
9. What pricing options are available for accessing the report?
Pricing options include single-user, multi-user, and enterprise licenses priced at USD 3350.00, USD 5025.00, and USD 6700.00 respectively.
10. Is the market size provided in terms of value or volume?
The market size is provided in terms of value, measured in million and volume, measured in K.
11. Are there any specific market keywords associated with the report?
Yes, the market keyword associated with the report is "Automotive Flywheels," which aids in identifying and referencing the specific market segment covered.
12. How do I determine which pricing option suits my needs best?
The pricing options vary based on user requirements and access needs. Individual users may opt for single-user licenses, while businesses requiring broader access may choose multi-user or enterprise licenses for cost-effective access to the report.
13. Are there any additional resources or data provided in the Automotive Flywheels report?
While the report offers comprehensive insights, it's advisable to review the specific contents or supplementary materials provided to ascertain if additional resources or data are available.
14. How can I stay updated on further developments or reports in the Automotive Flywheels?
To stay informed about further developments, trends, and reports in the Automotive Flywheels, consider subscribing to industry newsletters, following relevant companies and organizations, or regularly checking reputable industry news sources and publications.
Methodology
Step 1 - Identification of Relevant Samples Size from Population Database


Step 2 - Approaches for Defining Global Market Size (Value, Volume* & Price*)

Note*: In applicable scenarios
Step 3 - Data Sources
Primary Research
- Web Analytics
- Survey Reports
- Research Institute
- Latest Research Reports
- Opinion Leaders
Secondary Research
- Annual Reports
- White Paper
- Latest Press Release
- Industry Association
- Paid Database
- Investor Presentations

Step 4 - Data Triangulation
Involves using different sources of information in order to increase the validity of a study
These sources are likely to be stakeholders in a program - participants, other researchers, program staff, other community members, and so on.
Then we put all data in single framework & apply various statistical tools to find out the dynamic on the market.
During the analysis stage, feedback from the stakeholder groups would be compared to determine areas of agreement as well as areas of divergence