

Key Insights
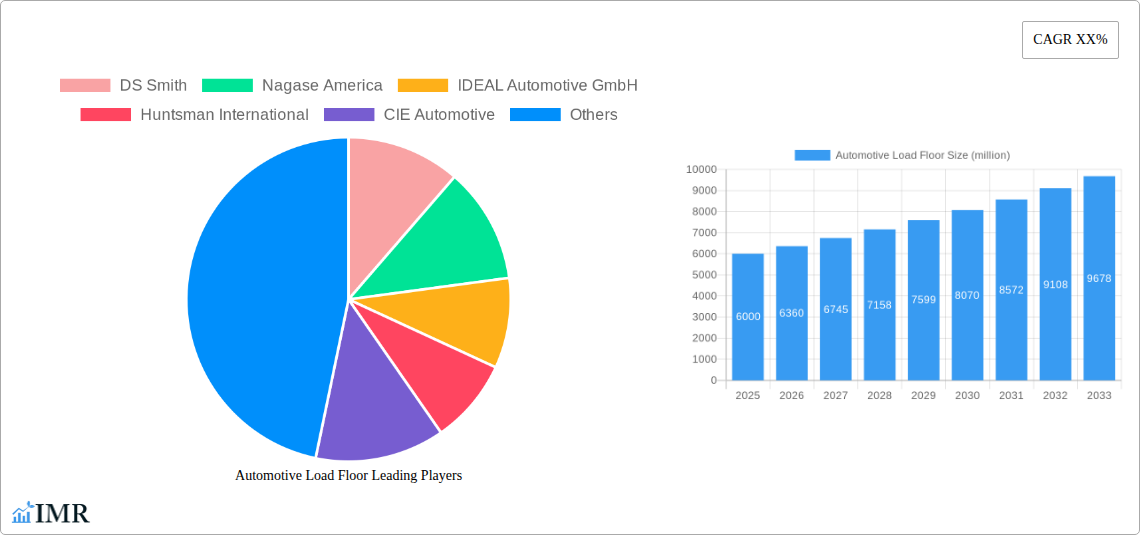
The automotive load floor market is poised for significant expansion, propelled by the escalating demand for lightweight, durable vehicles and the widespread integration of advanced driver-assistance systems (ADAS). This growth is underpinned by several critical drivers: stringent global fuel efficiency mandates are compelling automakers to prioritize lightweight materials, with load floors representing a key opportunity for mass reduction. Furthermore, the increasing sophistication of electronic components and battery systems in electric vehicles (EVs) and hybrids necessitates robust and adaptable load floor designs to manage enhanced weight and complexity. The growing trend toward vehicle customization and modularity also fosters innovation in load floor solutions, catering to diverse vehicle segments and consumer preferences. Leading market participants, including DS Smith, Nagase America, and Huntsman International, are at the forefront of developing and supplying cutting-edge materials and designs to address these evolving industry needs. The competitive arena encompasses both material suppliers and automotive component manufacturers, fostering a dynamic market characterized by continuous innovation.
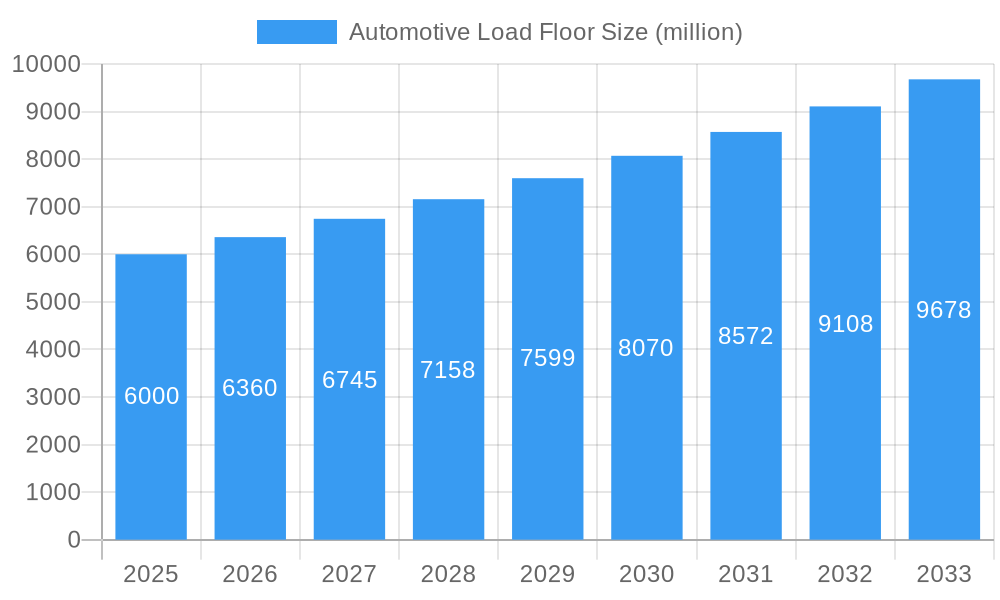
Automotive Load Floor Market Size (In Million)
The automotive load floor market is projected to experience robust growth, with an estimated Compound Annual Growth Rate (CAGR) of 5.1%. The market size was valued at 300.9 million in the base year 2025. Continued demand for lightweighting solutions, advancements in materials science and manufacturing, and the expanding electric and hybrid vehicle sectors will drive this growth. However, market expansion may be constrained by volatility in raw material pricing, supply chain disruptions, and economic downturns impacting automotive production. Regional market dynamics are expected to vary, with North America and Europe likely to lead due to higher adoption rates of advanced vehicle technologies and stringent emission standards.
Automotive Load Floor Company Market Share
Automotive Load Floor Market Report: 2019-2033
This comprehensive report provides an in-depth analysis of the global Automotive Load Floor market, projecting robust growth from 2019 to 2033. The report delves into market dynamics, growth trends, regional dominance, product landscapes, challenges, and opportunities, offering invaluable insights for industry professionals, investors, and strategic decision-makers. With a focus on key players like DS Smith, Nagase America, and IDEAL Automotive GmbH, this report is a crucial resource for navigating this evolving sector. The report covers the parent market of Automotive Interior Parts and the child market of Automotive Flooring Systems. The market size is estimated to reach xx million units by 2025, representing significant growth potential.
Study Period: 2019-2033; Base Year: 2025; Estimated Year: 2025; Forecast Period: 2025-2033; Historical Period: 2019-2024
Automotive Load Floor Market Dynamics & Structure
The Automotive Load Floor market is characterized by moderate concentration, with key players holding significant market share but facing intense competition. Technological innovation, particularly in lightweight materials and advanced manufacturing processes, is a key driver. Stringent safety and emissions regulations are shaping product design and material choices. The market experiences competitive pressure from alternative flooring solutions and constant material price fluctuations. Mergers and acquisitions (M&A) activity remains moderate, with strategic partnerships playing a significant role in expanding market reach and technological capabilities.
- Market Concentration: Moderately concentrated, with top 5 players holding approximately xx% market share in 2025.
- Technological Innovation: Focus on lightweight materials (e.g., composites, high-strength steel), improved sound insulation, and cost-effective manufacturing.
- Regulatory Framework: Compliance with safety and emission standards drives innovation in material selection and manufacturing processes.
- Competitive Product Substitutes: Alternative flooring materials and designs pose competitive pressure.
- End-User Demographics: Primarily automotive manufacturers (OEMs) and Tier 1 suppliers.
- M&A Trends: Moderate M&A activity driven by expansion into new markets and technology acquisition. Approximately xx deals were recorded between 2019 and 2024.
Automotive Load Floor Growth Trends & Insights
The Automotive Load Floor market is projected to experience substantial growth during the forecast period (2025-2033), driven by increasing vehicle production, rising demand for lightweight vehicles, and advancements in material science. Adoption rates of innovative load floor technologies are expected to increase significantly, fueled by the rising demand for improved fuel efficiency and enhanced safety features. Technological disruptions, such as the introduction of advanced composite materials, are reshaping the market landscape. Consumer preferences for comfortable and aesthetically pleasing interiors also contribute to the market's growth trajectory. The CAGR for the market is estimated at xx% during the forecast period, with market penetration reaching xx% by 2033. The increasing adoption of electric vehicles (EVs) will further boost demand for lightweight and efficient load floor systems.
Dominant Regions, Countries, or Segments in Automotive Load Floor
North America currently holds the largest market share in the Automotive Load Floor sector, driven by robust automotive production and a high adoption rate of advanced technologies. However, the Asia-Pacific region is poised for significant growth due to rapid industrialization, increasing vehicle sales, and favorable government policies supporting automotive manufacturing. Within North America, the United States is the dominant market, owing to its large automotive industry and high demand for advanced vehicle features. Europe also displays substantial growth potential, driven by stringent environmental regulations and a focus on fuel-efficient vehicles.
- Key Drivers in North America: High vehicle production rates, strong consumer demand for advanced features.
- Key Drivers in Asia-Pacific: Rapid industrialization, increasing vehicle sales, government support for the automotive sector.
- Key Drivers in Europe: Stringent environmental regulations, focus on fuel-efficient vehicles.
Automotive Load Floor Product Landscape
The Automotive Load Floor market offers a diverse range of products, including those made from steel, aluminum, composites, and other advanced materials. Product innovations are largely focused on enhancing durability, reducing weight, improving sound insulation, and enhancing design flexibility. Key performance metrics include weight, strength, stiffness, sound absorption, and cost-effectiveness. Unique selling propositions often involve superior material properties, optimized designs, and integration with other vehicle systems.
Key Drivers, Barriers & Challenges in Automotive Load Floor
Key Drivers: Increasing demand for lightweight vehicles, stringent fuel efficiency standards, growing adoption of advanced driver-assistance systems (ADAS), and technological advancements in materials science are propelling market growth. The increasing focus on vehicle safety features also drives innovation and adoption of advanced load floor systems.
Key Challenges: Fluctuating raw material prices, intense competition from established and emerging players, and the complexities of integrating new technologies into existing manufacturing processes pose significant challenges. Supply chain disruptions and the need for significant upfront investment in advanced manufacturing capabilities also impact market growth. These factors can lead to cost escalation and reduced profitability for market participants.
Emerging Opportunities in Automotive Load Floor
Untapped markets in developing economies present significant opportunities for expansion. Innovation in sustainable and recycled materials offers a promising avenue for growth, aligning with environmental concerns. Integration of advanced functionalities such as thermal management systems and wireless charging capabilities into load floor designs presents further opportunities for value creation. Customization and personalization options can appeal to consumers seeking unique vehicle features.
Growth Accelerators in the Automotive Load Floor Industry
Strategic partnerships between automotive manufacturers and material suppliers are accelerating innovation and driving market expansion. Technological breakthroughs in lightweight materials and manufacturing processes are enhancing product performance and reducing costs. Expanding into new vehicle segments (e.g., electric vehicles, commercial vehicles) presents significant growth avenues. Government incentives and policies promoting fuel efficiency and emissions reduction further contribute to market growth.
Key Players Shaping the Automotive Load Floor Market
- DS Smith
- Nagase America
- IDEAL Automotive GmbH
- Huntsman International
- CIE Automotive
- SA Automotive
- Gemini Group
- ABC Technologies
- Woodbridge
Notable Milestones in Automotive Load Floor Sector
- 2020, Q4: Introduction of a new lightweight composite material by Huntsman International significantly reducing load floor weight.
- 2021, Q2: Strategic partnership between DS Smith and CIE Automotive to develop innovative load floor designs for electric vehicles.
- 2022, Q3: Acquisition of a smaller load floor manufacturer by Woodbridge, expanding its product portfolio and market reach.
- 2023, Q1: Launch of a new sound-insulating load floor system by IDEAL Automotive GmbH.
In-Depth Automotive Load Floor Market Outlook
The Automotive Load Floor market is poised for sustained growth, driven by a confluence of factors including increasing vehicle production, rising demand for lightweight vehicles, and the continued development of advanced materials and manufacturing techniques. Strategic partnerships, technological breakthroughs, and expansion into new vehicle segments will further fuel market expansion, providing significant opportunities for industry players to capitalize on the growing demand for innovative and efficient load floor solutions. The market's future potential is bright, promising significant returns for companies that successfully navigate the evolving landscape.
Automotive Load Floor Segmentation
-
1. Application
- 1.1. Passenger Car
- 1.2. Commercial Vehicle
-
2. Types
- 2.1. Hardboard
- 2.2. Fluted Polypropylene
- 2.3. Honeycomb Polyprolene
- 2.4. Composites
Automotive Load Floor Segmentation By Geography
-
1. North America
- 1.1. United States
- 1.2. Canada
- 1.3. Mexico
-
2. South America
- 2.1. Brazil
- 2.2. Argentina
- 2.3. Rest of South America
-
3. Europe
- 3.1. United Kingdom
- 3.2. Germany
- 3.3. France
- 3.4. Italy
- 3.5. Spain
- 3.6. Russia
- 3.7. Benelux
- 3.8. Nordics
- 3.9. Rest of Europe
-
4. Middle East & Africa
- 4.1. Turkey
- 4.2. Israel
- 4.3. GCC
- 4.4. North Africa
- 4.5. South Africa
- 4.6. Rest of Middle East & Africa
-
5. Asia Pacific
- 5.1. China
- 5.2. India
- 5.3. Japan
- 5.4. South Korea
- 5.5. ASEAN
- 5.6. Oceania
- 5.7. Rest of Asia Pacific

Automotive Load Floor Regional Market Share
Geographic Coverage of Automotive Load Floor
Automotive Load Floor REPORT HIGHLIGHTS
| Aspects | Details |
|---|---|
| Study Period | 2020-2034 |
| Base Year | 2025 |
| Estimated Year | 2026 |
| Forecast Period | 2026-2034 |
| Historical Period | 2020-2025 |
| Growth Rate | CAGR of 5.1% from 2020-2034 |
| Segmentation |
|
Table of Contents
- 1. Introduction
- 1.1. Research Scope
- 1.2. Market Segmentation
- 1.3. Research Objective
- 1.4. Definitions and Assumptions
- 2. Executive Summary
- 2.1. Market Snapshot
- 3. Market Dynamics
- 3.1. Market Drivers
- 3.2. Market Restrains
- 3.3. Market Trends
- 3.4. Market Opportunities
- 4. Market Factor Analysis
- 4.1. Porters Five Forces
- 4.1.1. Bargaining Power of Suppliers
- 4.1.2. Bargaining Power of Buyers
- 4.1.3. Threat of New Entrants
- 4.1.4. Threat of Substitutes
- 4.1.5. Competitive Rivalry
- 4.2. PESTEL analysis
- 4.3. BCG Analysis
- 4.3.1. Stars (High Growth, High Market Share)
- 4.3.2. Cash Cows (Low Growth, High Market Share)
- 4.3.3. Question Mark (High Growth, Low Market Share)
- 4.3.4. Dogs (Low Growth, Low Market Share)
- 4.4. Ansoff Matrix Analysis
- 4.5. Supply Chain Analysis
- 4.6. Regulatory Landscape
- 4.7. Current Market Potential and Opportunity Assessment (TAM–SAM–SOM Framework)
- 4.8. IMR Analyst Note
- 4.1. Porters Five Forces
- 5. Market Analysis, Insights and Forecast 2021-2033
- 5.1. Market Analysis, Insights and Forecast - by Application
- 5.1.1. Passenger Car
- 5.1.2. Commercial Vehicle
- 5.2. Market Analysis, Insights and Forecast - by Types
- 5.2.1. Hardboard
- 5.2.2. Fluted Polypropylene
- 5.2.3. Honeycomb Polyprolene
- 5.2.4. Composites
- 5.3. Market Analysis, Insights and Forecast - by Region
- 5.3.1. North America
- 5.3.2. South America
- 5.3.3. Europe
- 5.3.4. Middle East & Africa
- 5.3.5. Asia Pacific
- 5.1. Market Analysis, Insights and Forecast - by Application
- 6. Global Automotive Load Floor Analysis, Insights and Forecast, 2021-2033
- 6.1. Market Analysis, Insights and Forecast - by Application
- 6.1.1. Passenger Car
- 6.1.2. Commercial Vehicle
- 6.2. Market Analysis, Insights and Forecast - by Types
- 6.2.1. Hardboard
- 6.2.2. Fluted Polypropylene
- 6.2.3. Honeycomb Polyprolene
- 6.2.4. Composites
- 6.1. Market Analysis, Insights and Forecast - by Application
- 7. North America Automotive Load Floor Analysis, Insights and Forecast, 2020-2032
- 7.1. Market Analysis, Insights and Forecast - by Application
- 7.1.1. Passenger Car
- 7.1.2. Commercial Vehicle
- 7.2. Market Analysis, Insights and Forecast - by Types
- 7.2.1. Hardboard
- 7.2.2. Fluted Polypropylene
- 7.2.3. Honeycomb Polyprolene
- 7.2.4. Composites
- 7.1. Market Analysis, Insights and Forecast - by Application
- 8. South America Automotive Load Floor Analysis, Insights and Forecast, 2020-2032
- 8.1. Market Analysis, Insights and Forecast - by Application
- 8.1.1. Passenger Car
- 8.1.2. Commercial Vehicle
- 8.2. Market Analysis, Insights and Forecast - by Types
- 8.2.1. Hardboard
- 8.2.2. Fluted Polypropylene
- 8.2.3. Honeycomb Polyprolene
- 8.2.4. Composites
- 8.1. Market Analysis, Insights and Forecast - by Application
- 9. Europe Automotive Load Floor Analysis, Insights and Forecast, 2020-2032
- 9.1. Market Analysis, Insights and Forecast - by Application
- 9.1.1. Passenger Car
- 9.1.2. Commercial Vehicle
- 9.2. Market Analysis, Insights and Forecast - by Types
- 9.2.1. Hardboard
- 9.2.2. Fluted Polypropylene
- 9.2.3. Honeycomb Polyprolene
- 9.2.4. Composites
- 9.1. Market Analysis, Insights and Forecast - by Application
- 10. Middle East & Africa Automotive Load Floor Analysis, Insights and Forecast, 2020-2032
- 10.1. Market Analysis, Insights and Forecast - by Application
- 10.1.1. Passenger Car
- 10.1.2. Commercial Vehicle
- 10.2. Market Analysis, Insights and Forecast - by Types
- 10.2.1. Hardboard
- 10.2.2. Fluted Polypropylene
- 10.2.3. Honeycomb Polyprolene
- 10.2.4. Composites
- 10.1. Market Analysis, Insights and Forecast - by Application
- 11. Asia Pacific Automotive Load Floor Analysis, Insights and Forecast, 2020-2032
- 11.1. Market Analysis, Insights and Forecast - by Application
- 11.1.1. Passenger Car
- 11.1.2. Commercial Vehicle
- 11.2. Market Analysis, Insights and Forecast - by Types
- 11.2.1. Hardboard
- 11.2.2. Fluted Polypropylene
- 11.2.3. Honeycomb Polyprolene
- 11.2.4. Composites
- 11.1. Market Analysis, Insights and Forecast - by Application
- 12. Competitive Analysis
- 12.1. Company Profiles
- 12.1.1 DS Smith
- 12.1.1.1. Company Overview
- 12.1.1.2. Products
- 12.1.1.3. Company Financials
- 12.1.1.4. SWOT Analysis
- 12.1.2 Nagase America
- 12.1.2.1. Company Overview
- 12.1.2.2. Products
- 12.1.2.3. Company Financials
- 12.1.2.4. SWOT Analysis
- 12.1.3 IDEAL Automotive GmbH
- 12.1.3.1. Company Overview
- 12.1.3.2. Products
- 12.1.3.3. Company Financials
- 12.1.3.4. SWOT Analysis
- 12.1.4 Huntsman International
- 12.1.4.1. Company Overview
- 12.1.4.2. Products
- 12.1.4.3. Company Financials
- 12.1.4.4. SWOT Analysis
- 12.1.5 CIE Automotive
- 12.1.5.1. Company Overview
- 12.1.5.2. Products
- 12.1.5.3. Company Financials
- 12.1.5.4. SWOT Analysis
- 12.1.6 SA Automotive
- 12.1.6.1. Company Overview
- 12.1.6.2. Products
- 12.1.6.3. Company Financials
- 12.1.6.4. SWOT Analysis
- 12.1.7 Gemini Group
- 12.1.7.1. Company Overview
- 12.1.7.2. Products
- 12.1.7.3. Company Financials
- 12.1.7.4. SWOT Analysis
- 12.1.8 ABC Technologies
- 12.1.8.1. Company Overview
- 12.1.8.2. Products
- 12.1.8.3. Company Financials
- 12.1.8.4. SWOT Analysis
- 12.1.9 Woodbridge
- 12.1.9.1. Company Overview
- 12.1.9.2. Products
- 12.1.9.3. Company Financials
- 12.1.9.4. SWOT Analysis
- 12.1.1 DS Smith
- 12.2. Market Entropy
- 12.2.1 Company's Key Areas Served
- 12.2.2 Recent Developments
- 12.3. Company Market Share Analysis 2025
- 12.3.1 Top 5 Companies Market Share Analysis
- 12.3.2 Top 3 Companies Market Share Analysis
- 12.4. List of Potential Customers
- 13. Research Methodology
List of Figures
- Figure 1: Global Automotive Load Floor Revenue Breakdown (million, %) by Region 2025 & 2033
- Figure 2: Global Automotive Load Floor Volume Breakdown (K, %) by Region 2025 & 2033
- Figure 3: North America Automotive Load Floor Revenue (million), by Application 2025 & 2033
- Figure 4: North America Automotive Load Floor Volume (K), by Application 2025 & 2033
- Figure 5: North America Automotive Load Floor Revenue Share (%), by Application 2025 & 2033
- Figure 6: North America Automotive Load Floor Volume Share (%), by Application 2025 & 2033
- Figure 7: North America Automotive Load Floor Revenue (million), by Types 2025 & 2033
- Figure 8: North America Automotive Load Floor Volume (K), by Types 2025 & 2033
- Figure 9: North America Automotive Load Floor Revenue Share (%), by Types 2025 & 2033
- Figure 10: North America Automotive Load Floor Volume Share (%), by Types 2025 & 2033
- Figure 11: North America Automotive Load Floor Revenue (million), by Country 2025 & 2033
- Figure 12: North America Automotive Load Floor Volume (K), by Country 2025 & 2033
- Figure 13: North America Automotive Load Floor Revenue Share (%), by Country 2025 & 2033
- Figure 14: North America Automotive Load Floor Volume Share (%), by Country 2025 & 2033
- Figure 15: South America Automotive Load Floor Revenue (million), by Application 2025 & 2033
- Figure 16: South America Automotive Load Floor Volume (K), by Application 2025 & 2033
- Figure 17: South America Automotive Load Floor Revenue Share (%), by Application 2025 & 2033
- Figure 18: South America Automotive Load Floor Volume Share (%), by Application 2025 & 2033
- Figure 19: South America Automotive Load Floor Revenue (million), by Types 2025 & 2033
- Figure 20: South America Automotive Load Floor Volume (K), by Types 2025 & 2033
- Figure 21: South America Automotive Load Floor Revenue Share (%), by Types 2025 & 2033
- Figure 22: South America Automotive Load Floor Volume Share (%), by Types 2025 & 2033
- Figure 23: South America Automotive Load Floor Revenue (million), by Country 2025 & 2033
- Figure 24: South America Automotive Load Floor Volume (K), by Country 2025 & 2033
- Figure 25: South America Automotive Load Floor Revenue Share (%), by Country 2025 & 2033
- Figure 26: South America Automotive Load Floor Volume Share (%), by Country 2025 & 2033
- Figure 27: Europe Automotive Load Floor Revenue (million), by Application 2025 & 2033
- Figure 28: Europe Automotive Load Floor Volume (K), by Application 2025 & 2033
- Figure 29: Europe Automotive Load Floor Revenue Share (%), by Application 2025 & 2033
- Figure 30: Europe Automotive Load Floor Volume Share (%), by Application 2025 & 2033
- Figure 31: Europe Automotive Load Floor Revenue (million), by Types 2025 & 2033
- Figure 32: Europe Automotive Load Floor Volume (K), by Types 2025 & 2033
- Figure 33: Europe Automotive Load Floor Revenue Share (%), by Types 2025 & 2033
- Figure 34: Europe Automotive Load Floor Volume Share (%), by Types 2025 & 2033
- Figure 35: Europe Automotive Load Floor Revenue (million), by Country 2025 & 2033
- Figure 36: Europe Automotive Load Floor Volume (K), by Country 2025 & 2033
- Figure 37: Europe Automotive Load Floor Revenue Share (%), by Country 2025 & 2033
- Figure 38: Europe Automotive Load Floor Volume Share (%), by Country 2025 & 2033
- Figure 39: Middle East & Africa Automotive Load Floor Revenue (million), by Application 2025 & 2033
- Figure 40: Middle East & Africa Automotive Load Floor Volume (K), by Application 2025 & 2033
- Figure 41: Middle East & Africa Automotive Load Floor Revenue Share (%), by Application 2025 & 2033
- Figure 42: Middle East & Africa Automotive Load Floor Volume Share (%), by Application 2025 & 2033
- Figure 43: Middle East & Africa Automotive Load Floor Revenue (million), by Types 2025 & 2033
- Figure 44: Middle East & Africa Automotive Load Floor Volume (K), by Types 2025 & 2033
- Figure 45: Middle East & Africa Automotive Load Floor Revenue Share (%), by Types 2025 & 2033
- Figure 46: Middle East & Africa Automotive Load Floor Volume Share (%), by Types 2025 & 2033
- Figure 47: Middle East & Africa Automotive Load Floor Revenue (million), by Country 2025 & 2033
- Figure 48: Middle East & Africa Automotive Load Floor Volume (K), by Country 2025 & 2033
- Figure 49: Middle East & Africa Automotive Load Floor Revenue Share (%), by Country 2025 & 2033
- Figure 50: Middle East & Africa Automotive Load Floor Volume Share (%), by Country 2025 & 2033
- Figure 51: Asia Pacific Automotive Load Floor Revenue (million), by Application 2025 & 2033
- Figure 52: Asia Pacific Automotive Load Floor Volume (K), by Application 2025 & 2033
- Figure 53: Asia Pacific Automotive Load Floor Revenue Share (%), by Application 2025 & 2033
- Figure 54: Asia Pacific Automotive Load Floor Volume Share (%), by Application 2025 & 2033
- Figure 55: Asia Pacific Automotive Load Floor Revenue (million), by Types 2025 & 2033
- Figure 56: Asia Pacific Automotive Load Floor Volume (K), by Types 2025 & 2033
- Figure 57: Asia Pacific Automotive Load Floor Revenue Share (%), by Types 2025 & 2033
- Figure 58: Asia Pacific Automotive Load Floor Volume Share (%), by Types 2025 & 2033
- Figure 59: Asia Pacific Automotive Load Floor Revenue (million), by Country 2025 & 2033
- Figure 60: Asia Pacific Automotive Load Floor Volume (K), by Country 2025 & 2033
- Figure 61: Asia Pacific Automotive Load Floor Revenue Share (%), by Country 2025 & 2033
- Figure 62: Asia Pacific Automotive Load Floor Volume Share (%), by Country 2025 & 2033
List of Tables
- Table 1: Global Automotive Load Floor Revenue million Forecast, by Application 2020 & 2033
- Table 2: Global Automotive Load Floor Volume K Forecast, by Application 2020 & 2033
- Table 3: Global Automotive Load Floor Revenue million Forecast, by Types 2020 & 2033
- Table 4: Global Automotive Load Floor Volume K Forecast, by Types 2020 & 2033
- Table 5: Global Automotive Load Floor Revenue million Forecast, by Region 2020 & 2033
- Table 6: Global Automotive Load Floor Volume K Forecast, by Region 2020 & 2033
- Table 7: Global Automotive Load Floor Revenue million Forecast, by Application 2020 & 2033
- Table 8: Global Automotive Load Floor Volume K Forecast, by Application 2020 & 2033
- Table 9: Global Automotive Load Floor Revenue million Forecast, by Types 2020 & 2033
- Table 10: Global Automotive Load Floor Volume K Forecast, by Types 2020 & 2033
- Table 11: Global Automotive Load Floor Revenue million Forecast, by Country 2020 & 2033
- Table 12: Global Automotive Load Floor Volume K Forecast, by Country 2020 & 2033
- Table 13: United States Automotive Load Floor Revenue (million) Forecast, by Application 2020 & 2033
- Table 14: United States Automotive Load Floor Volume (K) Forecast, by Application 2020 & 2033
- Table 15: Canada Automotive Load Floor Revenue (million) Forecast, by Application 2020 & 2033
- Table 16: Canada Automotive Load Floor Volume (K) Forecast, by Application 2020 & 2033
- Table 17: Mexico Automotive Load Floor Revenue (million) Forecast, by Application 2020 & 2033
- Table 18: Mexico Automotive Load Floor Volume (K) Forecast, by Application 2020 & 2033
- Table 19: Global Automotive Load Floor Revenue million Forecast, by Application 2020 & 2033
- Table 20: Global Automotive Load Floor Volume K Forecast, by Application 2020 & 2033
- Table 21: Global Automotive Load Floor Revenue million Forecast, by Types 2020 & 2033
- Table 22: Global Automotive Load Floor Volume K Forecast, by Types 2020 & 2033
- Table 23: Global Automotive Load Floor Revenue million Forecast, by Country 2020 & 2033
- Table 24: Global Automotive Load Floor Volume K Forecast, by Country 2020 & 2033
- Table 25: Brazil Automotive Load Floor Revenue (million) Forecast, by Application 2020 & 2033
- Table 26: Brazil Automotive Load Floor Volume (K) Forecast, by Application 2020 & 2033
- Table 27: Argentina Automotive Load Floor Revenue (million) Forecast, by Application 2020 & 2033
- Table 28: Argentina Automotive Load Floor Volume (K) Forecast, by Application 2020 & 2033
- Table 29: Rest of South America Automotive Load Floor Revenue (million) Forecast, by Application 2020 & 2033
- Table 30: Rest of South America Automotive Load Floor Volume (K) Forecast, by Application 2020 & 2033
- Table 31: Global Automotive Load Floor Revenue million Forecast, by Application 2020 & 2033
- Table 32: Global Automotive Load Floor Volume K Forecast, by Application 2020 & 2033
- Table 33: Global Automotive Load Floor Revenue million Forecast, by Types 2020 & 2033
- Table 34: Global Automotive Load Floor Volume K Forecast, by Types 2020 & 2033
- Table 35: Global Automotive Load Floor Revenue million Forecast, by Country 2020 & 2033
- Table 36: Global Automotive Load Floor Volume K Forecast, by Country 2020 & 2033
- Table 37: United Kingdom Automotive Load Floor Revenue (million) Forecast, by Application 2020 & 2033
- Table 38: United Kingdom Automotive Load Floor Volume (K) Forecast, by Application 2020 & 2033
- Table 39: Germany Automotive Load Floor Revenue (million) Forecast, by Application 2020 & 2033
- Table 40: Germany Automotive Load Floor Volume (K) Forecast, by Application 2020 & 2033
- Table 41: France Automotive Load Floor Revenue (million) Forecast, by Application 2020 & 2033
- Table 42: France Automotive Load Floor Volume (K) Forecast, by Application 2020 & 2033
- Table 43: Italy Automotive Load Floor Revenue (million) Forecast, by Application 2020 & 2033
- Table 44: Italy Automotive Load Floor Volume (K) Forecast, by Application 2020 & 2033
- Table 45: Spain Automotive Load Floor Revenue (million) Forecast, by Application 2020 & 2033
- Table 46: Spain Automotive Load Floor Volume (K) Forecast, by Application 2020 & 2033
- Table 47: Russia Automotive Load Floor Revenue (million) Forecast, by Application 2020 & 2033
- Table 48: Russia Automotive Load Floor Volume (K) Forecast, by Application 2020 & 2033
- Table 49: Benelux Automotive Load Floor Revenue (million) Forecast, by Application 2020 & 2033
- Table 50: Benelux Automotive Load Floor Volume (K) Forecast, by Application 2020 & 2033
- Table 51: Nordics Automotive Load Floor Revenue (million) Forecast, by Application 2020 & 2033
- Table 52: Nordics Automotive Load Floor Volume (K) Forecast, by Application 2020 & 2033
- Table 53: Rest of Europe Automotive Load Floor Revenue (million) Forecast, by Application 2020 & 2033
- Table 54: Rest of Europe Automotive Load Floor Volume (K) Forecast, by Application 2020 & 2033
- Table 55: Global Automotive Load Floor Revenue million Forecast, by Application 2020 & 2033
- Table 56: Global Automotive Load Floor Volume K Forecast, by Application 2020 & 2033
- Table 57: Global Automotive Load Floor Revenue million Forecast, by Types 2020 & 2033
- Table 58: Global Automotive Load Floor Volume K Forecast, by Types 2020 & 2033
- Table 59: Global Automotive Load Floor Revenue million Forecast, by Country 2020 & 2033
- Table 60: Global Automotive Load Floor Volume K Forecast, by Country 2020 & 2033
- Table 61: Turkey Automotive Load Floor Revenue (million) Forecast, by Application 2020 & 2033
- Table 62: Turkey Automotive Load Floor Volume (K) Forecast, by Application 2020 & 2033
- Table 63: Israel Automotive Load Floor Revenue (million) Forecast, by Application 2020 & 2033
- Table 64: Israel Automotive Load Floor Volume (K) Forecast, by Application 2020 & 2033
- Table 65: GCC Automotive Load Floor Revenue (million) Forecast, by Application 2020 & 2033
- Table 66: GCC Automotive Load Floor Volume (K) Forecast, by Application 2020 & 2033
- Table 67: North Africa Automotive Load Floor Revenue (million) Forecast, by Application 2020 & 2033
- Table 68: North Africa Automotive Load Floor Volume (K) Forecast, by Application 2020 & 2033
- Table 69: South Africa Automotive Load Floor Revenue (million) Forecast, by Application 2020 & 2033
- Table 70: South Africa Automotive Load Floor Volume (K) Forecast, by Application 2020 & 2033
- Table 71: Rest of Middle East & Africa Automotive Load Floor Revenue (million) Forecast, by Application 2020 & 2033
- Table 72: Rest of Middle East & Africa Automotive Load Floor Volume (K) Forecast, by Application 2020 & 2033
- Table 73: Global Automotive Load Floor Revenue million Forecast, by Application 2020 & 2033
- Table 74: Global Automotive Load Floor Volume K Forecast, by Application 2020 & 2033
- Table 75: Global Automotive Load Floor Revenue million Forecast, by Types 2020 & 2033
- Table 76: Global Automotive Load Floor Volume K Forecast, by Types 2020 & 2033
- Table 77: Global Automotive Load Floor Revenue million Forecast, by Country 2020 & 2033
- Table 78: Global Automotive Load Floor Volume K Forecast, by Country 2020 & 2033
- Table 79: China Automotive Load Floor Revenue (million) Forecast, by Application 2020 & 2033
- Table 80: China Automotive Load Floor Volume (K) Forecast, by Application 2020 & 2033
- Table 81: India Automotive Load Floor Revenue (million) Forecast, by Application 2020 & 2033
- Table 82: India Automotive Load Floor Volume (K) Forecast, by Application 2020 & 2033
- Table 83: Japan Automotive Load Floor Revenue (million) Forecast, by Application 2020 & 2033
- Table 84: Japan Automotive Load Floor Volume (K) Forecast, by Application 2020 & 2033
- Table 85: South Korea Automotive Load Floor Revenue (million) Forecast, by Application 2020 & 2033
- Table 86: South Korea Automotive Load Floor Volume (K) Forecast, by Application 2020 & 2033
- Table 87: ASEAN Automotive Load Floor Revenue (million) Forecast, by Application 2020 & 2033
- Table 88: ASEAN Automotive Load Floor Volume (K) Forecast, by Application 2020 & 2033
- Table 89: Oceania Automotive Load Floor Revenue (million) Forecast, by Application 2020 & 2033
- Table 90: Oceania Automotive Load Floor Volume (K) Forecast, by Application 2020 & 2033
- Table 91: Rest of Asia Pacific Automotive Load Floor Revenue (million) Forecast, by Application 2020 & 2033
- Table 92: Rest of Asia Pacific Automotive Load Floor Volume (K) Forecast, by Application 2020 & 2033
Frequently Asked Questions
1. What is the projected Compound Annual Growth Rate (CAGR) of the Automotive Load Floor?
The projected CAGR is approximately 5.1%.
2. Which companies are prominent players in the Automotive Load Floor?
Key companies in the market include DS Smith, Nagase America, IDEAL Automotive GmbH, Huntsman International, CIE Automotive, SA Automotive, Gemini Group, ABC Technologies, Woodbridge.
3. What are the main segments of the Automotive Load Floor?
The market segments include Application, Types.
4. Can you provide details about the market size?
The market size is estimated to be USD 300.9 million as of 2022.
5. What are some drivers contributing to market growth?
N/A
6. What are the notable trends driving market growth?
N/A
7. Are there any restraints impacting market growth?
N/A
8. Can you provide examples of recent developments in the market?
N/A
9. What pricing options are available for accessing the report?
Pricing options include single-user, multi-user, and enterprise licenses priced at USD 3350.00, USD 5025.00, and USD 6700.00 respectively.
10. Is the market size provided in terms of value or volume?
The market size is provided in terms of value, measured in million and volume, measured in K.
11. Are there any specific market keywords associated with the report?
Yes, the market keyword associated with the report is "Automotive Load Floor," which aids in identifying and referencing the specific market segment covered.
12. How do I determine which pricing option suits my needs best?
The pricing options vary based on user requirements and access needs. Individual users may opt for single-user licenses, while businesses requiring broader access may choose multi-user or enterprise licenses for cost-effective access to the report.
13. Are there any additional resources or data provided in the Automotive Load Floor report?
While the report offers comprehensive insights, it's advisable to review the specific contents or supplementary materials provided to ascertain if additional resources or data are available.
14. How can I stay updated on further developments or reports in the Automotive Load Floor?
To stay informed about further developments, trends, and reports in the Automotive Load Floor, consider subscribing to industry newsletters, following relevant companies and organizations, or regularly checking reputable industry news sources and publications.
Methodology
Step 1 - Identification of Relevant Samples Size from Population Database


Step 2 - Approaches for Defining Global Market Size (Value, Volume* & Price*)

Note*: In applicable scenarios
Step 3 - Data Sources
Primary Research
- Web Analytics
- Survey Reports
- Research Institute
- Latest Research Reports
- Opinion Leaders
Secondary Research
- Annual Reports
- White Paper
- Latest Press Release
- Industry Association
- Paid Database
- Investor Presentations

Step 4 - Data Triangulation
Involves using different sources of information in order to increase the validity of a study
These sources are likely to be stakeholders in a program - participants, other researchers, program staff, other community members, and so on.
Then we put all data in single framework & apply various statistical tools to find out the dynamic on the market.
During the analysis stage, feedback from the stakeholder groups would be compared to determine areas of agreement as well as areas of divergence