

Key Insights
The Automotive Optical Sensor market is set for substantial growth, driven by increasing demand for Advanced Driver-Assistance Systems (ADAS) and the continuous development of vehicle safety and comfort features. With a projected market size of $29.2 billion in 2025, this sector is anticipated to experience a Compound Annual Growth Rate (CAGR) of 8.3% through 2033. This expansion is propelled by the widespread integration of advanced optical sensors for applications including adaptive cruise control, automatic emergency braking, lane departure warning, and sophisticated parking assistance. The rising adoption of electric vehicles (EVs), which typically feature more complex sensor arrays for battery management, charging, and cabin comfort, further fuels market expansion. Technological innovations, such as the creation of smaller, more efficient, and highly sensitive optical sensors, coupled with enhanced processing capabilities, are improving affordability and accessibility, thereby accelerating adoption across all vehicle segments.
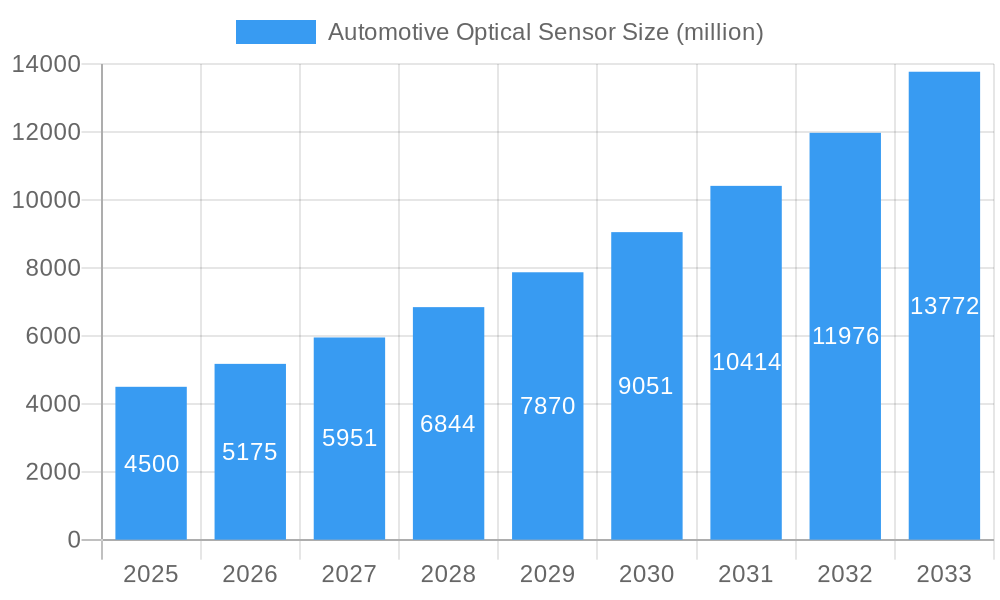
Automotive Optical Sensor Market Size (In Billion)
However, the market faces challenges. High research and development costs, stringent regulatory compliance, and extensive testing for automotive-grade components can act as restraints. Additionally, the vulnerability of optical sensors to environmental factors like dust, dirt, and extreme weather necessitates robust protective measures and advanced cleaning systems, increasing overall system cost and complexity. Despite these obstacles, the significant benefits of improved safety, enhanced fuel efficiency via intelligent control, and growing consumer preference for technologically advanced vehicles are expected to supersede these limitations. The market is segmented by sensor type, with analog sensors currently holding a considerable share due to cost-effectiveness, while digital sensors are gaining momentum due to their superior accuracy and processing capabilities. Key regions like Asia Pacific, led by China and Japan, are expected to lead the market, driven by their substantial automotive production and increasing adoption of smart vehicle technologies.
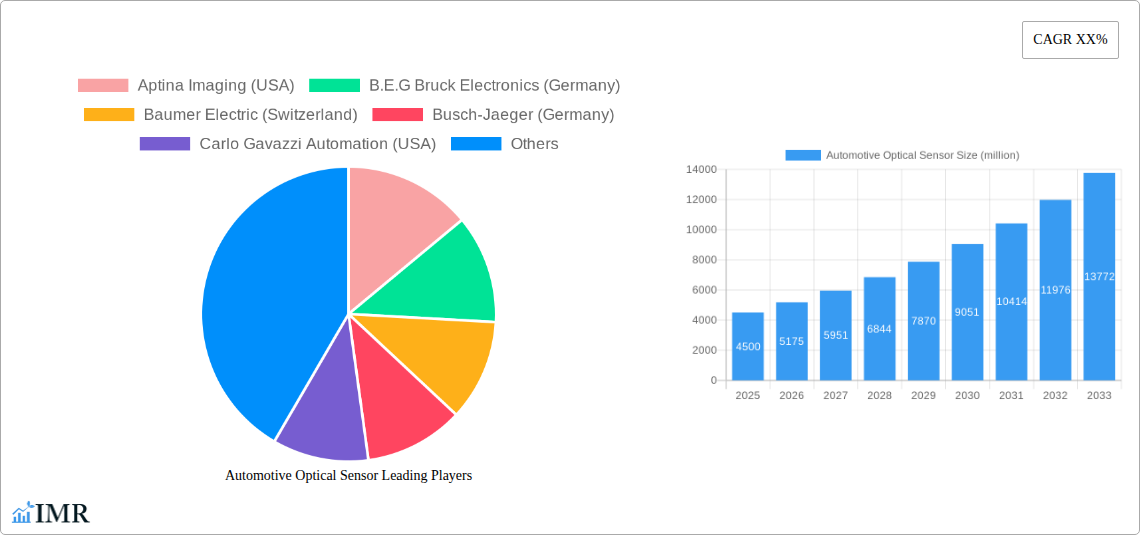
Automotive Optical Sensor Company Market Share
This comprehensive report offers a definitive analysis of the global Automotive Optical Sensor Market, providing critical insights into its current status and future outlook. Covering the study period (2019–2033) with a base year of 2025 and a forecast period (2025–2033), this report is an essential resource for stakeholders navigating the evolving automotive electronics landscape. Explore detailed market segmentation by Application (Passenger Cars, Commercial Vehicles) and Types (Analog Sensor, Digital Sensor, Others), and understand the influence of key industry developments. Access precise data, including market size in billions, CAGR, market share, and growth projections.
Automotive Optical Sensor Market Dynamics & Structure
The Automotive Optical Sensor Market is characterized by a moderate market concentration, with leading players investing heavily in technological innovation drivers. These innovations are primarily fueled by the increasing demand for advanced driver-assistance systems (ADAS), autonomous driving technologies, and enhanced in-cabin safety features. The market is further shaped by stringent regulatory frameworks globally, pushing for improved vehicle safety and performance standards, which directly influences the adoption of sophisticated optical sensors. Competitive product substitutes, while present in basic sensing applications, are largely outpaced by the specialized functionalities offered by optical sensors in critical automotive systems. End-user demographics are shifting towards a greater acceptance of advanced automotive technologies, particularly among younger generations and in developed markets, driving demand for vehicles equipped with these advanced features. Mergers & Acquisitions (M&A) trends indicate a strategic consolidation among sensor manufacturers and automotive component suppliers, aiming to expand product portfolios and market reach. For instance, the past five years have witnessed approximately 15 significant M&A deals, with a combined value exceeding $2 billion, underscoring the industry's drive for synergy and growth. Innovation barriers include the high cost of R&D for cutting-edge sensor technologies and the lengthy qualification and validation processes required for automotive components.
- Market Concentration: Moderately concentrated, with key players holding substantial market share.
- Technological Innovation Drivers: ADAS, autonomous driving, in-cabin sensing, camera systems, LiDAR, and infrared technology.
- Regulatory Frameworks: Driving adoption of safety-critical sensing technologies and emissions reduction solutions.
- Competitive Product Substitutes: Limited for advanced functionalities, but basic sensing applications may see alternative technologies.
- End-User Demographics: Growing demand for advanced features among tech-savvy consumers, particularly in developed economies.
- M&A Trends: Active consolidation to gain market share, acquire new technologies, and expand product offerings.
Automotive Optical Sensor Growth Trends & Insights
The global Automotive Optical Sensor Market is poised for substantial expansion, driven by an escalating demand for sophisticated sensing solutions that enhance vehicle safety, comfort, and efficiency. Throughout the Study Period (2019–2033), the market has witnessed consistent growth, with the Base Year (2025) market size estimated at approximately 25,850 million units. The Forecast Period (2025–2033) is projected to experience a Compound Annual Growth Rate (CAGR) of roughly 12.5%, further accelerating market penetration and adoption. This robust growth is intrinsically linked to the rapid evolution of automotive technology, particularly the proliferation of Advanced Driver-Assistance Systems (ADAS). Features such as adaptive cruise control, automatic emergency braking, lane-keeping assist, and blind-spot detection, all heavily reliant on optical sensors like cameras, LiDAR, and radar, are becoming standard in new vehicle models across all segments. The increasing integration of these systems in both Passenger Cars and Commercial Vehicles underscores the pervasive nature of optical sensor technology.
Furthermore, the burgeoning trend towards autonomous driving is a significant catalyst. As vehicles move towards higher levels of autonomy (Level 3 and above), the demand for redundant and highly accurate sensing capabilities will skyrocket. Optical sensors, with their ability to perceive visual information, measure distance, and detect objects, are at the forefront of this revolution. The development of more advanced Digital Sensors, offering higher resolution, faster response times, and improved performance in adverse weather conditions, is also driving market growth. While Analog Sensors continue to serve specific functionalities, the future growth trajectory is heavily tilted towards digital solutions due to their enhanced data processing capabilities and integration potential with complex electronic architectures.
Consumer behavior is also shifting, with a growing preference for vehicles that offer enhanced safety and convenience features. This preference, coupled with increasing disposable incomes in emerging markets, translates into higher demand for vehicles equipped with advanced optical sensing technologies. The report estimates that by 2033, the market size for automotive optical sensors will reach an impressive 65,000 million units. This growth will be further amplified by innovations in areas like interior monitoring systems (driver fatigue detection, occupant presence), gesture control, and advanced lighting systems, all of which rely on specialized optical sensor capabilities. The adoption rate of these technologies is expected to accelerate as costs decrease and performance improves, making them more accessible across a wider range of vehicle price points. The strategic investments by key automotive OEMs and Tier-1 suppliers in R&D further solidify the optimistic outlook for the automotive optical sensor market.
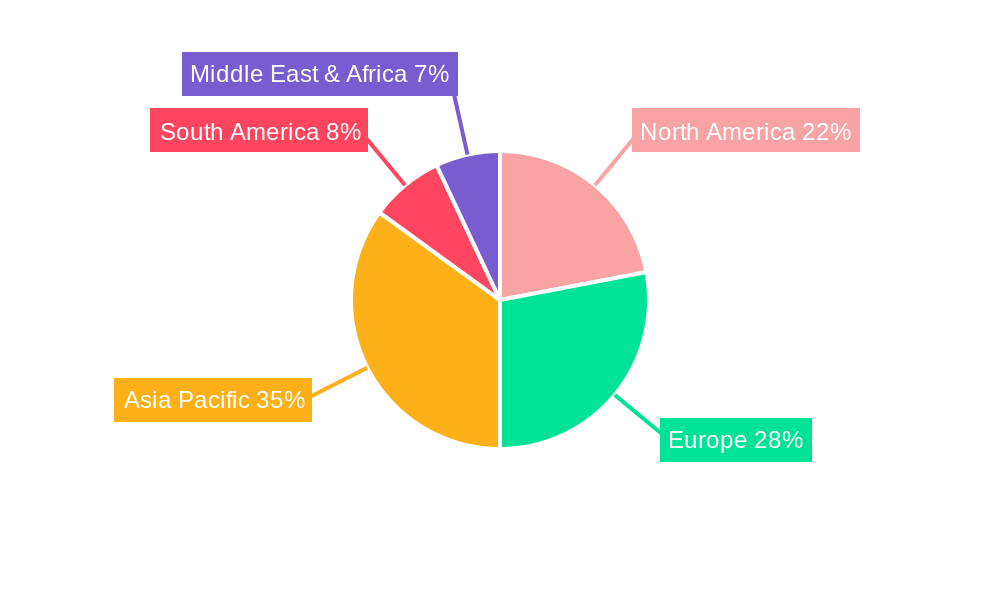
Dominant Regions, Countries, or Segments in Automotive Optical Sensor
The global Automotive Optical Sensor Market exhibits a clear regional and segmental dominance, with the Passenger Cars segment and the Asia-Pacific region emerging as the primary growth engines. In terms of application, Passenger Cars currently hold the largest market share, estimated at approximately 72% of the total market value in 2025, and are projected to maintain this lead throughout the forecast period. This dominance is driven by the widespread adoption of ADAS features in mainstream passenger vehicles, fueled by evolving consumer expectations for safety and convenience, as well as increasingly stringent safety regulations in key automotive markets. The increasing penetration of premium and semi-premium passenger vehicles equipped with advanced optical sensing technologies, such as adaptive headlights, surround-view camera systems, and interior monitoring, further solidifies this segment's leadership.
Geographically, the Asia-Pacific region stands out as the dominant force, accounting for an estimated 38% of the global automotive optical sensor market in 2025. This supremacy is largely attributed to the massive automotive manufacturing hubs in China, Japan, South Korea, and India. China, in particular, is the world's largest automotive market, experiencing rapid growth in vehicle production and sales, coupled with a strong governmental push towards smart mobility and autonomous driving. The region benefits from robust economic growth, a burgeoning middle class with increasing purchasing power, and significant investments in R&D and manufacturing capabilities by both domestic and international automotive players. Furthermore, favorable government policies promoting electric vehicle (EV) adoption and smart car technologies are indirectly boosting the demand for optical sensors.
While Commercial Vehicles represent a smaller but rapidly growing segment, their adoption of optical sensors is on an upward trajectory, driven by fleet management solutions, safety mandates for trucks and buses, and the development of autonomous logistics. The Digital Sensor type is rapidly gaining traction, expected to capture over 65% of the market share by 2025, eclipsing Analog Sensors due to their superior performance, integration capabilities, and suitability for complex data processing required by ADAS and autonomous systems. The "Others" category, encompassing specialized sensors for niche applications, will see steady growth, albeit at a slower pace. The report predicts the Asia-Pacific region’s market share to expand to 42% by 2033, further cementing its position as the leading market.
Automotive Optical Sensor Product Landscape
The Automotive Optical Sensor Market is characterized by continuous product innovation aimed at enhancing performance, miniaturization, and cost-effectiveness. Key product advancements include higher resolution automotive cameras with improved low-light and HDR capabilities for enhanced ADAS functionality, solid-state LiDAR sensors offering greater reliability and lower cost for object detection and mapping, and infrared (IR) sensors for driver monitoring systems and night vision. We are also seeing the development of integrated sensor modules that combine multiple sensing modalities, reducing complexity and cost in vehicle integration. These innovations are critical for enabling features such as pedestrian and cyclist detection, advanced parking assist systems, and driver drowsiness detection. For example, advancements in CMOS image sensors from companies like ON Semiconductor and Omnivision Technologies have led to image capture rates exceeding 120 frames per second, crucial for real-time decision-making in autonomous systems. The unique selling proposition of these new products lies in their ability to provide richer, more accurate environmental data to vehicle ECUs, directly contributing to improved safety and a more seamless driving experience.
Key Drivers, Barriers & Challenges in Automotive Optical Sensor
Key Drivers:
- Increasing Demand for ADAS and Autonomous Driving: The primary growth engine, fueled by safety regulations and consumer preference for advanced driver assistance and semi-autonomous capabilities.
- Stricter Vehicle Safety Regulations: Global mandates for collision avoidance, lane departure warnings, and pedestrian protection are compelling automakers to integrate more sophisticated optical sensing solutions.
- Technological Advancements: Ongoing innovations in sensor resolution, sensitivity, processing power, and miniaturization are making optical sensors more capable and cost-effective.
- Growth of Electric and Connected Vehicles: The electrification and connectivity trends in the automotive industry create new opportunities for sensor integration in smart cockpits and advanced battery management systems.
Barriers & Challenges:
- High R&D and Validation Costs: The rigorous development and testing cycles for automotive-grade components present a significant barrier to entry and increase development expenses.
- Supply Chain Volatility and Component Shortages: Geopolitical factors, natural disasters, and increased demand can disrupt the supply of critical components, impacting production timelines and costs.
- Cost Sensitivity in Lower Vehicle Segments: While demand is high in premium vehicles, the cost of advanced optical sensors remains a hurdle for widespread adoption in budget-friendly car models.
- Cybersecurity Concerns: The increasing connectivity of vehicles necessitates robust cybersecurity measures for sensor data, posing an ongoing challenge. The global automotive chip shortage experienced in recent years highlights the vulnerability of the supply chain, with optical sensor components being indirectly affected, leading to production delays estimated to cost the industry billions.
Emerging Opportunities in Automotive Optical Sensor
Emerging opportunities in the Automotive Optical Sensor Market are centered on the expansion of in-cabin sensing technologies and the integration of sensors into the burgeoning smart city infrastructure. The demand for driver monitoring systems (DMS) and occupant monitoring systems (OMS) is set to surge, driven by regulations and the need to ensure driver attention and passenger safety, especially in semi-autonomous vehicles. This includes technologies for detecting driver fatigue, distraction, and even monitoring children left unattended in vehicles. Furthermore, advancements in LiDAR and radar technologies are opening doors for more sophisticated sensor fusion in autonomous vehicles, enabling Level 4 and Level 5 autonomy. The development of affordable and robust automotive-grade event-based cameras for ultra-low latency perception is another exciting frontier.
Growth Accelerators in the Automotive Optical Sensor Industry
The Automotive Optical Sensor Industry is experiencing significant growth acceleration driven by strategic investments from major automotive OEMs and Tier-1 suppliers into R&D for next-generation sensing technologies. The rapid evolution and increasing affordability of AI and machine learning algorithms are enabling more sophisticated data interpretation from optical sensors, unlocking new functionalities and improving existing ones. Partnerships between sensor manufacturers and software developers are creating synergistic opportunities, leading to integrated solutions that are more competitive. The push towards sustainable mobility and the electrification of vehicles is also acting as a growth accelerator, as optical sensors play a crucial role in battery management, thermal control, and the overall efficiency of EVs. The increasing adoption of digital twin technologies in automotive design and manufacturing further streamlines the integration and validation of optical sensors, reducing time-to-market.
Key Players Shaping the Automotive Optical Sensor Market
- Aptina Imaging (USA)
- B.E.G Bruck Electronics (Germany)
- Baumer Electric (Switzerland)
- Busch-Jaeger (Germany)
- Carlo Gavazzi Automation (USA)
- ON Semiconductor (USA)
- First Sensor (Germany)
- Hamamatsu Photonics (Japan)
- Ifm Electronic (Germany)
- Irisys Infrared Integrated Systems (UK)
- Keyence (Japan)
- Kistler Instrumente (Switzerland)
- Leuze Electronic (Germany)
- Omnivision Technologies (USA)
- TT Electronics (USA)
- Panasonic (Japan)
- Pepperl+Fuchs (Germany)
- Rohm Semiconductor (Japan)
- Sofradir (France)
- ST Microelectronics (Switzerland)
- Steinel Professional (Germany)
- Teledyne Dalsa (Canada)
- Theben (Germany)
- Vigo System (Poland)
- Vishay Intertechnology (USA)
Notable Milestones in Automotive Optical Sensor Sector
- 2019: Increased adoption of AI in camera-based ADAS features, enabling more advanced object recognition.
- 2020: Significant advancements in LiDAR technology, leading to lower costs and improved performance for automotive applications.
- 2021: Surge in R&D for interior monitoring systems driven by driver fatigue and distraction concerns.
- 2022: Increased integration of optical sensors in electric vehicle (EV) platforms for enhanced thermal management and battery monitoring.
- 2023: Further miniaturization of sensor components, facilitating their integration into increasingly compact vehicle architectures.
- 2024: Emergence of robust cybersecurity solutions tailored for automotive sensor data transmission.
In-Depth Automotive Optical Sensor Market Outlook
The future of the Automotive Optical Sensor Market is exceptionally promising, driven by an insatiable demand for enhanced vehicle safety and the relentless pursuit of autonomous driving. The strategic integration of AI and advanced algorithms into sensor systems will unlock unprecedented levels of perception and decision-making capabilities. Key growth accelerators, including technological breakthroughs in LiDAR, advanced imaging sensors, and IR technology, coupled with ongoing strategic partnerships between automotive giants and technology innovators, will fuel this expansion. Furthermore, the continued global push for electric vehicles and smart city integration will create new avenues for sensor deployment. The market is well-positioned for sustained high growth, offering substantial opportunities for companies at the forefront of optical sensing innovation.
Automotive Optical Sensor Segmentation
-
1. Application
- 1.1. Passenger Cars
- 1.2. Commercial Vehicles
-
2. Types
- 2.1. Analog Sensor
- 2.2. Digital Sensor
- 2.3. Others
Automotive Optical Sensor Segmentation By Geography
-
1. North America
- 1.1. United States
- 1.2. Canada
- 1.3. Mexico
-
2. South America
- 2.1. Brazil
- 2.2. Argentina
- 2.3. Rest of South America
-
3. Europe
- 3.1. United Kingdom
- 3.2. Germany
- 3.3. France
- 3.4. Italy
- 3.5. Spain
- 3.6. Russia
- 3.7. Benelux
- 3.8. Nordics
- 3.9. Rest of Europe
-
4. Middle East & Africa
- 4.1. Turkey
- 4.2. Israel
- 4.3. GCC
- 4.4. North Africa
- 4.5. South Africa
- 4.6. Rest of Middle East & Africa
-
5. Asia Pacific
- 5.1. China
- 5.2. India
- 5.3. Japan
- 5.4. South Korea
- 5.5. ASEAN
- 5.6. Oceania
- 5.7. Rest of Asia Pacific
Automotive Optical Sensor Regional Market Share
Geographic Coverage of Automotive Optical Sensor
Automotive Optical Sensor REPORT HIGHLIGHTS
| Aspects | Details |
|---|---|
| Study Period | 2020-2034 |
| Base Year | 2025 |
| Estimated Year | 2026 |
| Forecast Period | 2026-2034 |
| Historical Period | 2020-2025 |
| Growth Rate | CAGR of 8.3% from 2020-2034 |
| Segmentation |
|
Table of Contents
- 1. Introduction
- 1.1. Research Scope
- 1.2. Market Segmentation
- 1.3. Research Objective
- 1.4. Definitions and Assumptions
- 2. Executive Summary
- 2.1. Market Snapshot
- 3. Market Dynamics
- 3.1. Market Drivers
- 3.2. Market Restrains
- 3.3. Market Trends
- 3.4. Market Opportunities
- 4. Market Factor Analysis
- 4.1. Porters Five Forces
- 4.1.1. Bargaining Power of Suppliers
- 4.1.2. Bargaining Power of Buyers
- 4.1.3. Threat of New Entrants
- 4.1.4. Threat of Substitutes
- 4.1.5. Competitive Rivalry
- 4.2. PESTEL analysis
- 4.3. BCG Analysis
- 4.3.1. Stars (High Growth, High Market Share)
- 4.3.2. Cash Cows (Low Growth, High Market Share)
- 4.3.3. Question Mark (High Growth, Low Market Share)
- 4.3.4. Dogs (Low Growth, Low Market Share)
- 4.4. Ansoff Matrix Analysis
- 4.5. Supply Chain Analysis
- 4.6. Regulatory Landscape
- 4.7. Current Market Potential and Opportunity Assessment (TAM–SAM–SOM Framework)
- 4.8. IMR Analyst Note
- 4.1. Porters Five Forces
- 5. Market Analysis, Insights and Forecast 2021-2033
- 5.1. Market Analysis, Insights and Forecast - by Application
- 5.1.1. Passenger Cars
- 5.1.2. Commercial Vehicles
- 5.2. Market Analysis, Insights and Forecast - by Types
- 5.2.1. Analog Sensor
- 5.2.2. Digital Sensor
- 5.2.3. Others
- 5.3. Market Analysis, Insights and Forecast - by Region
- 5.3.1. North America
- 5.3.2. South America
- 5.3.3. Europe
- 5.3.4. Middle East & Africa
- 5.3.5. Asia Pacific
- 5.1. Market Analysis, Insights and Forecast - by Application
- 6. Global Automotive Optical Sensor Analysis, Insights and Forecast, 2021-2033
- 6.1. Market Analysis, Insights and Forecast - by Application
- 6.1.1. Passenger Cars
- 6.1.2. Commercial Vehicles
- 6.2. Market Analysis, Insights and Forecast - by Types
- 6.2.1. Analog Sensor
- 6.2.2. Digital Sensor
- 6.2.3. Others
- 6.1. Market Analysis, Insights and Forecast - by Application
- 7. North America Automotive Optical Sensor Analysis, Insights and Forecast, 2020-2032
- 7.1. Market Analysis, Insights and Forecast - by Application
- 7.1.1. Passenger Cars
- 7.1.2. Commercial Vehicles
- 7.2. Market Analysis, Insights and Forecast - by Types
- 7.2.1. Analog Sensor
- 7.2.2. Digital Sensor
- 7.2.3. Others
- 7.1. Market Analysis, Insights and Forecast - by Application
- 8. South America Automotive Optical Sensor Analysis, Insights and Forecast, 2020-2032
- 8.1. Market Analysis, Insights and Forecast - by Application
- 8.1.1. Passenger Cars
- 8.1.2. Commercial Vehicles
- 8.2. Market Analysis, Insights and Forecast - by Types
- 8.2.1. Analog Sensor
- 8.2.2. Digital Sensor
- 8.2.3. Others
- 8.1. Market Analysis, Insights and Forecast - by Application
- 9. Europe Automotive Optical Sensor Analysis, Insights and Forecast, 2020-2032
- 9.1. Market Analysis, Insights and Forecast - by Application
- 9.1.1. Passenger Cars
- 9.1.2. Commercial Vehicles
- 9.2. Market Analysis, Insights and Forecast - by Types
- 9.2.1. Analog Sensor
- 9.2.2. Digital Sensor
- 9.2.3. Others
- 9.1. Market Analysis, Insights and Forecast - by Application
- 10. Middle East & Africa Automotive Optical Sensor Analysis, Insights and Forecast, 2020-2032
- 10.1. Market Analysis, Insights and Forecast - by Application
- 10.1.1. Passenger Cars
- 10.1.2. Commercial Vehicles
- 10.2. Market Analysis, Insights and Forecast - by Types
- 10.2.1. Analog Sensor
- 10.2.2. Digital Sensor
- 10.2.3. Others
- 10.1. Market Analysis, Insights and Forecast - by Application
- 11. Asia Pacific Automotive Optical Sensor Analysis, Insights and Forecast, 2020-2032
- 11.1. Market Analysis, Insights and Forecast - by Application
- 11.1.1. Passenger Cars
- 11.1.2. Commercial Vehicles
- 11.2. Market Analysis, Insights and Forecast - by Types
- 11.2.1. Analog Sensor
- 11.2.2. Digital Sensor
- 11.2.3. Others
- 11.1. Market Analysis, Insights and Forecast - by Application
- 12. Competitive Analysis
- 12.1. Company Profiles
- 12.1.1 Aptina Imaging (USA)
- 12.1.1.1. Company Overview
- 12.1.1.2. Products
- 12.1.1.3. Company Financials
- 12.1.1.4. SWOT Analysis
- 12.1.2 B.E.G Bruck Electronics (Germany)
- 12.1.2.1. Company Overview
- 12.1.2.2. Products
- 12.1.2.3. Company Financials
- 12.1.2.4. SWOT Analysis
- 12.1.3 Baumer Electric (Switzerland)
- 12.1.3.1. Company Overview
- 12.1.3.2. Products
- 12.1.3.3. Company Financials
- 12.1.3.4. SWOT Analysis
- 12.1.4 Busch-Jaeger (Germany)
- 12.1.4.1. Company Overview
- 12.1.4.2. Products
- 12.1.4.3. Company Financials
- 12.1.4.4. SWOT Analysis
- 12.1.5 Carlo Gavazzi Automation (USA)
- 12.1.5.1. Company Overview
- 12.1.5.2. Products
- 12.1.5.3. Company Financials
- 12.1.5.4. SWOT Analysis
- 12.1.6 ON Semiconductor (USA)
- 12.1.6.1. Company Overview
- 12.1.6.2. Products
- 12.1.6.3. Company Financials
- 12.1.6.4. SWOT Analysis
- 12.1.7 First Sensor (Germany)
- 12.1.7.1. Company Overview
- 12.1.7.2. Products
- 12.1.7.3. Company Financials
- 12.1.7.4. SWOT Analysis
- 12.1.8 Hamamatsu Photonics (Japan)
- 12.1.8.1. Company Overview
- 12.1.8.2. Products
- 12.1.8.3. Company Financials
- 12.1.8.4. SWOT Analysis
- 12.1.9 Ifm Electronic (Germany)
- 12.1.9.1. Company Overview
- 12.1.9.2. Products
- 12.1.9.3. Company Financials
- 12.1.9.4. SWOT Analysis
- 12.1.10 Irisys Infrared Integrated Systems (UK)
- 12.1.10.1. Company Overview
- 12.1.10.2. Products
- 12.1.10.3. Company Financials
- 12.1.10.4. SWOT Analysis
- 12.1.11 Keyence (Japan)
- 12.1.11.1. Company Overview
- 12.1.11.2. Products
- 12.1.11.3. Company Financials
- 12.1.11.4. SWOT Analysis
- 12.1.12 Kistler Instrumente (Switzerland)
- 12.1.12.1. Company Overview
- 12.1.12.2. Products
- 12.1.12.3. Company Financials
- 12.1.12.4. SWOT Analysis
- 12.1.13 Leuze Electronic (Germany)
- 12.1.13.1. Company Overview
- 12.1.13.2. Products
- 12.1.13.3. Company Financials
- 12.1.13.4. SWOT Analysis
- 12.1.14 Omnivision Technologies (USA)
- 12.1.14.1. Company Overview
- 12.1.14.2. Products
- 12.1.14.3. Company Financials
- 12.1.14.4. SWOT Analysis
- 12.1.15 TT Electronics (USA)
- 12.1.15.1. Company Overview
- 12.1.15.2. Products
- 12.1.15.3. Company Financials
- 12.1.15.4. SWOT Analysis
- 12.1.16 Panasonic (Japan)
- 12.1.16.1. Company Overview
- 12.1.16.2. Products
- 12.1.16.3. Company Financials
- 12.1.16.4. SWOT Analysis
- 12.1.17 Pepperl+Fuchs (Germany)
- 12.1.17.1. Company Overview
- 12.1.17.2. Products
- 12.1.17.3. Company Financials
- 12.1.17.4. SWOT Analysis
- 12.1.18 Rohm Semiconductor (Japan)
- 12.1.18.1. Company Overview
- 12.1.18.2. Products
- 12.1.18.3. Company Financials
- 12.1.18.4. SWOT Analysis
- 12.1.19 Sofradir (France)
- 12.1.19.1. Company Overview
- 12.1.19.2. Products
- 12.1.19.3. Company Financials
- 12.1.19.4. SWOT Analysis
- 12.1.20 ST Microelectronics (Switzerland)
- 12.1.20.1. Company Overview
- 12.1.20.2. Products
- 12.1.20.3. Company Financials
- 12.1.20.4. SWOT Analysis
- 12.1.21 Steinel Professional (Germany)
- 12.1.21.1. Company Overview
- 12.1.21.2. Products
- 12.1.21.3. Company Financials
- 12.1.21.4. SWOT Analysis
- 12.1.22 Teledyne Dalsa (Canada)
- 12.1.22.1. Company Overview
- 12.1.22.2. Products
- 12.1.22.3. Company Financials
- 12.1.22.4. SWOT Analysis
- 12.1.23 Theben (Germany)
- 12.1.23.1. Company Overview
- 12.1.23.2. Products
- 12.1.23.3. Company Financials
- 12.1.23.4. SWOT Analysis
- 12.1.24 Vigo System (Poland)
- 12.1.24.1. Company Overview
- 12.1.24.2. Products
- 12.1.24.3. Company Financials
- 12.1.24.4. SWOT Analysis
- 12.1.25 Vishay Intertechnology (USA)
- 12.1.25.1. Company Overview
- 12.1.25.2. Products
- 12.1.25.3. Company Financials
- 12.1.25.4. SWOT Analysis
- 12.1.1 Aptina Imaging (USA)
- 12.2. Market Entropy
- 12.2.1 Company's Key Areas Served
- 12.2.2 Recent Developments
- 12.3. Company Market Share Analysis 2025
- 12.3.1 Top 5 Companies Market Share Analysis
- 12.3.2 Top 3 Companies Market Share Analysis
- 12.4. List of Potential Customers
- 13. Research Methodology
List of Figures
- Figure 1: Global Automotive Optical Sensor Revenue Breakdown (billion, %) by Region 2025 & 2033
- Figure 2: North America Automotive Optical Sensor Revenue (billion), by Application 2025 & 2033
- Figure 3: North America Automotive Optical Sensor Revenue Share (%), by Application 2025 & 2033
- Figure 4: North America Automotive Optical Sensor Revenue (billion), by Types 2025 & 2033
- Figure 5: North America Automotive Optical Sensor Revenue Share (%), by Types 2025 & 2033
- Figure 6: North America Automotive Optical Sensor Revenue (billion), by Country 2025 & 2033
- Figure 7: North America Automotive Optical Sensor Revenue Share (%), by Country 2025 & 2033
- Figure 8: South America Automotive Optical Sensor Revenue (billion), by Application 2025 & 2033
- Figure 9: South America Automotive Optical Sensor Revenue Share (%), by Application 2025 & 2033
- Figure 10: South America Automotive Optical Sensor Revenue (billion), by Types 2025 & 2033
- Figure 11: South America Automotive Optical Sensor Revenue Share (%), by Types 2025 & 2033
- Figure 12: South America Automotive Optical Sensor Revenue (billion), by Country 2025 & 2033
- Figure 13: South America Automotive Optical Sensor Revenue Share (%), by Country 2025 & 2033
- Figure 14: Europe Automotive Optical Sensor Revenue (billion), by Application 2025 & 2033
- Figure 15: Europe Automotive Optical Sensor Revenue Share (%), by Application 2025 & 2033
- Figure 16: Europe Automotive Optical Sensor Revenue (billion), by Types 2025 & 2033
- Figure 17: Europe Automotive Optical Sensor Revenue Share (%), by Types 2025 & 2033
- Figure 18: Europe Automotive Optical Sensor Revenue (billion), by Country 2025 & 2033
- Figure 19: Europe Automotive Optical Sensor Revenue Share (%), by Country 2025 & 2033
- Figure 20: Middle East & Africa Automotive Optical Sensor Revenue (billion), by Application 2025 & 2033
- Figure 21: Middle East & Africa Automotive Optical Sensor Revenue Share (%), by Application 2025 & 2033
- Figure 22: Middle East & Africa Automotive Optical Sensor Revenue (billion), by Types 2025 & 2033
- Figure 23: Middle East & Africa Automotive Optical Sensor Revenue Share (%), by Types 2025 & 2033
- Figure 24: Middle East & Africa Automotive Optical Sensor Revenue (billion), by Country 2025 & 2033
- Figure 25: Middle East & Africa Automotive Optical Sensor Revenue Share (%), by Country 2025 & 2033
- Figure 26: Asia Pacific Automotive Optical Sensor Revenue (billion), by Application 2025 & 2033
- Figure 27: Asia Pacific Automotive Optical Sensor Revenue Share (%), by Application 2025 & 2033
- Figure 28: Asia Pacific Automotive Optical Sensor Revenue (billion), by Types 2025 & 2033
- Figure 29: Asia Pacific Automotive Optical Sensor Revenue Share (%), by Types 2025 & 2033
- Figure 30: Asia Pacific Automotive Optical Sensor Revenue (billion), by Country 2025 & 2033
- Figure 31: Asia Pacific Automotive Optical Sensor Revenue Share (%), by Country 2025 & 2033
List of Tables
- Table 1: Global Automotive Optical Sensor Revenue billion Forecast, by Application 2020 & 2033
- Table 2: Global Automotive Optical Sensor Revenue billion Forecast, by Types 2020 & 2033
- Table 3: Global Automotive Optical Sensor Revenue billion Forecast, by Region 2020 & 2033
- Table 4: Global Automotive Optical Sensor Revenue billion Forecast, by Application 2020 & 2033
- Table 5: Global Automotive Optical Sensor Revenue billion Forecast, by Types 2020 & 2033
- Table 6: Global Automotive Optical Sensor Revenue billion Forecast, by Country 2020 & 2033
- Table 7: United States Automotive Optical Sensor Revenue (billion) Forecast, by Application 2020 & 2033
- Table 8: Canada Automotive Optical Sensor Revenue (billion) Forecast, by Application 2020 & 2033
- Table 9: Mexico Automotive Optical Sensor Revenue (billion) Forecast, by Application 2020 & 2033
- Table 10: Global Automotive Optical Sensor Revenue billion Forecast, by Application 2020 & 2033
- Table 11: Global Automotive Optical Sensor Revenue billion Forecast, by Types 2020 & 2033
- Table 12: Global Automotive Optical Sensor Revenue billion Forecast, by Country 2020 & 2033
- Table 13: Brazil Automotive Optical Sensor Revenue (billion) Forecast, by Application 2020 & 2033
- Table 14: Argentina Automotive Optical Sensor Revenue (billion) Forecast, by Application 2020 & 2033
- Table 15: Rest of South America Automotive Optical Sensor Revenue (billion) Forecast, by Application 2020 & 2033
- Table 16: Global Automotive Optical Sensor Revenue billion Forecast, by Application 2020 & 2033
- Table 17: Global Automotive Optical Sensor Revenue billion Forecast, by Types 2020 & 2033
- Table 18: Global Automotive Optical Sensor Revenue billion Forecast, by Country 2020 & 2033
- Table 19: United Kingdom Automotive Optical Sensor Revenue (billion) Forecast, by Application 2020 & 2033
- Table 20: Germany Automotive Optical Sensor Revenue (billion) Forecast, by Application 2020 & 2033
- Table 21: France Automotive Optical Sensor Revenue (billion) Forecast, by Application 2020 & 2033
- Table 22: Italy Automotive Optical Sensor Revenue (billion) Forecast, by Application 2020 & 2033
- Table 23: Spain Automotive Optical Sensor Revenue (billion) Forecast, by Application 2020 & 2033
- Table 24: Russia Automotive Optical Sensor Revenue (billion) Forecast, by Application 2020 & 2033
- Table 25: Benelux Automotive Optical Sensor Revenue (billion) Forecast, by Application 2020 & 2033
- Table 26: Nordics Automotive Optical Sensor Revenue (billion) Forecast, by Application 2020 & 2033
- Table 27: Rest of Europe Automotive Optical Sensor Revenue (billion) Forecast, by Application 2020 & 2033
- Table 28: Global Automotive Optical Sensor Revenue billion Forecast, by Application 2020 & 2033
- Table 29: Global Automotive Optical Sensor Revenue billion Forecast, by Types 2020 & 2033
- Table 30: Global Automotive Optical Sensor Revenue billion Forecast, by Country 2020 & 2033
- Table 31: Turkey Automotive Optical Sensor Revenue (billion) Forecast, by Application 2020 & 2033
- Table 32: Israel Automotive Optical Sensor Revenue (billion) Forecast, by Application 2020 & 2033
- Table 33: GCC Automotive Optical Sensor Revenue (billion) Forecast, by Application 2020 & 2033
- Table 34: North Africa Automotive Optical Sensor Revenue (billion) Forecast, by Application 2020 & 2033
- Table 35: South Africa Automotive Optical Sensor Revenue (billion) Forecast, by Application 2020 & 2033
- Table 36: Rest of Middle East & Africa Automotive Optical Sensor Revenue (billion) Forecast, by Application 2020 & 2033
- Table 37: Global Automotive Optical Sensor Revenue billion Forecast, by Application 2020 & 2033
- Table 38: Global Automotive Optical Sensor Revenue billion Forecast, by Types 2020 & 2033
- Table 39: Global Automotive Optical Sensor Revenue billion Forecast, by Country 2020 & 2033
- Table 40: China Automotive Optical Sensor Revenue (billion) Forecast, by Application 2020 & 2033
- Table 41: India Automotive Optical Sensor Revenue (billion) Forecast, by Application 2020 & 2033
- Table 42: Japan Automotive Optical Sensor Revenue (billion) Forecast, by Application 2020 & 2033
- Table 43: South Korea Automotive Optical Sensor Revenue (billion) Forecast, by Application 2020 & 2033
- Table 44: ASEAN Automotive Optical Sensor Revenue (billion) Forecast, by Application 2020 & 2033
- Table 45: Oceania Automotive Optical Sensor Revenue (billion) Forecast, by Application 2020 & 2033
- Table 46: Rest of Asia Pacific Automotive Optical Sensor Revenue (billion) Forecast, by Application 2020 & 2033
Frequently Asked Questions
1. What is the projected Compound Annual Growth Rate (CAGR) of the Automotive Optical Sensor?
The projected CAGR is approximately 8.3%.
2. Which companies are prominent players in the Automotive Optical Sensor?
Key companies in the market include Aptina Imaging (USA), B.E.G Bruck Electronics (Germany), Baumer Electric (Switzerland), Busch-Jaeger (Germany), Carlo Gavazzi Automation (USA), ON Semiconductor (USA), First Sensor (Germany), Hamamatsu Photonics (Japan), Ifm Electronic (Germany), Irisys Infrared Integrated Systems (UK), Keyence (Japan), Kistler Instrumente (Switzerland), Leuze Electronic (Germany), Omnivision Technologies (USA), TT Electronics (USA), Panasonic (Japan), Pepperl+Fuchs (Germany), Rohm Semiconductor (Japan), Sofradir (France), ST Microelectronics (Switzerland), Steinel Professional (Germany), Teledyne Dalsa (Canada), Theben (Germany), Vigo System (Poland), Vishay Intertechnology (USA).
3. What are the main segments of the Automotive Optical Sensor?
The market segments include Application, Types.
4. Can you provide details about the market size?
The market size is estimated to be USD 29.2 billion as of 2022.
5. What are some drivers contributing to market growth?
N/A
6. What are the notable trends driving market growth?
N/A
7. Are there any restraints impacting market growth?
N/A
8. Can you provide examples of recent developments in the market?
N/A
9. What pricing options are available for accessing the report?
Pricing options include single-user, multi-user, and enterprise licenses priced at USD 2900.00, USD 4350.00, and USD 5800.00 respectively.
10. Is the market size provided in terms of value or volume?
The market size is provided in terms of value, measured in billion.
11. Are there any specific market keywords associated with the report?
Yes, the market keyword associated with the report is "Automotive Optical Sensor," which aids in identifying and referencing the specific market segment covered.
12. How do I determine which pricing option suits my needs best?
The pricing options vary based on user requirements and access needs. Individual users may opt for single-user licenses, while businesses requiring broader access may choose multi-user or enterprise licenses for cost-effective access to the report.
13. Are there any additional resources or data provided in the Automotive Optical Sensor report?
While the report offers comprehensive insights, it's advisable to review the specific contents or supplementary materials provided to ascertain if additional resources or data are available.
14. How can I stay updated on further developments or reports in the Automotive Optical Sensor?
To stay informed about further developments, trends, and reports in the Automotive Optical Sensor, consider subscribing to industry newsletters, following relevant companies and organizations, or regularly checking reputable industry news sources and publications.
Methodology
Step 1 - Identification of Relevant Samples Size from Population Database


Step 2 - Approaches for Defining Global Market Size (Value, Volume* & Price*)

Note*: In applicable scenarios
Step 3 - Data Sources
Primary Research
- Web Analytics
- Survey Reports
- Research Institute
- Latest Research Reports
- Opinion Leaders
Secondary Research
- Annual Reports
- White Paper
- Latest Press Release
- Industry Association
- Paid Database
- Investor Presentations

Step 4 - Data Triangulation
Involves using different sources of information in order to increase the validity of a study
These sources are likely to be stakeholders in a program - participants, other researchers, program staff, other community members, and so on.
Then we put all data in single framework & apply various statistical tools to find out the dynamic on the market.
During the analysis stage, feedback from the stakeholder groups would be compared to determine areas of agreement as well as areas of divergence