

Key Insights
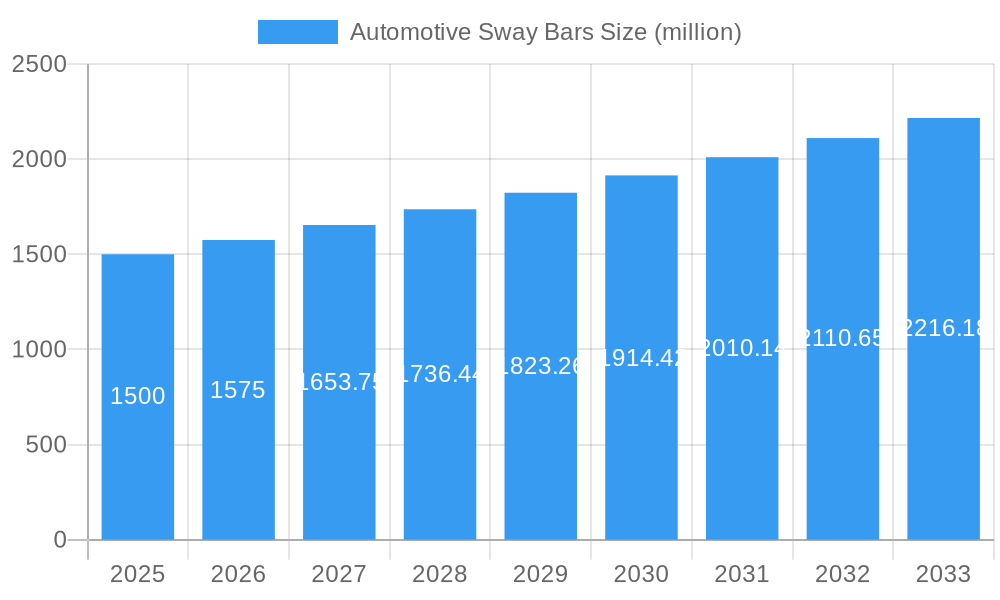
The automotive sway bar market is experiencing robust growth, driven by increasing demand for enhanced vehicle handling and stability, particularly in high-performance and luxury vehicles. The market's expansion is fueled by several factors, including the rising popularity of SUVs and crossovers, which often require improved stability due to their higher center of gravity. Technological advancements in sway bar materials, such as the adoption of lightweight yet high-strength alloys, contribute to improved performance and fuel efficiency. Furthermore, stricter vehicle safety regulations globally are pushing automakers to integrate advanced suspension systems, including sophisticated sway bars, to meet crash safety standards and enhance overall vehicle dynamics. We estimate the market size in 2025 to be approximately $1.5 billion, growing at a CAGR of 5% between 2025 and 2033.
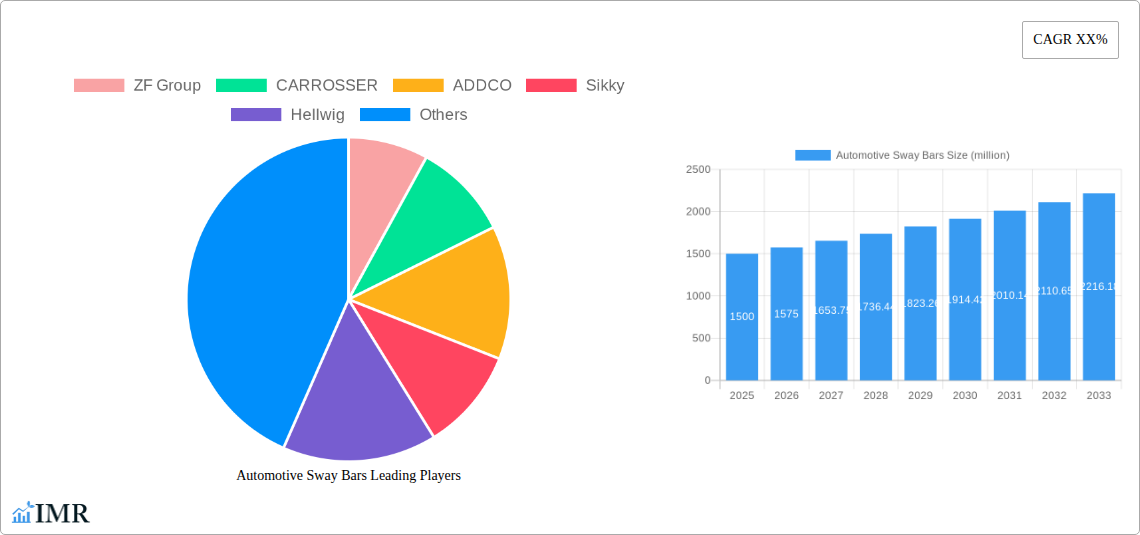
Automotive Sway Bars Market Size (In Billion)
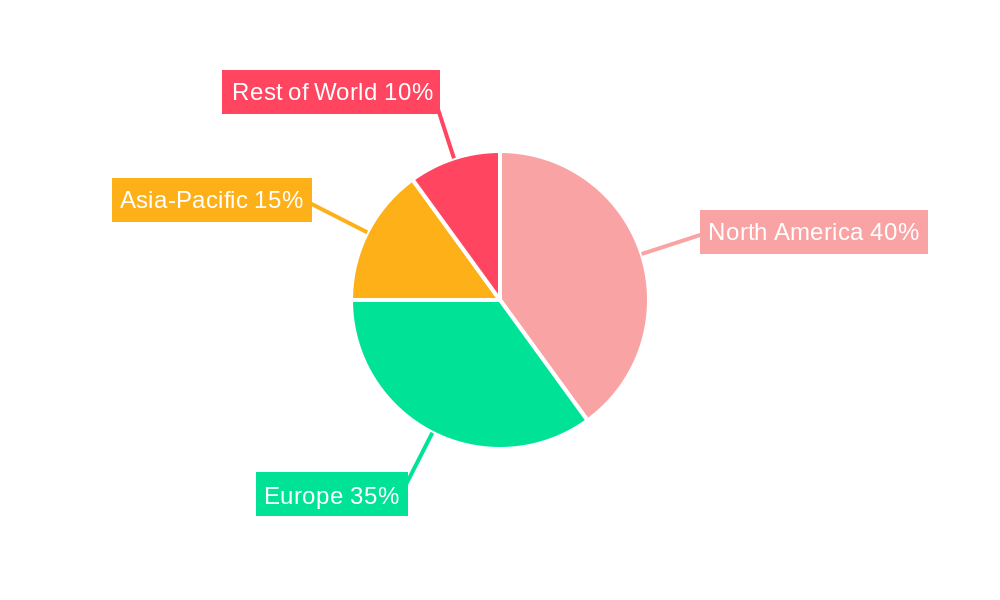
This growth is not uniform across all segments. The aftermarket segment is expected to witness comparatively higher growth than the OEM segment due to increasing consumer preference for customization and performance upgrades. Geographically, North America and Europe currently dominate the market, but emerging economies in Asia-Pacific are expected to contribute significantly to market expansion over the forecast period due to rising vehicle ownership and infrastructure development. However, potential restraints include fluctuating raw material prices (particularly steel and aluminum) and the impact of economic downturns on consumer spending for automotive aftermarket parts. Key players like ZF Group, CARROSSER, and others are focusing on product innovation and strategic partnerships to maintain their market share in this competitive landscape.
Automotive Sway Bars Company Market Share
Automotive Sway Bars Market Report: 2019-2033
This comprehensive report provides an in-depth analysis of the global automotive sway bar market, encompassing market dynamics, growth trends, regional dominance, product landscape, key players, and future outlook. The study period covers 2019-2033, with 2025 as the base and estimated year. The forecast period is 2025-2033, and the historical period is 2019-2024. This report is invaluable for automotive manufacturers, component suppliers, investors, and industry professionals seeking to understand this dynamic market. The total market size is projected to reach xx million units by 2033.
Automotive Sway Bars Market Dynamics & Structure
The automotive sway bar market is characterized by moderate concentration, with several key players holding significant market share. The market is driven by technological innovations focused on lightweight materials and enhanced performance, alongside evolving safety regulations demanding improved vehicle handling. Competitive substitutes, like advanced suspension systems, pose a challenge, while end-user demographics (primarily automotive manufacturers and aftermarket tuners) influence demand. M&A activity within the sector has been relatively low in recent years, with only xx deals recorded between 2019 and 2024.
- Market Concentration: Moderately concentrated, with top 5 players holding approximately xx% market share in 2024.
- Technological Innovation: Focus on lightweight materials (aluminum, carbon fiber), advanced designs (adjustable sway bars), and improved damping characteristics.
- Regulatory Framework: Stringent safety regulations driving demand for enhanced vehicle stability and handling.
- Competitive Substitutes: Advanced suspension systems (air suspension, magnetic dampers) offering alternative solutions.
- End-User Demographics: Primarily automotive OEMs and the aftermarket tuning industry.
- M&A Trends: Relatively low M&A activity in recent years (xx deals between 2019-2024), indicating a stable competitive landscape. Innovation barriers are mainly related to material costs and the need for rigorous testing to meet safety standards.
Automotive Sway Bars Growth Trends & Insights
The automotive sway bar market experienced steady growth during the historical period (2019-2024), with a CAGR of xx%. This growth is primarily driven by increasing vehicle production, particularly in emerging markets, and a rising demand for performance enhancements in the aftermarket segment. Technological disruptions, such as the adoption of lightweight materials and advanced designs, have further boosted market expansion. Shifting consumer preferences towards improved vehicle handling and safety are also contributing to growth. Market penetration in the aftermarket segment is estimated at xx% in 2024, with significant potential for growth. The forecast period (2025-2033) anticipates continued growth, driven by increasing vehicle electrification and the development of autonomous driving technologies, which will require advanced suspension systems.
Dominant Regions, Countries, or Segments in Automotive Sway Bars
The [insert region, e.g., North America] region currently holds the largest market share in the automotive sway bar market, driven by high vehicle production volumes and robust aftermarket demand. [Insert country, e.g., the United States] is a key driver within this region due to strong consumer preferences for performance vehicles and a well-established aftermarket industry.
- Key Drivers in [insert region]: High vehicle production, strong aftermarket demand, favorable economic conditions, well-developed automotive infrastructure.
- Dominance Factors: High vehicle sales, established automotive industry, presence of major automotive manufacturers.
- Growth Potential: Continued growth is expected, driven by the expanding electric vehicle (EV) market and increasing focus on vehicle safety and handling.
Automotive Sway Bars Product Landscape
Automotive sway bars are primarily categorized by material (steel, aluminum, composite), design (adjustable, fixed), and application (passenger vehicles, light commercial vehicles). Recent product innovations focus on lightweight designs for improved fuel efficiency, adjustable sway bars for customized handling, and the integration of advanced materials to enhance performance and durability. Key selling propositions include improved handling, enhanced safety, and customizable performance. Technological advancements are centered on optimizing material properties, improving manufacturing processes, and integrating smart technologies for real-time performance monitoring.
Key Drivers, Barriers & Challenges in Automotive Sway Bars
Key Drivers:
- Increasing demand for enhanced vehicle handling and stability.
- Growing popularity of performance vehicles in the aftermarket segment.
- Stringent safety regulations promoting improved vehicle dynamics.
- Technological advancements in materials and design leading to improved performance.
Challenges & Restraints:
- Fluctuations in raw material prices (e.g., steel, aluminum).
- Increasing competition from advanced suspension systems.
- Stringent regulatory compliance requirements for safety and emissions.
- Supply chain disruptions impacting production and delivery. These challenges have resulted in an estimated xx% increase in production costs between 2021 and 2024.
Emerging Opportunities in Automotive Sway Bars
- Growing demand for lightweight sway bars in electric vehicles to improve range and performance.
- Expansion into the commercial vehicle market, driven by safety regulations and increased demand for improved handling in heavy-duty vehicles.
- Development of smart sway bars with integrated sensors and control systems.
- Increased focus on customization and personalization in the aftermarket segment.
Growth Accelerators in the Automotive Sway Bars Industry
Long-term growth in the automotive sway bar market will be fueled by technological advancements in materials science and manufacturing processes, resulting in lighter, stronger, and more cost-effective sway bars. Strategic partnerships between automotive manufacturers and component suppliers will also be crucial for innovation and market expansion. The increasing adoption of electric and autonomous vehicles will necessitate the development of advanced suspension systems, creating new opportunities for sway bar manufacturers.
Key Players Shaping the Automotive Sway Bars Market
- ZF Group
- CARROSSER
- ADDCO
- Sikky
- Hellwig
- Tanabe
- Megan Racing
- NISMO
- TSL Turton
- Whiteline
- Steeda Autosports
Notable Milestones in Automotive Sway Bars Sector
- 2021: Introduction of a new lightweight aluminum sway bar by ZF Group.
- 2022: ADDCO launches an adjustable sway bar for the aftermarket segment.
- 2023: Partnership between Hellwig and an automotive OEM for the development of a custom sway bar solution.
In-Depth Automotive Sway Bars Market Outlook
The automotive sway bar market is poised for continued growth throughout the forecast period (2025-2033), driven by the factors discussed above. Strategic opportunities exist in developing innovative products for electric vehicles, expanding into new market segments (e.g., commercial vehicles), and leveraging technological advancements to improve product performance and cost-effectiveness. Companies focusing on innovation, strategic partnerships, and efficient supply chain management will be best positioned to capture market share and drive future growth.
Automotive Sway Bars Segmentation
-
1. Application
- 1.1. Passenger Vehicles
- 1.2. Commercial Vehicles
-
2. Types
- 2.1. Active
- 2.2. Physical
Automotive Sway Bars Segmentation By Geography
-
1. North America
- 1.1. United States
- 1.2. Canada
- 1.3. Mexico
-
2. South America
- 2.1. Brazil
- 2.2. Argentina
- 2.3. Rest of South America
-
3. Europe
- 3.1. United Kingdom
- 3.2. Germany
- 3.3. France
- 3.4. Italy
- 3.5. Spain
- 3.6. Russia
- 3.7. Benelux
- 3.8. Nordics
- 3.9. Rest of Europe
-
4. Middle East & Africa
- 4.1. Turkey
- 4.2. Israel
- 4.3. GCC
- 4.4. North Africa
- 4.5. South Africa
- 4.6. Rest of Middle East & Africa
-
5. Asia Pacific
- 5.1. China
- 5.2. India
- 5.3. Japan
- 5.4. South Korea
- 5.5. ASEAN
- 5.6. Oceania
- 5.7. Rest of Asia Pacific
Automotive Sway Bars Regional Market Share
Geographic Coverage of Automotive Sway Bars
Automotive Sway Bars REPORT HIGHLIGHTS
| Aspects | Details |
|---|---|
| Study Period | 2020-2034 |
| Base Year | 2025 |
| Estimated Year | 2026 |
| Forecast Period | 2026-2034 |
| Historical Period | 2020-2025 |
| Growth Rate | CAGR of XX% from 2020-2034 |
| Segmentation |
|
Table of Contents
- 1. Introduction
- 1.1. Research Scope
- 1.2. Market Segmentation
- 1.3. Research Objective
- 1.4. Definitions and Assumptions
- 2. Executive Summary
- 2.1. Market Snapshot
- 3. Market Dynamics
- 3.1. Market Drivers
- 3.2. Market Restrains
- 3.3. Market Trends
- 3.4. Market Opportunities
- 4. Market Factor Analysis
- 4.1. Porters Five Forces
- 4.1.1. Bargaining Power of Suppliers
- 4.1.2. Bargaining Power of Buyers
- 4.1.3. Threat of New Entrants
- 4.1.4. Threat of Substitutes
- 4.1.5. Competitive Rivalry
- 4.2. PESTEL analysis
- 4.3. BCG Analysis
- 4.3.1. Stars (High Growth, High Market Share)
- 4.3.2. Cash Cows (Low Growth, High Market Share)
- 4.3.3. Question Mark (High Growth, Low Market Share)
- 4.3.4. Dogs (Low Growth, Low Market Share)
- 4.4. Ansoff Matrix Analysis
- 4.5. Supply Chain Analysis
- 4.6. Regulatory Landscape
- 4.7. Current Market Potential and Opportunity Assessment (TAM–SAM–SOM Framework)
- 4.8. IMR Analyst Note
- 4.1. Porters Five Forces
- 5. Market Analysis, Insights and Forecast 2021-2033
- 5.1. Market Analysis, Insights and Forecast - by Application
- 5.1.1. Passenger Vehicles
- 5.1.2. Commercial Vehicles
- 5.2. Market Analysis, Insights and Forecast - by Types
- 5.2.1. Active
- 5.2.2. Physical
- 5.3. Market Analysis, Insights and Forecast - by Region
- 5.3.1. North America
- 5.3.2. South America
- 5.3.3. Europe
- 5.3.4. Middle East & Africa
- 5.3.5. Asia Pacific
- 5.1. Market Analysis, Insights and Forecast - by Application
- 6. Global Automotive Sway Bars Analysis, Insights and Forecast, 2021-2033
- 6.1. Market Analysis, Insights and Forecast - by Application
- 6.1.1. Passenger Vehicles
- 6.1.2. Commercial Vehicles
- 6.2. Market Analysis, Insights and Forecast - by Types
- 6.2.1. Active
- 6.2.2. Physical
- 6.1. Market Analysis, Insights and Forecast - by Application
- 7. North America Automotive Sway Bars Analysis, Insights and Forecast, 2020-2032
- 7.1. Market Analysis, Insights and Forecast - by Application
- 7.1.1. Passenger Vehicles
- 7.1.2. Commercial Vehicles
- 7.2. Market Analysis, Insights and Forecast - by Types
- 7.2.1. Active
- 7.2.2. Physical
- 7.1. Market Analysis, Insights and Forecast - by Application
- 8. South America Automotive Sway Bars Analysis, Insights and Forecast, 2020-2032
- 8.1. Market Analysis, Insights and Forecast - by Application
- 8.1.1. Passenger Vehicles
- 8.1.2. Commercial Vehicles
- 8.2. Market Analysis, Insights and Forecast - by Types
- 8.2.1. Active
- 8.2.2. Physical
- 8.1. Market Analysis, Insights and Forecast - by Application
- 9. Europe Automotive Sway Bars Analysis, Insights and Forecast, 2020-2032
- 9.1. Market Analysis, Insights and Forecast - by Application
- 9.1.1. Passenger Vehicles
- 9.1.2. Commercial Vehicles
- 9.2. Market Analysis, Insights and Forecast - by Types
- 9.2.1. Active
- 9.2.2. Physical
- 9.1. Market Analysis, Insights and Forecast - by Application
- 10. Middle East & Africa Automotive Sway Bars Analysis, Insights and Forecast, 2020-2032
- 10.1. Market Analysis, Insights and Forecast - by Application
- 10.1.1. Passenger Vehicles
- 10.1.2. Commercial Vehicles
- 10.2. Market Analysis, Insights and Forecast - by Types
- 10.2.1. Active
- 10.2.2. Physical
- 10.1. Market Analysis, Insights and Forecast - by Application
- 11. Asia Pacific Automotive Sway Bars Analysis, Insights and Forecast, 2020-2032
- 11.1. Market Analysis, Insights and Forecast - by Application
- 11.1.1. Passenger Vehicles
- 11.1.2. Commercial Vehicles
- 11.2. Market Analysis, Insights and Forecast - by Types
- 11.2.1. Active
- 11.2.2. Physical
- 11.1. Market Analysis, Insights and Forecast - by Application
- 12. Competitive Analysis
- 12.1. Company Profiles
- 12.1.1 ZF Group
- 12.1.1.1. Company Overview
- 12.1.1.2. Products
- 12.1.1.3. Company Financials
- 12.1.1.4. SWOT Analysis
- 12.1.2 CARROSSER
- 12.1.2.1. Company Overview
- 12.1.2.2. Products
- 12.1.2.3. Company Financials
- 12.1.2.4. SWOT Analysis
- 12.1.3 ADDCO
- 12.1.3.1. Company Overview
- 12.1.3.2. Products
- 12.1.3.3. Company Financials
- 12.1.3.4. SWOT Analysis
- 12.1.4 Sikky
- 12.1.4.1. Company Overview
- 12.1.4.2. Products
- 12.1.4.3. Company Financials
- 12.1.4.4. SWOT Analysis
- 12.1.5 Hellwig
- 12.1.5.1. Company Overview
- 12.1.5.2. Products
- 12.1.5.3. Company Financials
- 12.1.5.4. SWOT Analysis
- 12.1.6 Tanabe
- 12.1.6.1. Company Overview
- 12.1.6.2. Products
- 12.1.6.3. Company Financials
- 12.1.6.4. SWOT Analysis
- 12.1.7 Megan Racing
- 12.1.7.1. Company Overview
- 12.1.7.2. Products
- 12.1.7.3. Company Financials
- 12.1.7.4. SWOT Analysis
- 12.1.8 NISMO
- 12.1.8.1. Company Overview
- 12.1.8.2. Products
- 12.1.8.3. Company Financials
- 12.1.8.4. SWOT Analysis
- 12.1.9 TSL Turton
- 12.1.9.1. Company Overview
- 12.1.9.2. Products
- 12.1.9.3. Company Financials
- 12.1.9.4. SWOT Analysis
- 12.1.10 Whiteline
- 12.1.10.1. Company Overview
- 12.1.10.2. Products
- 12.1.10.3. Company Financials
- 12.1.10.4. SWOT Analysis
- 12.1.11 Steeda Autosports
- 12.1.11.1. Company Overview
- 12.1.11.2. Products
- 12.1.11.3. Company Financials
- 12.1.11.4. SWOT Analysis
- 12.1.1 ZF Group
- 12.2. Market Entropy
- 12.2.1 Company's Key Areas Served
- 12.2.2 Recent Developments
- 12.3. Company Market Share Analysis 2025
- 12.3.1 Top 5 Companies Market Share Analysis
- 12.3.2 Top 3 Companies Market Share Analysis
- 12.4. List of Potential Customers
- 13. Research Methodology
List of Figures
- Figure 1: Global Automotive Sway Bars Revenue Breakdown (million, %) by Region 2025 & 2033
- Figure 2: North America Automotive Sway Bars Revenue (million), by Application 2025 & 2033
- Figure 3: North America Automotive Sway Bars Revenue Share (%), by Application 2025 & 2033
- Figure 4: North America Automotive Sway Bars Revenue (million), by Types 2025 & 2033
- Figure 5: North America Automotive Sway Bars Revenue Share (%), by Types 2025 & 2033
- Figure 6: North America Automotive Sway Bars Revenue (million), by Country 2025 & 2033
- Figure 7: North America Automotive Sway Bars Revenue Share (%), by Country 2025 & 2033
- Figure 8: South America Automotive Sway Bars Revenue (million), by Application 2025 & 2033
- Figure 9: South America Automotive Sway Bars Revenue Share (%), by Application 2025 & 2033
- Figure 10: South America Automotive Sway Bars Revenue (million), by Types 2025 & 2033
- Figure 11: South America Automotive Sway Bars Revenue Share (%), by Types 2025 & 2033
- Figure 12: South America Automotive Sway Bars Revenue (million), by Country 2025 & 2033
- Figure 13: South America Automotive Sway Bars Revenue Share (%), by Country 2025 & 2033
- Figure 14: Europe Automotive Sway Bars Revenue (million), by Application 2025 & 2033
- Figure 15: Europe Automotive Sway Bars Revenue Share (%), by Application 2025 & 2033
- Figure 16: Europe Automotive Sway Bars Revenue (million), by Types 2025 & 2033
- Figure 17: Europe Automotive Sway Bars Revenue Share (%), by Types 2025 & 2033
- Figure 18: Europe Automotive Sway Bars Revenue (million), by Country 2025 & 2033
- Figure 19: Europe Automotive Sway Bars Revenue Share (%), by Country 2025 & 2033
- Figure 20: Middle East & Africa Automotive Sway Bars Revenue (million), by Application 2025 & 2033
- Figure 21: Middle East & Africa Automotive Sway Bars Revenue Share (%), by Application 2025 & 2033
- Figure 22: Middle East & Africa Automotive Sway Bars Revenue (million), by Types 2025 & 2033
- Figure 23: Middle East & Africa Automotive Sway Bars Revenue Share (%), by Types 2025 & 2033
- Figure 24: Middle East & Africa Automotive Sway Bars Revenue (million), by Country 2025 & 2033
- Figure 25: Middle East & Africa Automotive Sway Bars Revenue Share (%), by Country 2025 & 2033
- Figure 26: Asia Pacific Automotive Sway Bars Revenue (million), by Application 2025 & 2033
- Figure 27: Asia Pacific Automotive Sway Bars Revenue Share (%), by Application 2025 & 2033
- Figure 28: Asia Pacific Automotive Sway Bars Revenue (million), by Types 2025 & 2033
- Figure 29: Asia Pacific Automotive Sway Bars Revenue Share (%), by Types 2025 & 2033
- Figure 30: Asia Pacific Automotive Sway Bars Revenue (million), by Country 2025 & 2033
- Figure 31: Asia Pacific Automotive Sway Bars Revenue Share (%), by Country 2025 & 2033
List of Tables
- Table 1: Global Automotive Sway Bars Revenue million Forecast, by Application 2020 & 2033
- Table 2: Global Automotive Sway Bars Revenue million Forecast, by Types 2020 & 2033
- Table 3: Global Automotive Sway Bars Revenue million Forecast, by Region 2020 & 2033
- Table 4: Global Automotive Sway Bars Revenue million Forecast, by Application 2020 & 2033
- Table 5: Global Automotive Sway Bars Revenue million Forecast, by Types 2020 & 2033
- Table 6: Global Automotive Sway Bars Revenue million Forecast, by Country 2020 & 2033
- Table 7: United States Automotive Sway Bars Revenue (million) Forecast, by Application 2020 & 2033
- Table 8: Canada Automotive Sway Bars Revenue (million) Forecast, by Application 2020 & 2033
- Table 9: Mexico Automotive Sway Bars Revenue (million) Forecast, by Application 2020 & 2033
- Table 10: Global Automotive Sway Bars Revenue million Forecast, by Application 2020 & 2033
- Table 11: Global Automotive Sway Bars Revenue million Forecast, by Types 2020 & 2033
- Table 12: Global Automotive Sway Bars Revenue million Forecast, by Country 2020 & 2033
- Table 13: Brazil Automotive Sway Bars Revenue (million) Forecast, by Application 2020 & 2033
- Table 14: Argentina Automotive Sway Bars Revenue (million) Forecast, by Application 2020 & 2033
- Table 15: Rest of South America Automotive Sway Bars Revenue (million) Forecast, by Application 2020 & 2033
- Table 16: Global Automotive Sway Bars Revenue million Forecast, by Application 2020 & 2033
- Table 17: Global Automotive Sway Bars Revenue million Forecast, by Types 2020 & 2033
- Table 18: Global Automotive Sway Bars Revenue million Forecast, by Country 2020 & 2033
- Table 19: United Kingdom Automotive Sway Bars Revenue (million) Forecast, by Application 2020 & 2033
- Table 20: Germany Automotive Sway Bars Revenue (million) Forecast, by Application 2020 & 2033
- Table 21: France Automotive Sway Bars Revenue (million) Forecast, by Application 2020 & 2033
- Table 22: Italy Automotive Sway Bars Revenue (million) Forecast, by Application 2020 & 2033
- Table 23: Spain Automotive Sway Bars Revenue (million) Forecast, by Application 2020 & 2033
- Table 24: Russia Automotive Sway Bars Revenue (million) Forecast, by Application 2020 & 2033
- Table 25: Benelux Automotive Sway Bars Revenue (million) Forecast, by Application 2020 & 2033
- Table 26: Nordics Automotive Sway Bars Revenue (million) Forecast, by Application 2020 & 2033
- Table 27: Rest of Europe Automotive Sway Bars Revenue (million) Forecast, by Application 2020 & 2033
- Table 28: Global Automotive Sway Bars Revenue million Forecast, by Application 2020 & 2033
- Table 29: Global Automotive Sway Bars Revenue million Forecast, by Types 2020 & 2033
- Table 30: Global Automotive Sway Bars Revenue million Forecast, by Country 2020 & 2033
- Table 31: Turkey Automotive Sway Bars Revenue (million) Forecast, by Application 2020 & 2033
- Table 32: Israel Automotive Sway Bars Revenue (million) Forecast, by Application 2020 & 2033
- Table 33: GCC Automotive Sway Bars Revenue (million) Forecast, by Application 2020 & 2033
- Table 34: North Africa Automotive Sway Bars Revenue (million) Forecast, by Application 2020 & 2033
- Table 35: South Africa Automotive Sway Bars Revenue (million) Forecast, by Application 2020 & 2033
- Table 36: Rest of Middle East & Africa Automotive Sway Bars Revenue (million) Forecast, by Application 2020 & 2033
- Table 37: Global Automotive Sway Bars Revenue million Forecast, by Application 2020 & 2033
- Table 38: Global Automotive Sway Bars Revenue million Forecast, by Types 2020 & 2033
- Table 39: Global Automotive Sway Bars Revenue million Forecast, by Country 2020 & 2033
- Table 40: China Automotive Sway Bars Revenue (million) Forecast, by Application 2020 & 2033
- Table 41: India Automotive Sway Bars Revenue (million) Forecast, by Application 2020 & 2033
- Table 42: Japan Automotive Sway Bars Revenue (million) Forecast, by Application 2020 & 2033
- Table 43: South Korea Automotive Sway Bars Revenue (million) Forecast, by Application 2020 & 2033
- Table 44: ASEAN Automotive Sway Bars Revenue (million) Forecast, by Application 2020 & 2033
- Table 45: Oceania Automotive Sway Bars Revenue (million) Forecast, by Application 2020 & 2033
- Table 46: Rest of Asia Pacific Automotive Sway Bars Revenue (million) Forecast, by Application 2020 & 2033
Frequently Asked Questions
1. What is the projected Compound Annual Growth Rate (CAGR) of the Automotive Sway Bars?
The projected CAGR is approximately XX%.
2. Which companies are prominent players in the Automotive Sway Bars?
Key companies in the market include ZF Group, CARROSSER, ADDCO, Sikky, Hellwig, Tanabe, Megan Racing, NISMO, TSL Turton, Whiteline, Steeda Autosports.
3. What are the main segments of the Automotive Sway Bars?
The market segments include Application, Types.
4. Can you provide details about the market size?
The market size is estimated to be USD XXX million as of 2022.
5. What are some drivers contributing to market growth?
N/A
6. What are the notable trends driving market growth?
N/A
7. Are there any restraints impacting market growth?
N/A
8. Can you provide examples of recent developments in the market?
N/A
9. What pricing options are available for accessing the report?
Pricing options include single-user, multi-user, and enterprise licenses priced at USD 2900.00, USD 4350.00, and USD 5800.00 respectively.
10. Is the market size provided in terms of value or volume?
The market size is provided in terms of value, measured in million.
11. Are there any specific market keywords associated with the report?
Yes, the market keyword associated with the report is "Automotive Sway Bars," which aids in identifying and referencing the specific market segment covered.
12. How do I determine which pricing option suits my needs best?
The pricing options vary based on user requirements and access needs. Individual users may opt for single-user licenses, while businesses requiring broader access may choose multi-user or enterprise licenses for cost-effective access to the report.
13. Are there any additional resources or data provided in the Automotive Sway Bars report?
While the report offers comprehensive insights, it's advisable to review the specific contents or supplementary materials provided to ascertain if additional resources or data are available.
14. How can I stay updated on further developments or reports in the Automotive Sway Bars?
To stay informed about further developments, trends, and reports in the Automotive Sway Bars, consider subscribing to industry newsletters, following relevant companies and organizations, or regularly checking reputable industry news sources and publications.
Methodology
Step 1 - Identification of Relevant Samples Size from Population Database


Step 2 - Approaches for Defining Global Market Size (Value, Volume* & Price*)

Note*: In applicable scenarios
Step 3 - Data Sources
Primary Research
- Web Analytics
- Survey Reports
- Research Institute
- Latest Research Reports
- Opinion Leaders
Secondary Research
- Annual Reports
- White Paper
- Latest Press Release
- Industry Association
- Paid Database
- Investor Presentations

Step 4 - Data Triangulation
Involves using different sources of information in order to increase the validity of a study
These sources are likely to be stakeholders in a program - participants, other researchers, program staff, other community members, and so on.
Then we put all data in single framework & apply various statistical tools to find out the dynamic on the market.
During the analysis stage, feedback from the stakeholder groups would be compared to determine areas of agreement as well as areas of divergence