

Key Insights
The automotive tensioner market, a critical component in maintaining optimal belt drive performance, is experiencing robust growth. While precise figures for market size and CAGR are absent, considering the global expansion of the automotive industry and the increasing demand for fuel efficiency and advanced driver-assistance systems (ADAS), a conservative estimate places the 2025 market size at approximately $5 billion USD. This growth is fueled by several key factors. The rising adoption of belt-driven systems in vehicles, including those with hybrid and electric powertrains, significantly contributes to market expansion. Furthermore, stringent government regulations promoting fuel efficiency and reduced emissions are driving the demand for advanced tensioner technologies that optimize engine performance and reduce energy loss. Technological advancements, such as the integration of intelligent tensioner systems with improved durability and longer lifespans, further enhance market appeal. However, the market faces challenges, including fluctuating raw material prices and increasing competition from substitute technologies. Nonetheless, the overall market trajectory remains positive, driven by the continuous growth in vehicle production and the escalating demand for high-performance automotive components.
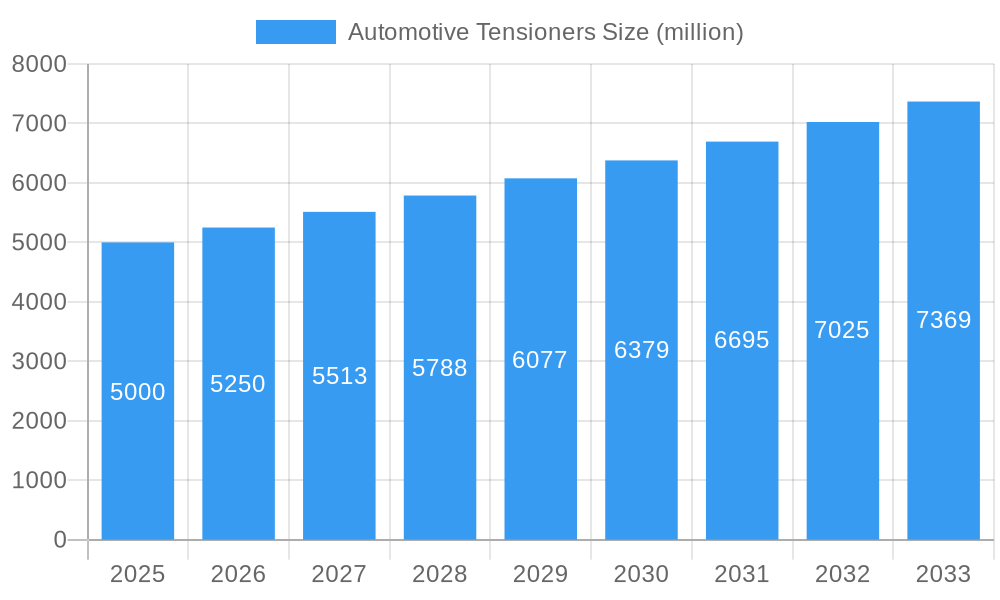
Automotive Tensioners Market Size (In Billion)
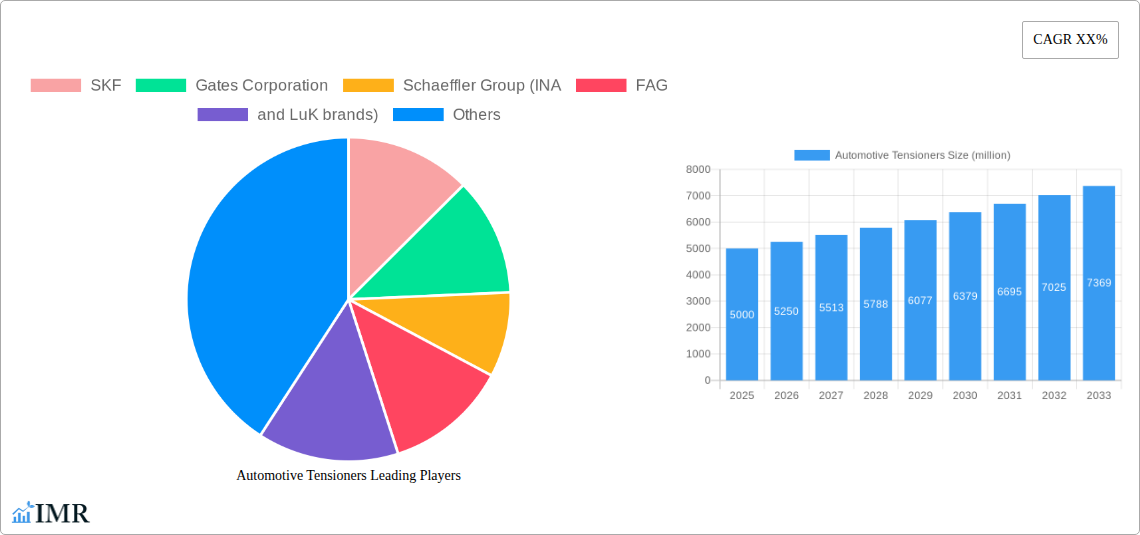
The competitive landscape is highly fragmented, with numerous established players and emerging companies vying for market share. Key players like SKF, Gates Corporation, and Schaeffler Group hold significant positions due to their extensive product portfolios, global reach, and established distribution networks. However, smaller, specialized manufacturers are also gaining traction by focusing on niche applications and innovative technologies. The industry is witnessing a shift towards greater integration of electronics and sensors in tensioner systems, leading to the development of smart tensioners that optimize belt tension dynamically based on operational conditions. This trend, coupled with the growing adoption of connected vehicles, is creating new opportunities for manufacturers who can offer advanced, data-driven solutions. Geographic expansion is also a key factor, with emerging markets in Asia and South America presenting significant growth potential. Future market success will depend on factors such as innovation in material science, cost optimization, and the ability to adapt to the evolving demands of the automotive industry's electrification and autonomous driving trends.
Automotive Tensioners Company Market Share
Automotive Tensioners Market Report: 2019-2033
This comprehensive report provides a detailed analysis of the global automotive tensioners market, encompassing market dynamics, growth trends, regional dominance, product landscape, key players, and future outlook. The study period covers 2019-2033, with 2025 as the base and estimated year. This report is crucial for automotive industry professionals, investors, and researchers seeking insights into this vital component of the automotive powertrain system. The parent market is the automotive industry, and the child market is automotive powertrain components. The global market size is estimated at xx million units in 2025.
Automotive Tensioners Market Dynamics & Structure
The automotive tensioners market is characterized by moderate concentration, with several major players holding significant market share. Technological innovation, driven by the demand for improved fuel efficiency and reduced emissions, is a key driver. Stringent regulatory frameworks globally, particularly concerning vehicle emissions, are also shaping market dynamics. The presence of competitive substitutes, such as alternative belt drive systems, presents challenges. The end-user demographics are primarily automotive manufacturers (OEMs) and aftermarket suppliers, with a growing emphasis on electric vehicles (EVs) and hybrid electric vehicles (HEVs) influencing demand. M&A activity in the sector has been relatively consistent, with xx deals recorded in the past five years, leading to consolidation among certain players.
- Market Concentration: Moderately concentrated, with top 5 players holding approximately xx% market share in 2025.
- Technological Innovation: Focus on lightweight materials, improved durability, and integrated sensor technologies.
- Regulatory Framework: Stringent emission standards globally drive demand for efficient tensioners.
- Competitive Substitutes: Presence of alternative belt drive systems impacting market growth.
- End-User Demographics: Primarily OEMs and aftermarket suppliers, with increasing EV/HEV adoption.
- M&A Activity: xx M&A deals in the past 5 years, resulting in market consolidation.
Automotive Tensioners Growth Trends & Insights
The automotive tensioners market experienced a Compound Annual Growth Rate (CAGR) of xx% during the historical period (2019-2024), reaching xx million units in 2024. The market is projected to maintain a CAGR of xx% during the forecast period (2025-2033), driven by factors such as increasing vehicle production, rising demand for enhanced fuel efficiency, and the proliferation of advanced driver-assistance systems (ADAS). Technological disruptions, such as the adoption of electric and hybrid powertrains, are impacting the design and functionality of automotive tensioners, pushing innovation in materials and functionalities. Shifts in consumer preferences towards fuel-efficient vehicles further boost market growth. Market penetration of advanced tensioner technologies is expected to reach xx% by 2033.
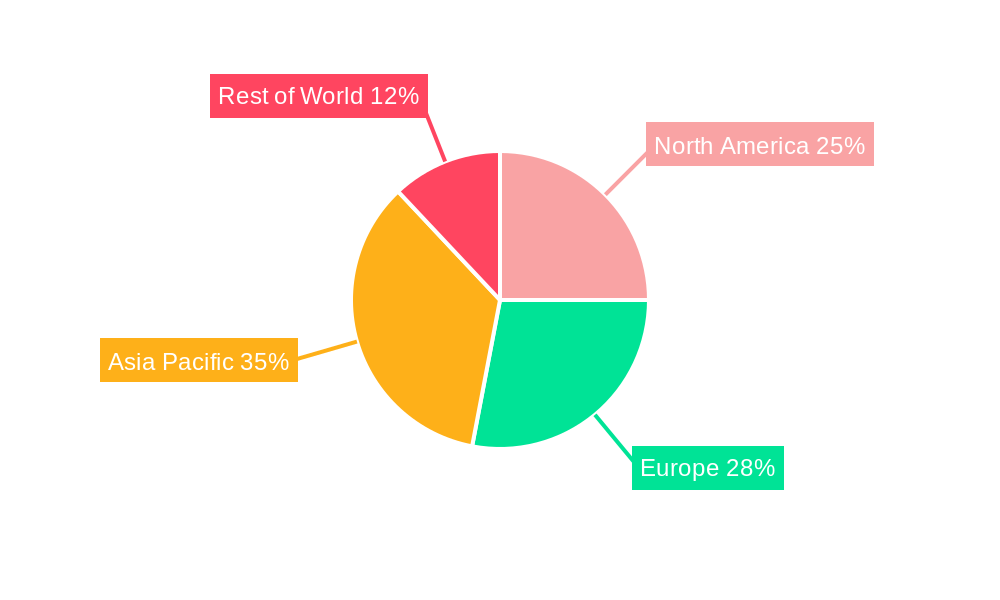
Dominant Regions, Countries, or Segments in Automotive Tensioners
The Asia-Pacific region is currently the dominant market for automotive tensioners, accounting for approximately xx% of the global market share in 2025. This dominance is largely attributed to the booming automotive industry in countries like China and India, coupled with supportive government policies promoting vehicle manufacturing and infrastructure development. Europe and North America follow closely, fueled by strong automotive production volumes and high vehicle ownership rates. The growth in the commercial vehicle segment is also contributing significantly to the overall market expansion globally.
- Key Drivers (Asia-Pacific): High vehicle production, supportive government policies, rapid infrastructure development, and rising disposable incomes.
- Dominance Factors: Large automotive manufacturing base, cost-effective manufacturing capabilities, and high demand for vehicles.
- Growth Potential: Significant growth potential remains in emerging markets within the Asia-Pacific region, as well as in regions with expanding automotive production and infrastructure development.
Automotive Tensioners Product Landscape
Automotive tensioners have witnessed significant product innovations, including the integration of smart sensors for predictive maintenance and the use of lightweight materials like aluminum and composites to improve fuel efficiency. Applications range from passenger vehicles and commercial vehicles to off-highway and industrial machinery. Performance metrics focus on durability, noise reduction, and precise belt tension control, alongside cost-effectiveness. Unique selling propositions often highlight superior longevity, quiet operation, and ease of installation, making them attractive to both OEMs and the aftermarket.
Key Drivers, Barriers & Challenges in Automotive Tensioners
Key Drivers: The increasing demand for fuel-efficient vehicles, stringent emission regulations, and technological advancements in automotive powertrains are driving market growth. The rising adoption of ADAS also contributes to the demand for advanced tensioner systems.
Challenges & Restraints: Fluctuations in raw material prices, supply chain disruptions, and intense competition among major players represent significant challenges. Stringent quality and safety standards imposed by regulatory bodies also add to the complexity of the market. The global chip shortage has also impacted production in recent years. The estimated impact on market value due to these challenges is xx million units in 2025.
Emerging Opportunities in Automotive Tensioners
Emerging opportunities lie in the growing adoption of electric and hybrid vehicles, which require specialized tensioners. Untapped markets in developing economies with rising vehicle ownership present further potential. The integration of advanced functionalities like smart sensors and predictive maintenance systems also offers opportunities for innovation and higher value-added products. The demand for aftermarket replacements in older vehicles also represents a continuous opportunity.
Growth Accelerators in the Automotive Tensioners Industry
Technological breakthroughs in materials science and manufacturing processes are driving innovation and cost reduction. Strategic partnerships between automotive component manufacturers and vehicle OEMs facilitate faster product development and market penetration. Market expansion strategies, particularly targeting emerging markets, are essential to propel long-term growth.
Key Players Shaping the Automotive Tensioners Market
- SKF
- Gates Corporation
- Schaeffler Group (INA, FAG, and LuK brands)
- NTN-SNR
- Continental
- GMB Corporation
- ACDelco
- Dayco
- Litens Automotive Group
- BorgWarner
- URO Parts
- Vaico
- Febi Bilstein
- Hutchinson
- Roulunds Rubber
- Optibelt
- Bando
- BEHR HELLA Service
- Delphi Technologies
- ZF Friedrichshafen AG
- Magneti Marelli
- MANN+HUMMEL
- HELLA GmbH & Co. KGaA
- Trelleborg AB
- Sogefi Group
- Valeo
- Mahle GmbH
- Robert Bosch GmbH
- Aisin Seiki Co., Ltd.
- Denso Corporation
- Visteon Corporation
- Brose Fahrzeugteile GmbH & Co. KG
- TRW Automotive
- Nissens A/S
- Metelli Group
- Vemo
- Quinton Hazell (QH)
- Swag
- Corteco
- Ruville
- GKN Automotive
- ElringKlinger AG
- NGK Spark Plug Co., Ltd.
- WABCO
- Lukoil Lubricants Europe Oy
- Kolbenschmidt Pierburg AG
- Leoni AG
- Webasto
- Eberspächer Group
Notable Milestones in Automotive Tensioners Sector
- 2021: Introduction of a new lightweight tensioner design by Schaeffler, improving fuel efficiency by xx%.
- 2022: Strategic partnership between Gates Corporation and an EV manufacturer to develop specialized tensioner systems.
- 2023: Acquisition of a smaller tensioner manufacturer by Continental, expanding their product portfolio.
In-Depth Automotive Tensioners Market Outlook
The automotive tensioners market is poised for sustained growth, driven by continuous technological advancements, increased vehicle production, and the expanding adoption of electric and hybrid vehicles. Strategic partnerships, investments in R&D, and focused market expansion strategies are expected to significantly shape the market's future trajectory. The market presents significant opportunities for players focused on innovation, efficiency, and sustainability. The future growth is expected to be further fueled by the increasing adoption of advanced driver-assistance systems and autonomous vehicles, which will demand more sophisticated and reliable tensioner technologies.
Automotive Tensioners Segmentation
- 1. Application
- 2. Types
Automotive Tensioners Segmentation By Geography
-
1. Europe
- 1.1. United Kingdom
- 1.2. Germany
- 1.3. France
- 1.4. Italy
- 1.5. Spain
- 1.6. Netherlands
- 1.7. Belgium
- 1.8. Sweden
- 1.9. Norway
- 1.10. Poland
- 1.11. Denmark
Automotive Tensioners Regional Market Share
Geographic Coverage of Automotive Tensioners
Automotive Tensioners REPORT HIGHLIGHTS
| Aspects | Details |
|---|---|
| Study Period | 2020-2034 |
| Base Year | 2025 |
| Estimated Year | 2026 |
| Forecast Period | 2026-2034 |
| Historical Period | 2020-2025 |
| Growth Rate | CAGR of XX% from 2020-2034 |
| Segmentation |
|
Table of Contents
- 1. Introduction
- 1.1. Research Scope
- 1.2. Market Segmentation
- 1.3. Research Objective
- 1.4. Definitions and Assumptions
- 2. Executive Summary
- 2.1. Market Snapshot
- 3. Market Dynamics
- 3.1. Market Drivers
- 3.2. Market Restrains
- 3.3. Market Trends
- 3.4. Market Opportunities
- 4. Market Factor Analysis
- 4.1. Porters Five Forces
- 4.1.1. Bargaining Power of Suppliers
- 4.1.2. Bargaining Power of Buyers
- 4.1.3. Threat of New Entrants
- 4.1.4. Threat of Substitutes
- 4.1.5. Competitive Rivalry
- 4.2. PESTEL analysis
- 4.3. BCG Analysis
- 4.3.1. Stars (High Growth, High Market Share)
- 4.3.2. Cash Cows (Low Growth, High Market Share)
- 4.3.3. Question Mark (High Growth, Low Market Share)
- 4.3.4. Dogs (Low Growth, Low Market Share)
- 4.4. Ansoff Matrix Analysis
- 4.5. Supply Chain Analysis
- 4.6. Regulatory Landscape
- 4.7. Current Market Potential and Opportunity Assessment (TAM–SAM–SOM Framework)
- 4.8. IMR Analyst Note
- 4.1. Porters Five Forces
- 5. Market Analysis, Insights and Forecast 2021-2033
- 5.1. Market Analysis, Insights and Forecast - by Application
- 5.2. Market Analysis, Insights and Forecast - by Types
- 5.3. Market Analysis, Insights and Forecast - by Region
- 5.3.1. Europe
- 6. Automotive Tensioners Analysis, Insights and Forecast, 2021-2033
- 6.1. Market Analysis, Insights and Forecast - by Application
- 6.2. Market Analysis, Insights and Forecast - by Types
- 7. Competitive Analysis
- 7.1. Company Profiles
- 7.1.1 SKF
- 7.1.1.1. Company Overview
- 7.1.1.2. Products
- 7.1.1.3. Company Financials
- 7.1.1.4. SWOT Analysis
- 7.1.2 Gates Corporation
- 7.1.2.1. Company Overview
- 7.1.2.2. Products
- 7.1.2.3. Company Financials
- 7.1.2.4. SWOT Analysis
- 7.1.3 Schaeffler Group (INA
- 7.1.3.1. Company Overview
- 7.1.3.2. Products
- 7.1.3.3. Company Financials
- 7.1.3.4. SWOT Analysis
- 7.1.4 FAG
- 7.1.4.1. Company Overview
- 7.1.4.2. Products
- 7.1.4.3. Company Financials
- 7.1.4.4. SWOT Analysis
- 7.1.5 and LuK brands)
- 7.1.5.1. Company Overview
- 7.1.5.2. Products
- 7.1.5.3. Company Financials
- 7.1.5.4. SWOT Analysis
- 7.1.6 NTN-SNR
- 7.1.6.1. Company Overview
- 7.1.6.2. Products
- 7.1.6.3. Company Financials
- 7.1.6.4. SWOT Analysis
- 7.1.7 Continental
- 7.1.7.1. Company Overview
- 7.1.7.2. Products
- 7.1.7.3. Company Financials
- 7.1.7.4. SWOT Analysis
- 7.1.8 GMB Corporation
- 7.1.8.1. Company Overview
- 7.1.8.2. Products
- 7.1.8.3. Company Financials
- 7.1.8.4. SWOT Analysis
- 7.1.9 ACDelco
- 7.1.9.1. Company Overview
- 7.1.9.2. Products
- 7.1.9.3. Company Financials
- 7.1.9.4. SWOT Analysis
- 7.1.10 Dayco
- 7.1.10.1. Company Overview
- 7.1.10.2. Products
- 7.1.10.3. Company Financials
- 7.1.10.4. SWOT Analysis
- 7.1.11 Litens Automotive Group
- 7.1.11.1. Company Overview
- 7.1.11.2. Products
- 7.1.11.3. Company Financials
- 7.1.11.4. SWOT Analysis
- 7.1.12 BorgWarner
- 7.1.12.1. Company Overview
- 7.1.12.2. Products
- 7.1.12.3. Company Financials
- 7.1.12.4. SWOT Analysis
- 7.1.13 URO Parts
- 7.1.13.1. Company Overview
- 7.1.13.2. Products
- 7.1.13.3. Company Financials
- 7.1.13.4. SWOT Analysis
- 7.1.14 Vaico
- 7.1.14.1. Company Overview
- 7.1.14.2. Products
- 7.1.14.3. Company Financials
- 7.1.14.4. SWOT Analysis
- 7.1.15 Febi Bilstein
- 7.1.15.1. Company Overview
- 7.1.15.2. Products
- 7.1.15.3. Company Financials
- 7.1.15.4. SWOT Analysis
- 7.1.16 Hutchinson
- 7.1.16.1. Company Overview
- 7.1.16.2. Products
- 7.1.16.3. Company Financials
- 7.1.16.4. SWOT Analysis
- 7.1.17 Roulunds Rubber
- 7.1.17.1. Company Overview
- 7.1.17.2. Products
- 7.1.17.3. Company Financials
- 7.1.17.4. SWOT Analysis
- 7.1.18 Optibelt
- 7.1.18.1. Company Overview
- 7.1.18.2. Products
- 7.1.18.3. Company Financials
- 7.1.18.4. SWOT Analysis
- 7.1.19 Bando
- 7.1.19.1. Company Overview
- 7.1.19.2. Products
- 7.1.19.3. Company Financials
- 7.1.19.4. SWOT Analysis
- 7.1.20 BEHR HELLA Service
- 7.1.20.1. Company Overview
- 7.1.20.2. Products
- 7.1.20.3. Company Financials
- 7.1.20.4. SWOT Analysis
- 7.1.21 Delphi Technologies
- 7.1.21.1. Company Overview
- 7.1.21.2. Products
- 7.1.21.3. Company Financials
- 7.1.21.4. SWOT Analysis
- 7.1.22 ZF Friedrichshafen AG
- 7.1.22.1. Company Overview
- 7.1.22.2. Products
- 7.1.22.3. Company Financials
- 7.1.22.4. SWOT Analysis
- 7.1.23 Magneti Marelli
- 7.1.23.1. Company Overview
- 7.1.23.2. Products
- 7.1.23.3. Company Financials
- 7.1.23.4. SWOT Analysis
- 7.1.24 MANN+HUMMEL
- 7.1.24.1. Company Overview
- 7.1.24.2. Products
- 7.1.24.3. Company Financials
- 7.1.24.4. SWOT Analysis
- 7.1.25 HELLA GmbH & Co. KGaA
- 7.1.25.1. Company Overview
- 7.1.25.2. Products
- 7.1.25.3. Company Financials
- 7.1.25.4. SWOT Analysis
- 7.1.26 Trelleborg AB
- 7.1.26.1. Company Overview
- 7.1.26.2. Products
- 7.1.26.3. Company Financials
- 7.1.26.4. SWOT Analysis
- 7.1.27 Sogefi Group
- 7.1.27.1. Company Overview
- 7.1.27.2. Products
- 7.1.27.3. Company Financials
- 7.1.27.4. SWOT Analysis
- 7.1.28 Valeo
- 7.1.28.1. Company Overview
- 7.1.28.2. Products
- 7.1.28.3. Company Financials
- 7.1.28.4. SWOT Analysis
- 7.1.29 Mahle GmbH
- 7.1.29.1. Company Overview
- 7.1.29.2. Products
- 7.1.29.3. Company Financials
- 7.1.29.4. SWOT Analysis
- 7.1.30 Robert Bosch GmbH
- 7.1.30.1. Company Overview
- 7.1.30.2. Products
- 7.1.30.3. Company Financials
- 7.1.30.4. SWOT Analysis
- 7.1.31 Aisin Seiki Co.
- 7.1.31.1. Company Overview
- 7.1.31.2. Products
- 7.1.31.3. Company Financials
- 7.1.31.4. SWOT Analysis
- 7.1.32 Ltd.
- 7.1.32.1. Company Overview
- 7.1.32.2. Products
- 7.1.32.3. Company Financials
- 7.1.32.4. SWOT Analysis
- 7.1.33 Denso Corporation
- 7.1.33.1. Company Overview
- 7.1.33.2. Products
- 7.1.33.3. Company Financials
- 7.1.33.4. SWOT Analysis
- 7.1.34 Visteon Corporation
- 7.1.34.1. Company Overview
- 7.1.34.2. Products
- 7.1.34.3. Company Financials
- 7.1.34.4. SWOT Analysis
- 7.1.35 Brose Fahrzeugteile GmbH & Co. KG
- 7.1.35.1. Company Overview
- 7.1.35.2. Products
- 7.1.35.3. Company Financials
- 7.1.35.4. SWOT Analysis
- 7.1.36 TRW Automotive
- 7.1.36.1. Company Overview
- 7.1.36.2. Products
- 7.1.36.3. Company Financials
- 7.1.36.4. SWOT Analysis
- 7.1.37 Nissens A/S
- 7.1.37.1. Company Overview
- 7.1.37.2. Products
- 7.1.37.3. Company Financials
- 7.1.37.4. SWOT Analysis
- 7.1.38 Metelli Group
- 7.1.38.1. Company Overview
- 7.1.38.2. Products
- 7.1.38.3. Company Financials
- 7.1.38.4. SWOT Analysis
- 7.1.39 Vemo
- 7.1.39.1. Company Overview
- 7.1.39.2. Products
- 7.1.39.3. Company Financials
- 7.1.39.4. SWOT Analysis
- 7.1.40 Quinton Hazell (QH)
- 7.1.40.1. Company Overview
- 7.1.40.2. Products
- 7.1.40.3. Company Financials
- 7.1.40.4. SWOT Analysis
- 7.1.41 Swag
- 7.1.41.1. Company Overview
- 7.1.41.2. Products
- 7.1.41.3. Company Financials
- 7.1.41.4. SWOT Analysis
- 7.1.42 Corteco
- 7.1.42.1. Company Overview
- 7.1.42.2. Products
- 7.1.42.3. Company Financials
- 7.1.42.4. SWOT Analysis
- 7.1.43 Ruville
- 7.1.43.1. Company Overview
- 7.1.43.2. Products
- 7.1.43.3. Company Financials
- 7.1.43.4. SWOT Analysis
- 7.1.44 GKN Automotive
- 7.1.44.1. Company Overview
- 7.1.44.2. Products
- 7.1.44.3. Company Financials
- 7.1.44.4. SWOT Analysis
- 7.1.45 ElringKlinger AG
- 7.1.45.1. Company Overview
- 7.1.45.2. Products
- 7.1.45.3. Company Financials
- 7.1.45.4. SWOT Analysis
- 7.1.46 NGK Spark Plug Co.
- 7.1.46.1. Company Overview
- 7.1.46.2. Products
- 7.1.46.3. Company Financials
- 7.1.46.4. SWOT Analysis
- 7.1.47 Ltd.
- 7.1.47.1. Company Overview
- 7.1.47.2. Products
- 7.1.47.3. Company Financials
- 7.1.47.4. SWOT Analysis
- 7.1.48 WABCO
- 7.1.48.1. Company Overview
- 7.1.48.2. Products
- 7.1.48.3. Company Financials
- 7.1.48.4. SWOT Analysis
- 7.1.49 Lukoil Lubricants Europe Oy
- 7.1.49.1. Company Overview
- 7.1.49.2. Products
- 7.1.49.3. Company Financials
- 7.1.49.4. SWOT Analysis
- 7.1.50 Kolbenschmidt Pierburg AG
- 7.1.50.1. Company Overview
- 7.1.50.2. Products
- 7.1.50.3. Company Financials
- 7.1.50.4. SWOT Analysis
- 7.1.51 Leoni AG
- 7.1.51.1. Company Overview
- 7.1.51.2. Products
- 7.1.51.3. Company Financials
- 7.1.51.4. SWOT Analysis
- 7.1.52 Webasto
- 7.1.52.1. Company Overview
- 7.1.52.2. Products
- 7.1.52.3. Company Financials
- 7.1.52.4. SWOT Analysis
- 7.1.53 Eberspächer Group
- 7.1.53.1. Company Overview
- 7.1.53.2. Products
- 7.1.53.3. Company Financials
- 7.1.53.4. SWOT Analysis
- 7.1.1 SKF
- 7.2. Market Entropy
- 7.2.1 Company's Key Areas Served
- 7.2.2 Recent Developments
- 7.3. Company Market Share Analysis 2025
- 7.3.1 Top 5 Companies Market Share Analysis
- 7.3.2 Top 3 Companies Market Share Analysis
- 7.4. List of Potential Customers
- 8. Research Methodology
List of Figures
- Figure 1: Automotive Tensioners Revenue Breakdown (million, %) by Product 2025 & 2033
- Figure 2: Automotive Tensioners Share (%) by Company 2025
List of Tables
- Table 1: Automotive Tensioners Revenue million Forecast, by Application 2020 & 2033
- Table 2: Automotive Tensioners Revenue million Forecast, by Types 2020 & 2033
- Table 3: Automotive Tensioners Revenue million Forecast, by Region 2020 & 2033
- Table 4: Automotive Tensioners Revenue million Forecast, by Application 2020 & 2033
- Table 5: Automotive Tensioners Revenue million Forecast, by Types 2020 & 2033
- Table 6: Automotive Tensioners Revenue million Forecast, by Country 2020 & 2033
- Table 7: United Kingdom Automotive Tensioners Revenue (million) Forecast, by Application 2020 & 2033
- Table 8: Germany Automotive Tensioners Revenue (million) Forecast, by Application 2020 & 2033
- Table 9: France Automotive Tensioners Revenue (million) Forecast, by Application 2020 & 2033
- Table 10: Italy Automotive Tensioners Revenue (million) Forecast, by Application 2020 & 2033
- Table 11: Spain Automotive Tensioners Revenue (million) Forecast, by Application 2020 & 2033
- Table 12: Netherlands Automotive Tensioners Revenue (million) Forecast, by Application 2020 & 2033
- Table 13: Belgium Automotive Tensioners Revenue (million) Forecast, by Application 2020 & 2033
- Table 14: Sweden Automotive Tensioners Revenue (million) Forecast, by Application 2020 & 2033
- Table 15: Norway Automotive Tensioners Revenue (million) Forecast, by Application 2020 & 2033
- Table 16: Poland Automotive Tensioners Revenue (million) Forecast, by Application 2020 & 2033
- Table 17: Denmark Automotive Tensioners Revenue (million) Forecast, by Application 2020 & 2033
Frequently Asked Questions
1. What is the projected Compound Annual Growth Rate (CAGR) of the Automotive Tensioners?
The projected CAGR is approximately XX%.
2. Which companies are prominent players in the Automotive Tensioners?
Key companies in the market include SKF, Gates Corporation, Schaeffler Group (INA, FAG, and LuK brands), NTN-SNR, Continental, GMB Corporation, ACDelco, Dayco, Litens Automotive Group, BorgWarner, URO Parts, Vaico, Febi Bilstein, Hutchinson, Roulunds Rubber, Optibelt, Bando, BEHR HELLA Service, Delphi Technologies, ZF Friedrichshafen AG, Magneti Marelli, MANN+HUMMEL, HELLA GmbH & Co. KGaA, Trelleborg AB, Sogefi Group, Valeo, Mahle GmbH, Robert Bosch GmbH, Aisin Seiki Co., Ltd., Denso Corporation, Visteon Corporation, Brose Fahrzeugteile GmbH & Co. KG, TRW Automotive, Nissens A/S, Metelli Group, Vemo, Quinton Hazell (QH), Swag, Corteco, Ruville, GKN Automotive, ElringKlinger AG, NGK Spark Plug Co., Ltd., WABCO, Lukoil Lubricants Europe Oy, Kolbenschmidt Pierburg AG, Leoni AG, Webasto, Eberspächer Group.
3. What are the main segments of the Automotive Tensioners?
The market segments include Application, Types.
4. Can you provide details about the market size?
The market size is estimated to be USD XXX million as of 2022.
5. What are some drivers contributing to market growth?
N/A
6. What are the notable trends driving market growth?
N/A
7. Are there any restraints impacting market growth?
N/A
8. Can you provide examples of recent developments in the market?
N/A
9. What pricing options are available for accessing the report?
Pricing options include single-user, multi-user, and enterprise licenses priced at USD 3900.00, USD 5850.00, and USD 7800.00 respectively.
10. Is the market size provided in terms of value or volume?
The market size is provided in terms of value, measured in million.
11. Are there any specific market keywords associated with the report?
Yes, the market keyword associated with the report is "Automotive Tensioners," which aids in identifying and referencing the specific market segment covered.
12. How do I determine which pricing option suits my needs best?
The pricing options vary based on user requirements and access needs. Individual users may opt for single-user licenses, while businesses requiring broader access may choose multi-user or enterprise licenses for cost-effective access to the report.
13. Are there any additional resources or data provided in the Automotive Tensioners report?
While the report offers comprehensive insights, it's advisable to review the specific contents or supplementary materials provided to ascertain if additional resources or data are available.
14. How can I stay updated on further developments or reports in the Automotive Tensioners?
To stay informed about further developments, trends, and reports in the Automotive Tensioners, consider subscribing to industry newsletters, following relevant companies and organizations, or regularly checking reputable industry news sources and publications.
Methodology
Step 1 - Identification of Relevant Samples Size from Population Database


Step 2 - Approaches for Defining Global Market Size (Value, Volume* & Price*)

Note*: In applicable scenarios
Step 3 - Data Sources
Primary Research
- Web Analytics
- Survey Reports
- Research Institute
- Latest Research Reports
- Opinion Leaders
Secondary Research
- Annual Reports
- White Paper
- Latest Press Release
- Industry Association
- Paid Database
- Investor Presentations

Step 4 - Data Triangulation
Involves using different sources of information in order to increase the validity of a study
These sources are likely to be stakeholders in a program - participants, other researchers, program staff, other community members, and so on.
Then we put all data in single framework & apply various statistical tools to find out the dynamic on the market.
During the analysis stage, feedback from the stakeholder groups would be compared to determine areas of agreement as well as areas of divergence