

Key Insights
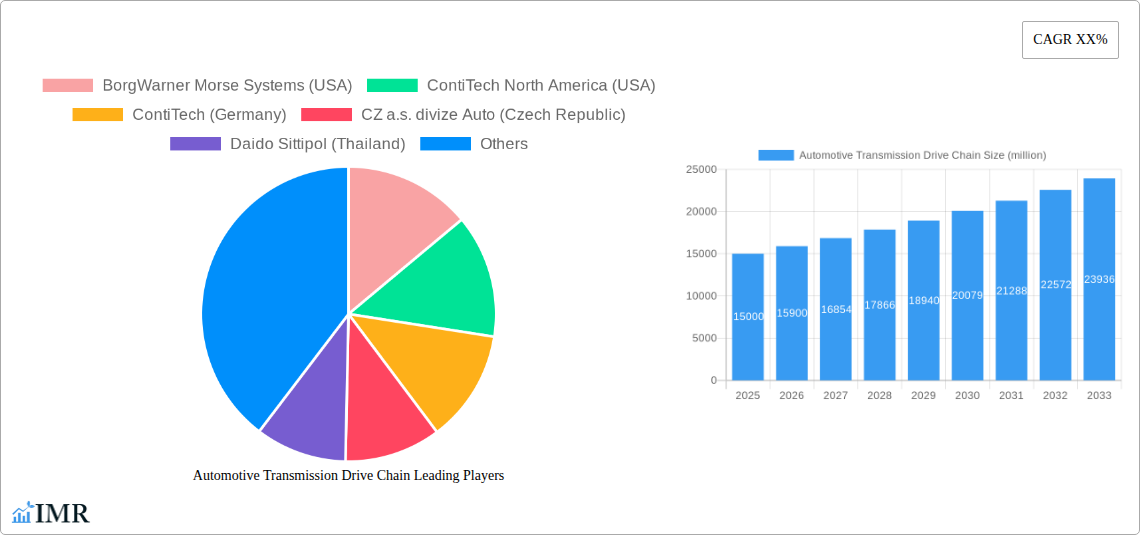
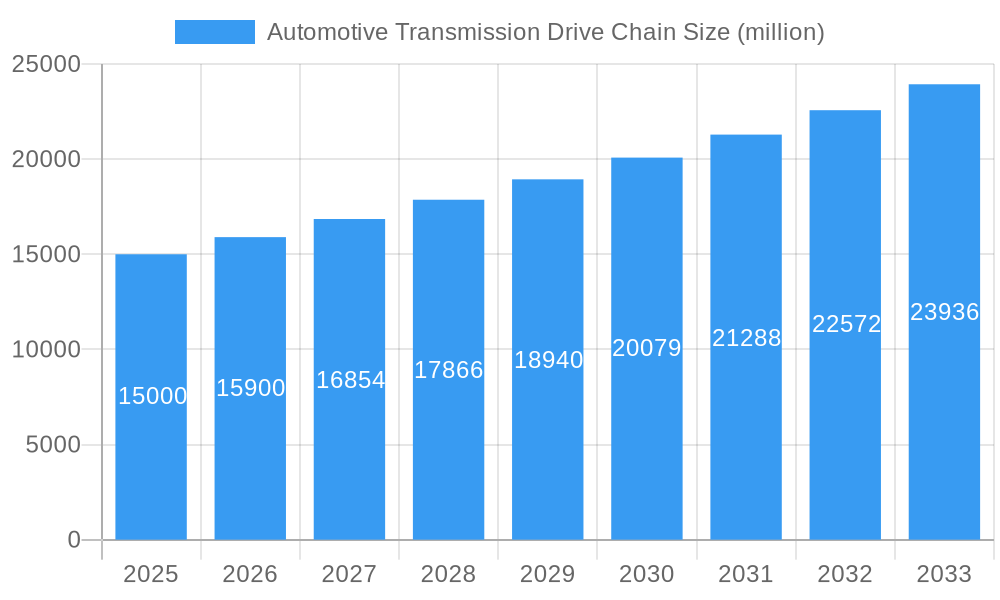
The global automotive transmission drive chain market is experiencing robust growth, driven by the increasing demand for fuel-efficient vehicles and the rising adoption of advanced transmission systems. The market, estimated at $15 billion in 2025, is projected to witness a Compound Annual Growth Rate (CAGR) of 6% from 2025 to 2033, reaching an estimated value of $25 billion by 2033. This growth is fueled by several key factors, including the proliferation of electric vehicles (EVs) and hybrid electric vehicles (HEVs), which necessitate sophisticated and durable transmission drive chains. Furthermore, stringent government regulations promoting fuel efficiency and reduced emissions are pushing automakers to integrate more efficient transmission technologies, thereby boosting demand for high-performance drive chains. Technological advancements in materials science, leading to lighter, stronger, and more durable chains, also contribute to the market's expansion. Key players like BorgWarner, ContiTech, and Dayco are actively investing in research and development to enhance their product offerings and meet the evolving needs of the automotive industry. Competition is intense, with both established players and emerging manufacturers vying for market share. Geographic expansion, particularly in developing economies with burgeoning automotive sectors, presents significant opportunities for growth.
Automotive Transmission Drive Chain Market Size (In Billion)
However, certain restraints are also impacting the market. Fluctuations in raw material prices, particularly steel and other metals, pose a significant challenge to manufacturers. Supply chain disruptions and geopolitical instability can also affect production and delivery timelines, impacting market dynamics. Additionally, the increasing adoption of electric transmissions in some vehicle segments might pose a long-term challenge, although this transition also presents opportunities for companies that develop electric transmission components. Nevertheless, the overall market outlook remains positive, driven by the continued growth of the global automotive industry and the increasing demand for improved vehicle performance and efficiency. The market is segmented based on vehicle type (passenger cars, commercial vehicles), transmission type (manual, automatic, CVT), material type (steel, non-steel), and geography, each with its specific growth drivers and challenges.
Automotive Transmission Drive Chain Company Market Share
Automotive Transmission Drive Chain Market Report: 2019-2033
This comprehensive report provides a detailed analysis of the global Automotive Transmission Drive Chain market, encompassing market dynamics, growth trends, regional insights, product landscape, and key player strategies. The report covers the period from 2019 to 2033, with a focus on the forecast period of 2025-2033 and a base year of 2025. The study meticulously examines the parent market (Automotive Transmission Systems) and child markets (e.g., passenger vehicles, commercial vehicles) to offer a granular understanding of market segmentation and opportunities. This report is indispensable for automotive manufacturers, component suppliers, investors, and industry consultants seeking to navigate this dynamic market landscape. The total market size is projected to reach xx million units by 2033.
Automotive Transmission Drive Chain Market Dynamics & Structure
The automotive transmission drive chain market is characterized by moderate concentration, with a few major players holding significant market share. Technological innovations, particularly in materials science and manufacturing processes, are driving efficiency gains and performance enhancements. Stringent regulatory frameworks concerning fuel efficiency and emissions are also shaping market dynamics. Competitive pressures from alternative transmission technologies, such as continuously variable transmissions (CVTs), present challenges for market growth. The end-user demographic is primarily influenced by the automotive industry's production volumes and consumer preferences, including demand for fuel-efficient vehicles. M&A activity in the sector has been moderate, mainly driven by strategic acquisitions to expand product portfolios and geographic reach.
- Market Concentration: Moderately concentrated, with top 5 players holding approximately xx% market share in 2025.
- Technological Innovation: Focus on lightweight materials, improved durability, and noise reduction.
- Regulatory Framework: Stringent emission standards and fuel economy regulations.
- Competitive Substitutes: CVT, dual-clutch transmissions (DCTs), and automated manual transmissions (AMTs).
- End-User Demographics: Primarily driven by automotive production volumes across various vehicle segments.
- M&A Trends: Moderate activity, focusing on strategic acquisitions and expansion into new markets. xx M&A deals were recorded between 2019 and 2024.
Automotive Transmission Drive Chain Growth Trends & Insights
The global automotive transmission drive chain market experienced a compound annual growth rate (CAGR) of xx% during the historical period (2019-2024). This growth is primarily attributable to the increasing demand for automobiles globally, particularly in developing economies. Technological advancements in drive chain design and manufacturing have also contributed to higher adoption rates. However, the market's growth trajectory has been impacted by factors such as economic fluctuations and the increasing adoption of alternative transmission technologies. Market penetration is expected to reach xx% by 2033, driven by continuous innovations and growth in the automotive sector. The market size is projected to reach xx million units by 2033, exhibiting a CAGR of xx% during the forecast period (2025-2033). This growth is primarily driven by the increasing demand for vehicles, technological advancements, and the expansion of the automotive industry in emerging markets. Consumer behavior is shifting towards fuel-efficient vehicles, further bolstering demand for high-performance and durable drive chains.
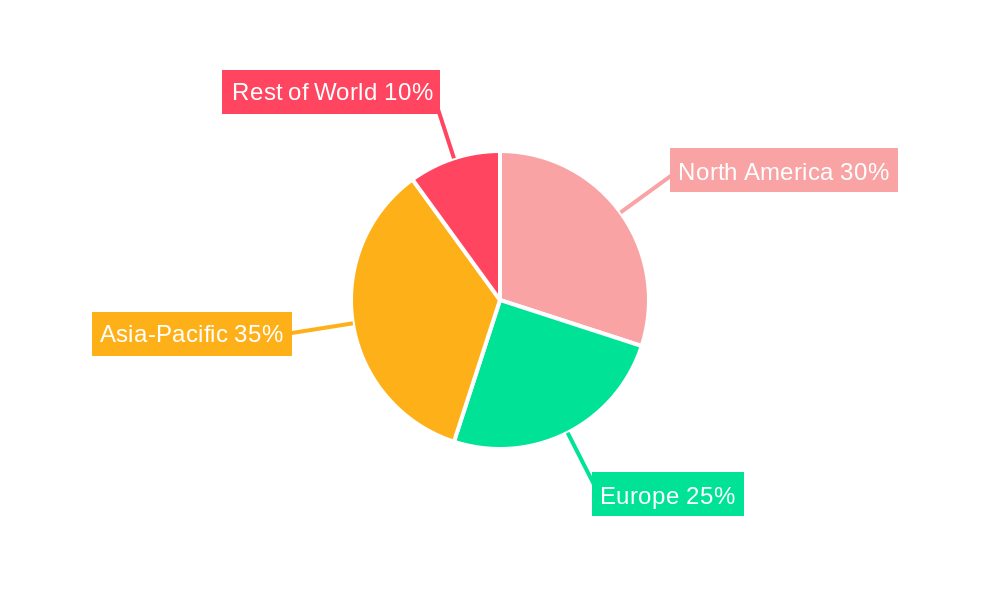
Dominant Regions, Countries, or Segments in Automotive Transmission Drive Chain
Asia-Pacific is projected to be the dominant region in the automotive transmission drive chain market throughout the forecast period. This dominance is primarily due to the significant growth of the automotive industry in countries like China and India. These nations are witnessing rapid economic growth and expanding automotive production capabilities. The strong growth is fueled by rising disposable incomes, supportive government policies promoting vehicle ownership, and robust infrastructure development. Europe and North America also hold substantial market shares, driven by technological advancements and the presence of established automotive manufacturers.
- Key Drivers (Asia-Pacific): Rapid economic growth, increasing vehicle production, supportive government policies, expanding middle class.
- Key Drivers (Europe & North America): Technological innovation, established automotive industry, high vehicle ownership rates.
- Market Share: Asia-Pacific holds approximately xx% of the global market share in 2025, followed by Europe (xx%) and North America (xx%).
- Growth Potential: High growth potential in emerging markets within Asia-Pacific and Africa.
Automotive Transmission Drive Chain Product Landscape
The automotive transmission drive chain market offers a range of products designed for various vehicle applications, from passenger cars to heavy-duty trucks. Innovations focus on enhancing durability, reducing noise and vibration, and improving fuel efficiency. Advanced materials, such as high-strength steels and polymers, are being integrated to improve performance metrics. Unique selling propositions include extended service life, reduced maintenance requirements, and improved transmission efficiency. Technological advancements are driven by the need for lighter, stronger, and more efficient drive chains to meet stringent environmental regulations.
Key Drivers, Barriers & Challenges in Automotive Transmission Drive Chain
Key Drivers:
- Increasing demand for vehicles globally, particularly in emerging markets.
- Technological advancements leading to improved performance and efficiency.
- Stringent emission regulations driving the demand for fuel-efficient components.
Key Challenges:
- Competition from alternative transmission technologies.
- Fluctuations in raw material prices impacting production costs.
- Supply chain disruptions due to geopolitical instability and pandemics. This led to a xx% increase in production costs in 2022.
Emerging Opportunities in Automotive Transmission Drive Chain
- Growing demand for electric and hybrid vehicles presents opportunities for specialized drive chains.
- Expansion into developing markets with increasing vehicle ownership.
- Development of lightweight and high-strength materials to enhance efficiency and performance.
Growth Accelerators in the Automotive Transmission Drive Chain Industry
Technological advancements, strategic partnerships, and expansion into new markets are driving long-term growth in the automotive transmission drive chain industry. Innovations in materials science and manufacturing processes are improving the performance and durability of drive chains. Collaborative efforts between manufacturers and automotive companies are fostering the development of tailored solutions for specific vehicle applications. Expansion into emerging markets, particularly in Asia-Pacific and Africa, is unlocking significant growth potential.
Key Players Shaping the Automotive Transmission Drive Chain Market
- BorgWarner Morse Systems (USA)
- ContiTech North America (USA)
- ContiTech (Germany)
- CZ a.s. divize Auto (Czech Republic)
- Daido Sittipol (Thailand)
- Dayco (USA)
- Daytec (Brazil)
- Dimo Castings (India)
- Forbo Siegling (Mexico)
- Forjanor (Spain)
- Gaotang Jinxiang Auto Parts (China)
- Jiaxing Hexin Automotive Parts (China)
- Kee Fatt Industries (Malaysia)
- L.G.Balakrishnan & Bros (India)
- New Contiland Manufacturing (China)
- Renold (Germany)
- Star Transmission (Romania)
- Suzhou Universal Group (China)
- Thermoid (USA)
- TIC ROULUNDS (Italy)
- Zhoushan Aosheng Auto Transmission Belt Manufacturing (China)
Notable Milestones in Automotive Transmission Drive Chain Sector
- 2020: Introduction of a new lightweight drive chain by BorgWarner Morse Systems.
- 2022: ContiTech acquires a smaller competitor, expanding its market share.
- 2023: Dayco launches a new high-performance drive chain for electric vehicles.
In-Depth Automotive Transmission Drive Chain Market Outlook
The automotive transmission drive chain market is poised for sustained growth, driven by the ongoing expansion of the automotive industry and continuous technological advancements. Strategic partnerships, investments in research and development, and expansion into new geographical markets will be crucial for success in this competitive landscape. The focus on sustainability and fuel efficiency will continue to shape product development, favoring lightweight and high-performance drive chains. The market presents attractive opportunities for companies with a strong focus on innovation and a proactive approach to market penetration.
Automotive Transmission Drive Chain Segmentation
-
1. Application
- 1.1. Passenger Cars
- 1.2. Commercial Vehicles
-
2. Types
- 2.1. Roller Chain
- 2.2. Leaf Chain
- 2.3. Flat-Top Chain
- 2.4. Others
Automotive Transmission Drive Chain Segmentation By Geography
-
1. North America
- 1.1. United States
- 1.2. Canada
- 1.3. Mexico
-
2. South America
- 2.1. Brazil
- 2.2. Argentina
- 2.3. Rest of South America
-
3. Europe
- 3.1. United Kingdom
- 3.2. Germany
- 3.3. France
- 3.4. Italy
- 3.5. Spain
- 3.6. Russia
- 3.7. Benelux
- 3.8. Nordics
- 3.9. Rest of Europe
-
4. Middle East & Africa
- 4.1. Turkey
- 4.2. Israel
- 4.3. GCC
- 4.4. North Africa
- 4.5. South Africa
- 4.6. Rest of Middle East & Africa
-
5. Asia Pacific
- 5.1. China
- 5.2. India
- 5.3. Japan
- 5.4. South Korea
- 5.5. ASEAN
- 5.6. Oceania
- 5.7. Rest of Asia Pacific
Automotive Transmission Drive Chain Regional Market Share
Geographic Coverage of Automotive Transmission Drive Chain
Automotive Transmission Drive Chain REPORT HIGHLIGHTS
| Aspects | Details |
|---|---|
| Study Period | 2020-2034 |
| Base Year | 2025 |
| Estimated Year | 2026 |
| Forecast Period | 2026-2034 |
| Historical Period | 2020-2025 |
| Growth Rate | CAGR of 10.25% from 2020-2034 |
| Segmentation |
|
Table of Contents
- 1. Introduction
- 1.1. Research Scope
- 1.2. Market Segmentation
- 1.3. Research Objective
- 1.4. Definitions and Assumptions
- 2. Executive Summary
- 2.1. Market Snapshot
- 3. Market Dynamics
- 3.1. Market Drivers
- 3.2. Market Restrains
- 3.3. Market Trends
- 3.4. Market Opportunities
- 4. Market Factor Analysis
- 4.1. Porters Five Forces
- 4.1.1. Bargaining Power of Suppliers
- 4.1.2. Bargaining Power of Buyers
- 4.1.3. Threat of New Entrants
- 4.1.4. Threat of Substitutes
- 4.1.5. Competitive Rivalry
- 4.2. PESTEL analysis
- 4.3. BCG Analysis
- 4.3.1. Stars (High Growth, High Market Share)
- 4.3.2. Cash Cows (Low Growth, High Market Share)
- 4.3.3. Question Mark (High Growth, Low Market Share)
- 4.3.4. Dogs (Low Growth, Low Market Share)
- 4.4. Ansoff Matrix Analysis
- 4.5. Supply Chain Analysis
- 4.6. Regulatory Landscape
- 4.7. Current Market Potential and Opportunity Assessment (TAM–SAM–SOM Framework)
- 4.8. IMR Analyst Note
- 4.1. Porters Five Forces
- 5. Market Analysis, Insights and Forecast 2021-2033
- 5.1. Market Analysis, Insights and Forecast - by Application
- 5.1.1. Passenger Cars
- 5.1.2. Commercial Vehicles
- 5.2. Market Analysis, Insights and Forecast - by Types
- 5.2.1. Roller Chain
- 5.2.2. Leaf Chain
- 5.2.3. Flat-Top Chain
- 5.2.4. Others
- 5.3. Market Analysis, Insights and Forecast - by Region
- 5.3.1. North America
- 5.3.2. South America
- 5.3.3. Europe
- 5.3.4. Middle East & Africa
- 5.3.5. Asia Pacific
- 5.1. Market Analysis, Insights and Forecast - by Application
- 6. Global Automotive Transmission Drive Chain Analysis, Insights and Forecast, 2021-2033
- 6.1. Market Analysis, Insights and Forecast - by Application
- 6.1.1. Passenger Cars
- 6.1.2. Commercial Vehicles
- 6.2. Market Analysis, Insights and Forecast - by Types
- 6.2.1. Roller Chain
- 6.2.2. Leaf Chain
- 6.2.3. Flat-Top Chain
- 6.2.4. Others
- 6.1. Market Analysis, Insights and Forecast - by Application
- 7. North America Automotive Transmission Drive Chain Analysis, Insights and Forecast, 2020-2032
- 7.1. Market Analysis, Insights and Forecast - by Application
- 7.1.1. Passenger Cars
- 7.1.2. Commercial Vehicles
- 7.2. Market Analysis, Insights and Forecast - by Types
- 7.2.1. Roller Chain
- 7.2.2. Leaf Chain
- 7.2.3. Flat-Top Chain
- 7.2.4. Others
- 7.1. Market Analysis, Insights and Forecast - by Application
- 8. South America Automotive Transmission Drive Chain Analysis, Insights and Forecast, 2020-2032
- 8.1. Market Analysis, Insights and Forecast - by Application
- 8.1.1. Passenger Cars
- 8.1.2. Commercial Vehicles
- 8.2. Market Analysis, Insights and Forecast - by Types
- 8.2.1. Roller Chain
- 8.2.2. Leaf Chain
- 8.2.3. Flat-Top Chain
- 8.2.4. Others
- 8.1. Market Analysis, Insights and Forecast - by Application
- 9. Europe Automotive Transmission Drive Chain Analysis, Insights and Forecast, 2020-2032
- 9.1. Market Analysis, Insights and Forecast - by Application
- 9.1.1. Passenger Cars
- 9.1.2. Commercial Vehicles
- 9.2. Market Analysis, Insights and Forecast - by Types
- 9.2.1. Roller Chain
- 9.2.2. Leaf Chain
- 9.2.3. Flat-Top Chain
- 9.2.4. Others
- 9.1. Market Analysis, Insights and Forecast - by Application
- 10. Middle East & Africa Automotive Transmission Drive Chain Analysis, Insights and Forecast, 2020-2032
- 10.1. Market Analysis, Insights and Forecast - by Application
- 10.1.1. Passenger Cars
- 10.1.2. Commercial Vehicles
- 10.2. Market Analysis, Insights and Forecast - by Types
- 10.2.1. Roller Chain
- 10.2.2. Leaf Chain
- 10.2.3. Flat-Top Chain
- 10.2.4. Others
- 10.1. Market Analysis, Insights and Forecast - by Application
- 11. Asia Pacific Automotive Transmission Drive Chain Analysis, Insights and Forecast, 2020-2032
- 11.1. Market Analysis, Insights and Forecast - by Application
- 11.1.1. Passenger Cars
- 11.1.2. Commercial Vehicles
- 11.2. Market Analysis, Insights and Forecast - by Types
- 11.2.1. Roller Chain
- 11.2.2. Leaf Chain
- 11.2.3. Flat-Top Chain
- 11.2.4. Others
- 11.1. Market Analysis, Insights and Forecast - by Application
- 12. Competitive Analysis
- 12.1. Company Profiles
- 12.1.1 BorgWarner Morse Systems (USA)
- 12.1.1.1. Company Overview
- 12.1.1.2. Products
- 12.1.1.3. Company Financials
- 12.1.1.4. SWOT Analysis
- 12.1.2 ContiTech North America (USA)
- 12.1.2.1. Company Overview
- 12.1.2.2. Products
- 12.1.2.3. Company Financials
- 12.1.2.4. SWOT Analysis
- 12.1.3 ContiTech (Germany)
- 12.1.3.1. Company Overview
- 12.1.3.2. Products
- 12.1.3.3. Company Financials
- 12.1.3.4. SWOT Analysis
- 12.1.4 CZ a.s. divize Auto (Czech Republic)
- 12.1.4.1. Company Overview
- 12.1.4.2. Products
- 12.1.4.3. Company Financials
- 12.1.4.4. SWOT Analysis
- 12.1.5 Daido Sittipol (Thailand)
- 12.1.5.1. Company Overview
- 12.1.5.2. Products
- 12.1.5.3. Company Financials
- 12.1.5.4. SWOT Analysis
- 12.1.6 Dayco (USA)
- 12.1.6.1. Company Overview
- 12.1.6.2. Products
- 12.1.6.3. Company Financials
- 12.1.6.4. SWOT Analysis
- 12.1.7 Daytec (Brazil)
- 12.1.7.1. Company Overview
- 12.1.7.2. Products
- 12.1.7.3. Company Financials
- 12.1.7.4. SWOT Analysis
- 12.1.8 Dimo Castings (India)
- 12.1.8.1. Company Overview
- 12.1.8.2. Products
- 12.1.8.3. Company Financials
- 12.1.8.4. SWOT Analysis
- 12.1.9 Forbo Siegling (Mexico)
- 12.1.9.1. Company Overview
- 12.1.9.2. Products
- 12.1.9.3. Company Financials
- 12.1.9.4. SWOT Analysis
- 12.1.10 Forjanor (Spain)
- 12.1.10.1. Company Overview
- 12.1.10.2. Products
- 12.1.10.3. Company Financials
- 12.1.10.4. SWOT Analysis
- 12.1.11 Gaotang Jinxiang Auto Parts (China)
- 12.1.11.1. Company Overview
- 12.1.11.2. Products
- 12.1.11.3. Company Financials
- 12.1.11.4. SWOT Analysis
- 12.1.12 Jiaxing Hexin Automotive Parts (China)
- 12.1.12.1. Company Overview
- 12.1.12.2. Products
- 12.1.12.3. Company Financials
- 12.1.12.4. SWOT Analysis
- 12.1.13 Kee Fatt Industries (Malaysia)
- 12.1.13.1. Company Overview
- 12.1.13.2. Products
- 12.1.13.3. Company Financials
- 12.1.13.4. SWOT Analysis
- 12.1.14 L.G.Balakrishnan & Bros (India)
- 12.1.14.1. Company Overview
- 12.1.14.2. Products
- 12.1.14.3. Company Financials
- 12.1.14.4. SWOT Analysis
- 12.1.15 New Contiland Manufacturing (China)
- 12.1.15.1. Company Overview
- 12.1.15.2. Products
- 12.1.15.3. Company Financials
- 12.1.15.4. SWOT Analysis
- 12.1.16 Renold (Germany)
- 12.1.16.1. Company Overview
- 12.1.16.2. Products
- 12.1.16.3. Company Financials
- 12.1.16.4. SWOT Analysis
- 12.1.17 Star Transmission (Romania)
- 12.1.17.1. Company Overview
- 12.1.17.2. Products
- 12.1.17.3. Company Financials
- 12.1.17.4. SWOT Analysis
- 12.1.18 Suzhou Universal Group (China)
- 12.1.18.1. Company Overview
- 12.1.18.2. Products
- 12.1.18.3. Company Financials
- 12.1.18.4. SWOT Analysis
- 12.1.19 Thermoid (USA)
- 12.1.19.1. Company Overview
- 12.1.19.2. Products
- 12.1.19.3. Company Financials
- 12.1.19.4. SWOT Analysis
- 12.1.20 TIC ROULUNDS (Italy)
- 12.1.20.1. Company Overview
- 12.1.20.2. Products
- 12.1.20.3. Company Financials
- 12.1.20.4. SWOT Analysis
- 12.1.21 Zhoushan Aosheng Auto Transmission Belt Manufacturing (China)
- 12.1.21.1. Company Overview
- 12.1.21.2. Products
- 12.1.21.3. Company Financials
- 12.1.21.4. SWOT Analysis
- 12.1.1 BorgWarner Morse Systems (USA)
- 12.2. Market Entropy
- 12.2.1 Company's Key Areas Served
- 12.2.2 Recent Developments
- 12.3. Company Market Share Analysis 2025
- 12.3.1 Top 5 Companies Market Share Analysis
- 12.3.2 Top 3 Companies Market Share Analysis
- 12.4. List of Potential Customers
- 13. Research Methodology
List of Figures
- Figure 1: Global Automotive Transmission Drive Chain Revenue Breakdown (billion, %) by Region 2025 & 2033
- Figure 2: North America Automotive Transmission Drive Chain Revenue (billion), by Application 2025 & 2033
- Figure 3: North America Automotive Transmission Drive Chain Revenue Share (%), by Application 2025 & 2033
- Figure 4: North America Automotive Transmission Drive Chain Revenue (billion), by Types 2025 & 2033
- Figure 5: North America Automotive Transmission Drive Chain Revenue Share (%), by Types 2025 & 2033
- Figure 6: North America Automotive Transmission Drive Chain Revenue (billion), by Country 2025 & 2033
- Figure 7: North America Automotive Transmission Drive Chain Revenue Share (%), by Country 2025 & 2033
- Figure 8: South America Automotive Transmission Drive Chain Revenue (billion), by Application 2025 & 2033
- Figure 9: South America Automotive Transmission Drive Chain Revenue Share (%), by Application 2025 & 2033
- Figure 10: South America Automotive Transmission Drive Chain Revenue (billion), by Types 2025 & 2033
- Figure 11: South America Automotive Transmission Drive Chain Revenue Share (%), by Types 2025 & 2033
- Figure 12: South America Automotive Transmission Drive Chain Revenue (billion), by Country 2025 & 2033
- Figure 13: South America Automotive Transmission Drive Chain Revenue Share (%), by Country 2025 & 2033
- Figure 14: Europe Automotive Transmission Drive Chain Revenue (billion), by Application 2025 & 2033
- Figure 15: Europe Automotive Transmission Drive Chain Revenue Share (%), by Application 2025 & 2033
- Figure 16: Europe Automotive Transmission Drive Chain Revenue (billion), by Types 2025 & 2033
- Figure 17: Europe Automotive Transmission Drive Chain Revenue Share (%), by Types 2025 & 2033
- Figure 18: Europe Automotive Transmission Drive Chain Revenue (billion), by Country 2025 & 2033
- Figure 19: Europe Automotive Transmission Drive Chain Revenue Share (%), by Country 2025 & 2033
- Figure 20: Middle East & Africa Automotive Transmission Drive Chain Revenue (billion), by Application 2025 & 2033
- Figure 21: Middle East & Africa Automotive Transmission Drive Chain Revenue Share (%), by Application 2025 & 2033
- Figure 22: Middle East & Africa Automotive Transmission Drive Chain Revenue (billion), by Types 2025 & 2033
- Figure 23: Middle East & Africa Automotive Transmission Drive Chain Revenue Share (%), by Types 2025 & 2033
- Figure 24: Middle East & Africa Automotive Transmission Drive Chain Revenue (billion), by Country 2025 & 2033
- Figure 25: Middle East & Africa Automotive Transmission Drive Chain Revenue Share (%), by Country 2025 & 2033
- Figure 26: Asia Pacific Automotive Transmission Drive Chain Revenue (billion), by Application 2025 & 2033
- Figure 27: Asia Pacific Automotive Transmission Drive Chain Revenue Share (%), by Application 2025 & 2033
- Figure 28: Asia Pacific Automotive Transmission Drive Chain Revenue (billion), by Types 2025 & 2033
- Figure 29: Asia Pacific Automotive Transmission Drive Chain Revenue Share (%), by Types 2025 & 2033
- Figure 30: Asia Pacific Automotive Transmission Drive Chain Revenue (billion), by Country 2025 & 2033
- Figure 31: Asia Pacific Automotive Transmission Drive Chain Revenue Share (%), by Country 2025 & 2033
List of Tables
- Table 1: Global Automotive Transmission Drive Chain Revenue billion Forecast, by Application 2020 & 2033
- Table 2: Global Automotive Transmission Drive Chain Revenue billion Forecast, by Types 2020 & 2033
- Table 3: Global Automotive Transmission Drive Chain Revenue billion Forecast, by Region 2020 & 2033
- Table 4: Global Automotive Transmission Drive Chain Revenue billion Forecast, by Application 2020 & 2033
- Table 5: Global Automotive Transmission Drive Chain Revenue billion Forecast, by Types 2020 & 2033
- Table 6: Global Automotive Transmission Drive Chain Revenue billion Forecast, by Country 2020 & 2033
- Table 7: United States Automotive Transmission Drive Chain Revenue (billion) Forecast, by Application 2020 & 2033
- Table 8: Canada Automotive Transmission Drive Chain Revenue (billion) Forecast, by Application 2020 & 2033
- Table 9: Mexico Automotive Transmission Drive Chain Revenue (billion) Forecast, by Application 2020 & 2033
- Table 10: Global Automotive Transmission Drive Chain Revenue billion Forecast, by Application 2020 & 2033
- Table 11: Global Automotive Transmission Drive Chain Revenue billion Forecast, by Types 2020 & 2033
- Table 12: Global Automotive Transmission Drive Chain Revenue billion Forecast, by Country 2020 & 2033
- Table 13: Brazil Automotive Transmission Drive Chain Revenue (billion) Forecast, by Application 2020 & 2033
- Table 14: Argentina Automotive Transmission Drive Chain Revenue (billion) Forecast, by Application 2020 & 2033
- Table 15: Rest of South America Automotive Transmission Drive Chain Revenue (billion) Forecast, by Application 2020 & 2033
- Table 16: Global Automotive Transmission Drive Chain Revenue billion Forecast, by Application 2020 & 2033
- Table 17: Global Automotive Transmission Drive Chain Revenue billion Forecast, by Types 2020 & 2033
- Table 18: Global Automotive Transmission Drive Chain Revenue billion Forecast, by Country 2020 & 2033
- Table 19: United Kingdom Automotive Transmission Drive Chain Revenue (billion) Forecast, by Application 2020 & 2033
- Table 20: Germany Automotive Transmission Drive Chain Revenue (billion) Forecast, by Application 2020 & 2033
- Table 21: France Automotive Transmission Drive Chain Revenue (billion) Forecast, by Application 2020 & 2033
- Table 22: Italy Automotive Transmission Drive Chain Revenue (billion) Forecast, by Application 2020 & 2033
- Table 23: Spain Automotive Transmission Drive Chain Revenue (billion) Forecast, by Application 2020 & 2033
- Table 24: Russia Automotive Transmission Drive Chain Revenue (billion) Forecast, by Application 2020 & 2033
- Table 25: Benelux Automotive Transmission Drive Chain Revenue (billion) Forecast, by Application 2020 & 2033
- Table 26: Nordics Automotive Transmission Drive Chain Revenue (billion) Forecast, by Application 2020 & 2033
- Table 27: Rest of Europe Automotive Transmission Drive Chain Revenue (billion) Forecast, by Application 2020 & 2033
- Table 28: Global Automotive Transmission Drive Chain Revenue billion Forecast, by Application 2020 & 2033
- Table 29: Global Automotive Transmission Drive Chain Revenue billion Forecast, by Types 2020 & 2033
- Table 30: Global Automotive Transmission Drive Chain Revenue billion Forecast, by Country 2020 & 2033
- Table 31: Turkey Automotive Transmission Drive Chain Revenue (billion) Forecast, by Application 2020 & 2033
- Table 32: Israel Automotive Transmission Drive Chain Revenue (billion) Forecast, by Application 2020 & 2033
- Table 33: GCC Automotive Transmission Drive Chain Revenue (billion) Forecast, by Application 2020 & 2033
- Table 34: North Africa Automotive Transmission Drive Chain Revenue (billion) Forecast, by Application 2020 & 2033
- Table 35: South Africa Automotive Transmission Drive Chain Revenue (billion) Forecast, by Application 2020 & 2033
- Table 36: Rest of Middle East & Africa Automotive Transmission Drive Chain Revenue (billion) Forecast, by Application 2020 & 2033
- Table 37: Global Automotive Transmission Drive Chain Revenue billion Forecast, by Application 2020 & 2033
- Table 38: Global Automotive Transmission Drive Chain Revenue billion Forecast, by Types 2020 & 2033
- Table 39: Global Automotive Transmission Drive Chain Revenue billion Forecast, by Country 2020 & 2033
- Table 40: China Automotive Transmission Drive Chain Revenue (billion) Forecast, by Application 2020 & 2033
- Table 41: India Automotive Transmission Drive Chain Revenue (billion) Forecast, by Application 2020 & 2033
- Table 42: Japan Automotive Transmission Drive Chain Revenue (billion) Forecast, by Application 2020 & 2033
- Table 43: South Korea Automotive Transmission Drive Chain Revenue (billion) Forecast, by Application 2020 & 2033
- Table 44: ASEAN Automotive Transmission Drive Chain Revenue (billion) Forecast, by Application 2020 & 2033
- Table 45: Oceania Automotive Transmission Drive Chain Revenue (billion) Forecast, by Application 2020 & 2033
- Table 46: Rest of Asia Pacific Automotive Transmission Drive Chain Revenue (billion) Forecast, by Application 2020 & 2033
Frequently Asked Questions
1. What is the projected Compound Annual Growth Rate (CAGR) of the Automotive Transmission Drive Chain?
The projected CAGR is approximately 10.25%.
2. Which companies are prominent players in the Automotive Transmission Drive Chain?
Key companies in the market include BorgWarner Morse Systems (USA), ContiTech North America (USA), ContiTech (Germany), CZ a.s. divize Auto (Czech Republic), Daido Sittipol (Thailand), Dayco (USA), Daytec (Brazil), Dimo Castings (India), Forbo Siegling (Mexico), Forjanor (Spain), Gaotang Jinxiang Auto Parts (China), Jiaxing Hexin Automotive Parts (China), Kee Fatt Industries (Malaysia), L.G.Balakrishnan & Bros (India), New Contiland Manufacturing (China), Renold (Germany), Star Transmission (Romania), Suzhou Universal Group (China), Thermoid (USA), TIC ROULUNDS (Italy), Zhoushan Aosheng Auto Transmission Belt Manufacturing (China).
3. What are the main segments of the Automotive Transmission Drive Chain?
The market segments include Application, Types.
4. Can you provide details about the market size?
The market size is estimated to be USD 183.5 billion as of 2022.
5. What are some drivers contributing to market growth?
N/A
6. What are the notable trends driving market growth?
N/A
7. Are there any restraints impacting market growth?
N/A
8. Can you provide examples of recent developments in the market?
N/A
9. What pricing options are available for accessing the report?
Pricing options include single-user, multi-user, and enterprise licenses priced at USD 2900.00, USD 4350.00, and USD 5800.00 respectively.
10. Is the market size provided in terms of value or volume?
The market size is provided in terms of value, measured in billion.
11. Are there any specific market keywords associated with the report?
Yes, the market keyword associated with the report is "Automotive Transmission Drive Chain," which aids in identifying and referencing the specific market segment covered.
12. How do I determine which pricing option suits my needs best?
The pricing options vary based on user requirements and access needs. Individual users may opt for single-user licenses, while businesses requiring broader access may choose multi-user or enterprise licenses for cost-effective access to the report.
13. Are there any additional resources or data provided in the Automotive Transmission Drive Chain report?
While the report offers comprehensive insights, it's advisable to review the specific contents or supplementary materials provided to ascertain if additional resources or data are available.
14. How can I stay updated on further developments or reports in the Automotive Transmission Drive Chain?
To stay informed about further developments, trends, and reports in the Automotive Transmission Drive Chain, consider subscribing to industry newsletters, following relevant companies and organizations, or regularly checking reputable industry news sources and publications.
Methodology
Step 1 - Identification of Relevant Samples Size from Population Database


Step 2 - Approaches for Defining Global Market Size (Value, Volume* & Price*)

Note*: In applicable scenarios
Step 3 - Data Sources
Primary Research
- Web Analytics
- Survey Reports
- Research Institute
- Latest Research Reports
- Opinion Leaders
Secondary Research
- Annual Reports
- White Paper
- Latest Press Release
- Industry Association
- Paid Database
- Investor Presentations

Step 4 - Data Triangulation
Involves using different sources of information in order to increase the validity of a study
These sources are likely to be stakeholders in a program - participants, other researchers, program staff, other community members, and so on.
Then we put all data in single framework & apply various statistical tools to find out the dynamic on the market.
During the analysis stage, feedback from the stakeholder groups would be compared to determine areas of agreement as well as areas of divergence