

Key Insights
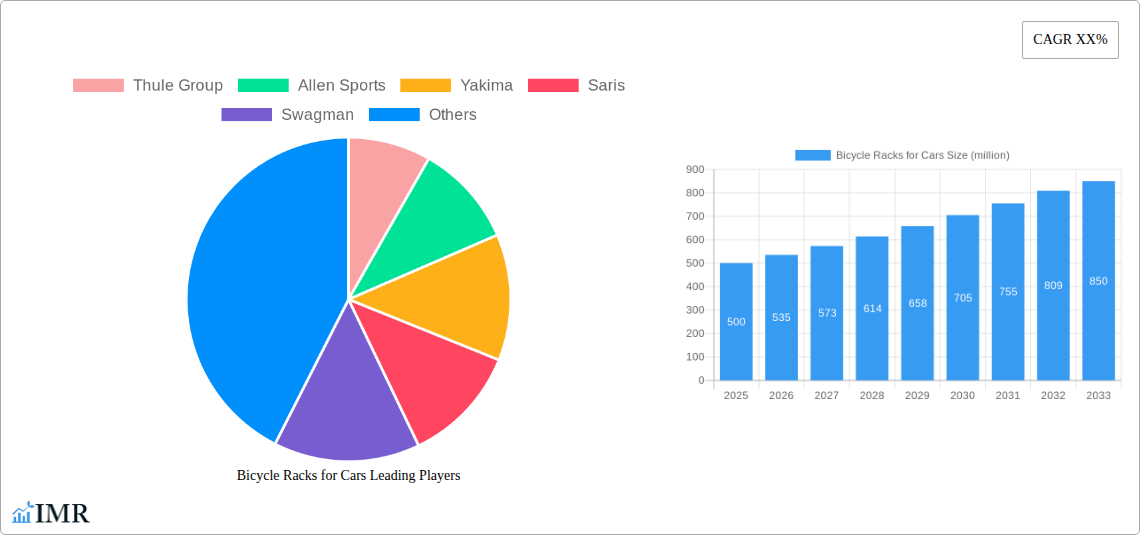
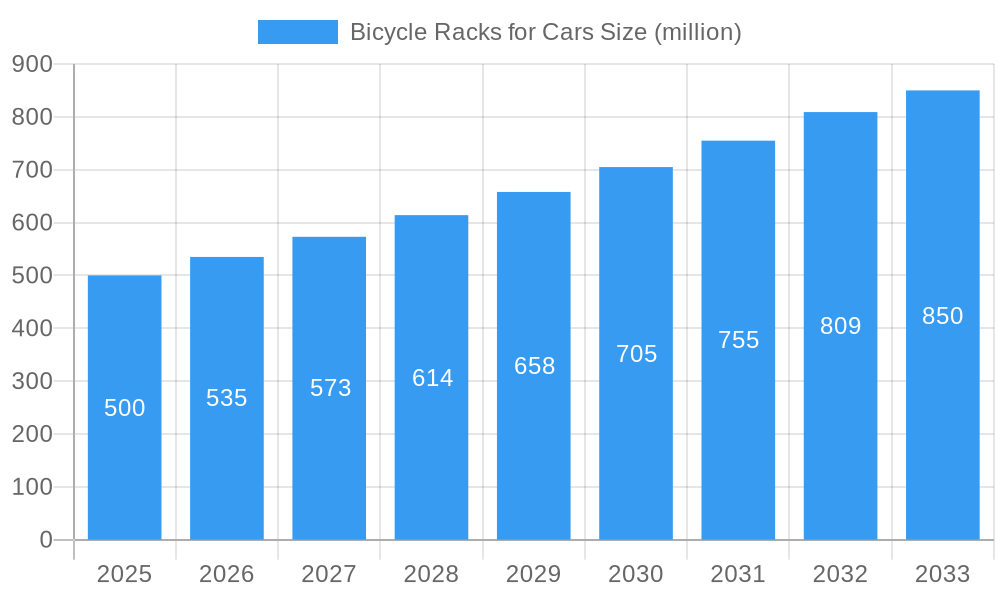
The global market for bicycle racks for cars is experiencing robust growth, driven by a surge in cycling popularity and increased outdoor recreational activities. The market, estimated at $500 million in 2025, is projected to witness a Compound Annual Growth Rate (CAGR) of 7% from 2025 to 2033, reaching approximately $850 million by 2033. This expansion is fueled by several key factors. The rising awareness of health and fitness benefits associated with cycling is encouraging more people to adopt cycling as a mode of transportation and recreation. Furthermore, increasing disposable incomes, particularly in developing economies, are empowering consumers to invest in high-quality bicycle racks and accessories. Government initiatives promoting cycling infrastructure and eco-friendly transportation also contribute to market growth. The market is segmented based on rack type (roof-mounted, hitch-mounted, trunk-mounted), material (aluminum, steel, others), and bicycle capacity. Key players such as Thule Group, Yakima, and Saris dominate the market, leveraging their strong brand reputation and extensive distribution networks.
Bicycle Racks for Cars Market Size (In Million)
However, the market also faces some challenges. Fluctuating raw material prices, particularly for steel and aluminum, can impact production costs and profitability. The increasing popularity of e-bikes presents both an opportunity and a challenge, as specialized racks are required to accommodate their heavier weight and unique design features. Furthermore, competition from smaller, niche players offering innovative and cost-effective solutions necessitates ongoing innovation and adaptation by established brands. Despite these restraints, the overall outlook for the bicycle racks for cars market remains positive, with substantial growth potential across different regions, driven by escalating consumer demand for convenient and safe bicycle transportation solutions. Market segmentation strategies focusing on specific customer needs, coupled with strategic partnerships and technological advancements, will be crucial for continued success in this dynamic market.
Bicycle Racks for Cars Company Market Share
Bicycle Racks for Cars Market Report: 2019-2033
This comprehensive report provides an in-depth analysis of the Bicycle Racks for Cars market, encompassing market dynamics, growth trends, regional segmentation, product landscape, key players, and future outlook. The study period covers 2019-2033, with a base year of 2025 and a forecast period of 2025-2033. This report is essential for industry professionals, investors, and anyone seeking a detailed understanding of this dynamic market segment within the broader automotive accessories and cycling equipment industries.
Target Audience: Automotive accessory manufacturers, bicycle component suppliers, retailers, distributors, investors, market research firms, and government agencies.
Bicycle Racks for Cars Market Dynamics & Structure
The Bicycle Racks for Cars market is characterized by a moderately concentrated landscape with key players like Thule Group, Allen Sports, Yakima, Saris, Swagman, Hollywood Racks, and Graber holding significant market share. Technological innovation, driven by advancements in materials science and design, is a primary growth driver. Stringent safety regulations regarding bike rack installation and usage influence market dynamics. Competitive substitutes include roof-mounted carriers and truck bed racks. The end-user demographic encompasses a diverse range of consumers, from casual cyclists to avid outdoor enthusiasts. Consolidation through mergers and acquisitions (M&A) activity has been moderate in recent years; with xx million units of M&A deals recorded between 2019 and 2024.
- Market Concentration: Moderately concentrated, with top 7 players holding xx% market share in 2025.
- Technological Innovation: Focus on lightweight materials (e.g., aluminum, carbon fiber), improved aerodynamic designs, and enhanced ease of installation.
- Regulatory Frameworks: Safety standards and regulations governing bike rack installation and usage vary across regions, influencing product design and market access.
- Competitive Substitutes: Roof-mounted carriers, truck bed racks, and trailer-based systems offer alternatives.
- End-User Demographics: Diverse, encompassing families, individual cyclists, and professional athletes.
- M&A Trends: Moderate activity, with xx million units of deals completed between 2019 and 2024. Future activity is expected to increase by xx% over the forecast period.
Bicycle Racks for Cars Growth Trends & Insights
The Bicycle Racks for Cars market exhibits a robust growth trajectory, fueled by rising participation in cycling activities, increasing disposable income, and growing demand for convenient transportation solutions. Market size, measured in million units shipped, experienced a CAGR of xx% during the historical period (2019-2024), reaching xx million units in 2024. Technological disruptions, including the introduction of more user-friendly and versatile designs, are driving adoption rates. Consumer behavior shifts towards eco-friendly commuting and outdoor recreation are further stimulating market growth. Market penetration remains relatively low, suggesting significant future growth potential. The forecasted CAGR for 2025-2033 is xx%, with the market expected to reach xx million units by 2033. Factors influencing adoption include price sensitivity, ease of installation and usage, and perceived safety features.
Dominant Regions, Countries, or Segments in Bicycle Racks for Cars
North America currently dominates the Bicycle Racks for Cars market, driven by high cycling participation rates, strong consumer spending power, and well-developed infrastructure. Europe holds a significant share and is exhibiting steady growth, while the Asia-Pacific region showcases substantial growth potential due to rising disposable incomes and urbanization. Specific countries like the US, Germany, and China are key market drivers.
- North America: Strong consumer demand, well-established distribution networks, and high cycling participation.
- Europe: Steady growth propelled by increasing cycling infrastructure and environmental awareness.
- Asia-Pacific: High growth potential due to rising disposable incomes, urbanization, and government initiatives promoting cycling.
Bicycle Racks for Cars Product Landscape
The market offers a diverse range of products, categorized by mounting style (e.g., hitch-mounted, roof-mounted, trunk-mounted), bike capacity, and material. Innovations focus on enhanced safety features, improved aerodynamics, and ease of use. Premium models often incorporate features such as anti-theft mechanisms and integrated lighting. Key performance metrics include weight capacity, ease of installation, and aerodynamic efficiency.
Key Drivers, Barriers & Challenges in Bicycle Racks for Cars
Key Drivers:
- Rising popularity of cycling and outdoor activities.
- Increasing disposable incomes in developed and emerging economies.
- Government initiatives promoting cycling as a sustainable transportation mode.
- Advances in materials and design leading to lighter, more durable products.
Key Challenges:
- Price sensitivity among consumers, particularly in price-sensitive markets.
- Potential for vehicle damage if racks are improperly installed or used.
- Competition from alternative transportation solutions (e.g., public transport, ride-sharing).
- Supply chain disruptions impacting manufacturing and distribution. This resulted in a xx% increase in prices in 2022.
Emerging Opportunities in Bicycle Racks for Cars
- Expansion into emerging markets with growing cycling infrastructure and disposable income.
- Development of innovative designs suited to e-bikes and cargo bikes.
- Customization options to cater to specific vehicle models and cycling needs.
- Integration of smart technology, such as GPS tracking and remote locking systems.
Growth Accelerators in the Bicycle Racks for Cars Industry
Strategic partnerships between bicycle rack manufacturers and automotive companies are accelerating market growth, enabling seamless integration and wider distribution. Technological breakthroughs, particularly in materials science and design, are paving the way for lighter, stronger, and more aerodynamic products. Expansion into new markets and product diversification further boost market expansion.
Key Players Shaping the Bicycle Racks for Cars Market
- Thule Group
- Allen Sports
- Yakima
- Saris
- Swagman
- Hollywood Racks
- Graber
Notable Milestones in Bicycle Racks for Cars Sector
- 2020: Thule Group launches a new line of lightweight aluminum bike racks.
- 2021: Saris introduces a smart bike rack with integrated locking system.
- 2022: Yakima acquires a smaller competitor, expanding its product portfolio.
In-Depth Bicycle Racks for Cars Market Outlook
The Bicycle Racks for Cars market is poised for sustained growth, driven by ongoing technological innovations, increasing consumer demand for recreational and eco-friendly transportation, and expansion into new markets. Strategic partnerships and product diversification will further fuel market expansion, providing significant opportunities for established players and new entrants alike. The market is expected to reach xx million units by 2033, representing considerable growth potential.
Bicycle Racks for Cars Segmentation
-
1. Application
- 1.1. Personal Use
- 1.2. Commercial Use
-
2. Types
- 2.1. Roof Bike Racks
- 2.2. Hitch Bike Racks
- 2.3. Trunk Bike Racks
- 2.4. Truck Bed Bike Racks
Bicycle Racks for Cars Segmentation By Geography
-
1. North America
- 1.1. United States
- 1.2. Canada
- 1.3. Mexico
-
2. South America
- 2.1. Brazil
- 2.2. Argentina
- 2.3. Rest of South America
-
3. Europe
- 3.1. United Kingdom
- 3.2. Germany
- 3.3. France
- 3.4. Italy
- 3.5. Spain
- 3.6. Russia
- 3.7. Benelux
- 3.8. Nordics
- 3.9. Rest of Europe
-
4. Middle East & Africa
- 4.1. Turkey
- 4.2. Israel
- 4.3. GCC
- 4.4. North Africa
- 4.5. South Africa
- 4.6. Rest of Middle East & Africa
-
5. Asia Pacific
- 5.1. China
- 5.2. India
- 5.3. Japan
- 5.4. South Korea
- 5.5. ASEAN
- 5.6. Oceania
- 5.7. Rest of Asia Pacific

Bicycle Racks for Cars Regional Market Share
Geographic Coverage of Bicycle Racks for Cars
Bicycle Racks for Cars REPORT HIGHLIGHTS
| Aspects | Details |
|---|---|
| Study Period | 2020-2034 |
| Base Year | 2025 |
| Estimated Year | 2026 |
| Forecast Period | 2026-2034 |
| Historical Period | 2020-2025 |
| Growth Rate | CAGR of 5.6% from 2020-2034 |
| Segmentation |
|
Table of Contents
- 1. Introduction
- 1.1. Research Scope
- 1.2. Market Segmentation
- 1.3. Research Objective
- 1.4. Definitions and Assumptions
- 2. Executive Summary
- 2.1. Market Snapshot
- 3. Market Dynamics
- 3.1. Market Drivers
- 3.2. Market Restrains
- 3.3. Market Trends
- 3.4. Market Opportunities
- 4. Market Factor Analysis
- 4.1. Porters Five Forces
- 4.1.1. Bargaining Power of Suppliers
- 4.1.2. Bargaining Power of Buyers
- 4.1.3. Threat of New Entrants
- 4.1.4. Threat of Substitutes
- 4.1.5. Competitive Rivalry
- 4.2. PESTEL analysis
- 4.3. BCG Analysis
- 4.3.1. Stars (High Growth, High Market Share)
- 4.3.2. Cash Cows (Low Growth, High Market Share)
- 4.3.3. Question Mark (High Growth, Low Market Share)
- 4.3.4. Dogs (Low Growth, Low Market Share)
- 4.4. Ansoff Matrix Analysis
- 4.5. Supply Chain Analysis
- 4.6. Regulatory Landscape
- 4.7. Current Market Potential and Opportunity Assessment (TAM–SAM–SOM Framework)
- 4.8. IMR Analyst Note
- 4.1. Porters Five Forces
- 5. Market Analysis, Insights and Forecast 2021-2033
- 5.1. Market Analysis, Insights and Forecast - by Application
- 5.1.1. Personal Use
- 5.1.2. Commercial Use
- 5.2. Market Analysis, Insights and Forecast - by Types
- 5.2.1. Roof Bike Racks
- 5.2.2. Hitch Bike Racks
- 5.2.3. Trunk Bike Racks
- 5.2.4. Truck Bed Bike Racks
- 5.3. Market Analysis, Insights and Forecast - by Region
- 5.3.1. North America
- 5.3.2. South America
- 5.3.3. Europe
- 5.3.4. Middle East & Africa
- 5.3.5. Asia Pacific
- 5.1. Market Analysis, Insights and Forecast - by Application
- 6. Global Bicycle Racks for Cars Analysis, Insights and Forecast, 2021-2033
- 6.1. Market Analysis, Insights and Forecast - by Application
- 6.1.1. Personal Use
- 6.1.2. Commercial Use
- 6.2. Market Analysis, Insights and Forecast - by Types
- 6.2.1. Roof Bike Racks
- 6.2.2. Hitch Bike Racks
- 6.2.3. Trunk Bike Racks
- 6.2.4. Truck Bed Bike Racks
- 6.1. Market Analysis, Insights and Forecast - by Application
- 7. North America Bicycle Racks for Cars Analysis, Insights and Forecast, 2020-2032
- 7.1. Market Analysis, Insights and Forecast - by Application
- 7.1.1. Personal Use
- 7.1.2. Commercial Use
- 7.2. Market Analysis, Insights and Forecast - by Types
- 7.2.1. Roof Bike Racks
- 7.2.2. Hitch Bike Racks
- 7.2.3. Trunk Bike Racks
- 7.2.4. Truck Bed Bike Racks
- 7.1. Market Analysis, Insights and Forecast - by Application
- 8. South America Bicycle Racks for Cars Analysis, Insights and Forecast, 2020-2032
- 8.1. Market Analysis, Insights and Forecast - by Application
- 8.1.1. Personal Use
- 8.1.2. Commercial Use
- 8.2. Market Analysis, Insights and Forecast - by Types
- 8.2.1. Roof Bike Racks
- 8.2.2. Hitch Bike Racks
- 8.2.3. Trunk Bike Racks
- 8.2.4. Truck Bed Bike Racks
- 8.1. Market Analysis, Insights and Forecast - by Application
- 9. Europe Bicycle Racks for Cars Analysis, Insights and Forecast, 2020-2032
- 9.1. Market Analysis, Insights and Forecast - by Application
- 9.1.1. Personal Use
- 9.1.2. Commercial Use
- 9.2. Market Analysis, Insights and Forecast - by Types
- 9.2.1. Roof Bike Racks
- 9.2.2. Hitch Bike Racks
- 9.2.3. Trunk Bike Racks
- 9.2.4. Truck Bed Bike Racks
- 9.1. Market Analysis, Insights and Forecast - by Application
- 10. Middle East & Africa Bicycle Racks for Cars Analysis, Insights and Forecast, 2020-2032
- 10.1. Market Analysis, Insights and Forecast - by Application
- 10.1.1. Personal Use
- 10.1.2. Commercial Use
- 10.2. Market Analysis, Insights and Forecast - by Types
- 10.2.1. Roof Bike Racks
- 10.2.2. Hitch Bike Racks
- 10.2.3. Trunk Bike Racks
- 10.2.4. Truck Bed Bike Racks
- 10.1. Market Analysis, Insights and Forecast - by Application
- 11. Asia Pacific Bicycle Racks for Cars Analysis, Insights and Forecast, 2020-2032
- 11.1. Market Analysis, Insights and Forecast - by Application
- 11.1.1. Personal Use
- 11.1.2. Commercial Use
- 11.2. Market Analysis, Insights and Forecast - by Types
- 11.2.1. Roof Bike Racks
- 11.2.2. Hitch Bike Racks
- 11.2.3. Trunk Bike Racks
- 11.2.4. Truck Bed Bike Racks
- 11.1. Market Analysis, Insights and Forecast - by Application
- 12. Competitive Analysis
- 12.1. Company Profiles
- 12.1.1 Thule Group
- 12.1.1.1. Company Overview
- 12.1.1.2. Products
- 12.1.1.3. Company Financials
- 12.1.1.4. SWOT Analysis
- 12.1.2 Allen Sports
- 12.1.2.1. Company Overview
- 12.1.2.2. Products
- 12.1.2.3. Company Financials
- 12.1.2.4. SWOT Analysis
- 12.1.3 Yakima
- 12.1.3.1. Company Overview
- 12.1.3.2. Products
- 12.1.3.3. Company Financials
- 12.1.3.4. SWOT Analysis
- 12.1.4 Saris
- 12.1.4.1. Company Overview
- 12.1.4.2. Products
- 12.1.4.3. Company Financials
- 12.1.4.4. SWOT Analysis
- 12.1.5 Swagman
- 12.1.5.1. Company Overview
- 12.1.5.2. Products
- 12.1.5.3. Company Financials
- 12.1.5.4. SWOT Analysis
- 12.1.6 Hollywood Racks
- 12.1.6.1. Company Overview
- 12.1.6.2. Products
- 12.1.6.3. Company Financials
- 12.1.6.4. SWOT Analysis
- 12.1.7 Graber
- 12.1.7.1. Company Overview
- 12.1.7.2. Products
- 12.1.7.3. Company Financials
- 12.1.7.4. SWOT Analysis
- 12.1.1 Thule Group
- 12.2. Market Entropy
- 12.2.1 Company's Key Areas Served
- 12.2.2 Recent Developments
- 12.3. Company Market Share Analysis 2025
- 12.3.1 Top 5 Companies Market Share Analysis
- 12.3.2 Top 3 Companies Market Share Analysis
- 12.4. List of Potential Customers
- 13. Research Methodology
List of Figures
- Figure 1: Global Bicycle Racks for Cars Revenue Breakdown (undefined, %) by Region 2025 & 2033
- Figure 2: Global Bicycle Racks for Cars Volume Breakdown (K, %) by Region 2025 & 2033
- Figure 3: North America Bicycle Racks for Cars Revenue (undefined), by Application 2025 & 2033
- Figure 4: North America Bicycle Racks for Cars Volume (K), by Application 2025 & 2033
- Figure 5: North America Bicycle Racks for Cars Revenue Share (%), by Application 2025 & 2033
- Figure 6: North America Bicycle Racks for Cars Volume Share (%), by Application 2025 & 2033
- Figure 7: North America Bicycle Racks for Cars Revenue (undefined), by Types 2025 & 2033
- Figure 8: North America Bicycle Racks for Cars Volume (K), by Types 2025 & 2033
- Figure 9: North America Bicycle Racks for Cars Revenue Share (%), by Types 2025 & 2033
- Figure 10: North America Bicycle Racks for Cars Volume Share (%), by Types 2025 & 2033
- Figure 11: North America Bicycle Racks for Cars Revenue (undefined), by Country 2025 & 2033
- Figure 12: North America Bicycle Racks for Cars Volume (K), by Country 2025 & 2033
- Figure 13: North America Bicycle Racks for Cars Revenue Share (%), by Country 2025 & 2033
- Figure 14: North America Bicycle Racks for Cars Volume Share (%), by Country 2025 & 2033
- Figure 15: South America Bicycle Racks for Cars Revenue (undefined), by Application 2025 & 2033
- Figure 16: South America Bicycle Racks for Cars Volume (K), by Application 2025 & 2033
- Figure 17: South America Bicycle Racks for Cars Revenue Share (%), by Application 2025 & 2033
- Figure 18: South America Bicycle Racks for Cars Volume Share (%), by Application 2025 & 2033
- Figure 19: South America Bicycle Racks for Cars Revenue (undefined), by Types 2025 & 2033
- Figure 20: South America Bicycle Racks for Cars Volume (K), by Types 2025 & 2033
- Figure 21: South America Bicycle Racks for Cars Revenue Share (%), by Types 2025 & 2033
- Figure 22: South America Bicycle Racks for Cars Volume Share (%), by Types 2025 & 2033
- Figure 23: South America Bicycle Racks for Cars Revenue (undefined), by Country 2025 & 2033
- Figure 24: South America Bicycle Racks for Cars Volume (K), by Country 2025 & 2033
- Figure 25: South America Bicycle Racks for Cars Revenue Share (%), by Country 2025 & 2033
- Figure 26: South America Bicycle Racks for Cars Volume Share (%), by Country 2025 & 2033
- Figure 27: Europe Bicycle Racks for Cars Revenue (undefined), by Application 2025 & 2033
- Figure 28: Europe Bicycle Racks for Cars Volume (K), by Application 2025 & 2033
- Figure 29: Europe Bicycle Racks for Cars Revenue Share (%), by Application 2025 & 2033
- Figure 30: Europe Bicycle Racks for Cars Volume Share (%), by Application 2025 & 2033
- Figure 31: Europe Bicycle Racks for Cars Revenue (undefined), by Types 2025 & 2033
- Figure 32: Europe Bicycle Racks for Cars Volume (K), by Types 2025 & 2033
- Figure 33: Europe Bicycle Racks for Cars Revenue Share (%), by Types 2025 & 2033
- Figure 34: Europe Bicycle Racks for Cars Volume Share (%), by Types 2025 & 2033
- Figure 35: Europe Bicycle Racks for Cars Revenue (undefined), by Country 2025 & 2033
- Figure 36: Europe Bicycle Racks for Cars Volume (K), by Country 2025 & 2033
- Figure 37: Europe Bicycle Racks for Cars Revenue Share (%), by Country 2025 & 2033
- Figure 38: Europe Bicycle Racks for Cars Volume Share (%), by Country 2025 & 2033
- Figure 39: Middle East & Africa Bicycle Racks for Cars Revenue (undefined), by Application 2025 & 2033
- Figure 40: Middle East & Africa Bicycle Racks for Cars Volume (K), by Application 2025 & 2033
- Figure 41: Middle East & Africa Bicycle Racks for Cars Revenue Share (%), by Application 2025 & 2033
- Figure 42: Middle East & Africa Bicycle Racks for Cars Volume Share (%), by Application 2025 & 2033
- Figure 43: Middle East & Africa Bicycle Racks for Cars Revenue (undefined), by Types 2025 & 2033
- Figure 44: Middle East & Africa Bicycle Racks for Cars Volume (K), by Types 2025 & 2033
- Figure 45: Middle East & Africa Bicycle Racks for Cars Revenue Share (%), by Types 2025 & 2033
- Figure 46: Middle East & Africa Bicycle Racks for Cars Volume Share (%), by Types 2025 & 2033
- Figure 47: Middle East & Africa Bicycle Racks for Cars Revenue (undefined), by Country 2025 & 2033
- Figure 48: Middle East & Africa Bicycle Racks for Cars Volume (K), by Country 2025 & 2033
- Figure 49: Middle East & Africa Bicycle Racks for Cars Revenue Share (%), by Country 2025 & 2033
- Figure 50: Middle East & Africa Bicycle Racks for Cars Volume Share (%), by Country 2025 & 2033
- Figure 51: Asia Pacific Bicycle Racks for Cars Revenue (undefined), by Application 2025 & 2033
- Figure 52: Asia Pacific Bicycle Racks for Cars Volume (K), by Application 2025 & 2033
- Figure 53: Asia Pacific Bicycle Racks for Cars Revenue Share (%), by Application 2025 & 2033
- Figure 54: Asia Pacific Bicycle Racks for Cars Volume Share (%), by Application 2025 & 2033
- Figure 55: Asia Pacific Bicycle Racks for Cars Revenue (undefined), by Types 2025 & 2033
- Figure 56: Asia Pacific Bicycle Racks for Cars Volume (K), by Types 2025 & 2033
- Figure 57: Asia Pacific Bicycle Racks for Cars Revenue Share (%), by Types 2025 & 2033
- Figure 58: Asia Pacific Bicycle Racks for Cars Volume Share (%), by Types 2025 & 2033
- Figure 59: Asia Pacific Bicycle Racks for Cars Revenue (undefined), by Country 2025 & 2033
- Figure 60: Asia Pacific Bicycle Racks for Cars Volume (K), by Country 2025 & 2033
- Figure 61: Asia Pacific Bicycle Racks for Cars Revenue Share (%), by Country 2025 & 2033
- Figure 62: Asia Pacific Bicycle Racks for Cars Volume Share (%), by Country 2025 & 2033
List of Tables
- Table 1: Global Bicycle Racks for Cars Revenue undefined Forecast, by Application 2020 & 2033
- Table 2: Global Bicycle Racks for Cars Volume K Forecast, by Application 2020 & 2033
- Table 3: Global Bicycle Racks for Cars Revenue undefined Forecast, by Types 2020 & 2033
- Table 4: Global Bicycle Racks for Cars Volume K Forecast, by Types 2020 & 2033
- Table 5: Global Bicycle Racks for Cars Revenue undefined Forecast, by Region 2020 & 2033
- Table 6: Global Bicycle Racks for Cars Volume K Forecast, by Region 2020 & 2033
- Table 7: Global Bicycle Racks for Cars Revenue undefined Forecast, by Application 2020 & 2033
- Table 8: Global Bicycle Racks for Cars Volume K Forecast, by Application 2020 & 2033
- Table 9: Global Bicycle Racks for Cars Revenue undefined Forecast, by Types 2020 & 2033
- Table 10: Global Bicycle Racks for Cars Volume K Forecast, by Types 2020 & 2033
- Table 11: Global Bicycle Racks for Cars Revenue undefined Forecast, by Country 2020 & 2033
- Table 12: Global Bicycle Racks for Cars Volume K Forecast, by Country 2020 & 2033
- Table 13: United States Bicycle Racks for Cars Revenue (undefined) Forecast, by Application 2020 & 2033
- Table 14: United States Bicycle Racks for Cars Volume (K) Forecast, by Application 2020 & 2033
- Table 15: Canada Bicycle Racks for Cars Revenue (undefined) Forecast, by Application 2020 & 2033
- Table 16: Canada Bicycle Racks for Cars Volume (K) Forecast, by Application 2020 & 2033
- Table 17: Mexico Bicycle Racks for Cars Revenue (undefined) Forecast, by Application 2020 & 2033
- Table 18: Mexico Bicycle Racks for Cars Volume (K) Forecast, by Application 2020 & 2033
- Table 19: Global Bicycle Racks for Cars Revenue undefined Forecast, by Application 2020 & 2033
- Table 20: Global Bicycle Racks for Cars Volume K Forecast, by Application 2020 & 2033
- Table 21: Global Bicycle Racks for Cars Revenue undefined Forecast, by Types 2020 & 2033
- Table 22: Global Bicycle Racks for Cars Volume K Forecast, by Types 2020 & 2033
- Table 23: Global Bicycle Racks for Cars Revenue undefined Forecast, by Country 2020 & 2033
- Table 24: Global Bicycle Racks for Cars Volume K Forecast, by Country 2020 & 2033
- Table 25: Brazil Bicycle Racks for Cars Revenue (undefined) Forecast, by Application 2020 & 2033
- Table 26: Brazil Bicycle Racks for Cars Volume (K) Forecast, by Application 2020 & 2033
- Table 27: Argentina Bicycle Racks for Cars Revenue (undefined) Forecast, by Application 2020 & 2033
- Table 28: Argentina Bicycle Racks for Cars Volume (K) Forecast, by Application 2020 & 2033
- Table 29: Rest of South America Bicycle Racks for Cars Revenue (undefined) Forecast, by Application 2020 & 2033
- Table 30: Rest of South America Bicycle Racks for Cars Volume (K) Forecast, by Application 2020 & 2033
- Table 31: Global Bicycle Racks for Cars Revenue undefined Forecast, by Application 2020 & 2033
- Table 32: Global Bicycle Racks for Cars Volume K Forecast, by Application 2020 & 2033
- Table 33: Global Bicycle Racks for Cars Revenue undefined Forecast, by Types 2020 & 2033
- Table 34: Global Bicycle Racks for Cars Volume K Forecast, by Types 2020 & 2033
- Table 35: Global Bicycle Racks for Cars Revenue undefined Forecast, by Country 2020 & 2033
- Table 36: Global Bicycle Racks for Cars Volume K Forecast, by Country 2020 & 2033
- Table 37: United Kingdom Bicycle Racks for Cars Revenue (undefined) Forecast, by Application 2020 & 2033
- Table 38: United Kingdom Bicycle Racks for Cars Volume (K) Forecast, by Application 2020 & 2033
- Table 39: Germany Bicycle Racks for Cars Revenue (undefined) Forecast, by Application 2020 & 2033
- Table 40: Germany Bicycle Racks for Cars Volume (K) Forecast, by Application 2020 & 2033
- Table 41: France Bicycle Racks for Cars Revenue (undefined) Forecast, by Application 2020 & 2033
- Table 42: France Bicycle Racks for Cars Volume (K) Forecast, by Application 2020 & 2033
- Table 43: Italy Bicycle Racks for Cars Revenue (undefined) Forecast, by Application 2020 & 2033
- Table 44: Italy Bicycle Racks for Cars Volume (K) Forecast, by Application 2020 & 2033
- Table 45: Spain Bicycle Racks for Cars Revenue (undefined) Forecast, by Application 2020 & 2033
- Table 46: Spain Bicycle Racks for Cars Volume (K) Forecast, by Application 2020 & 2033
- Table 47: Russia Bicycle Racks for Cars Revenue (undefined) Forecast, by Application 2020 & 2033
- Table 48: Russia Bicycle Racks for Cars Volume (K) Forecast, by Application 2020 & 2033
- Table 49: Benelux Bicycle Racks for Cars Revenue (undefined) Forecast, by Application 2020 & 2033
- Table 50: Benelux Bicycle Racks for Cars Volume (K) Forecast, by Application 2020 & 2033
- Table 51: Nordics Bicycle Racks for Cars Revenue (undefined) Forecast, by Application 2020 & 2033
- Table 52: Nordics Bicycle Racks for Cars Volume (K) Forecast, by Application 2020 & 2033
- Table 53: Rest of Europe Bicycle Racks for Cars Revenue (undefined) Forecast, by Application 2020 & 2033
- Table 54: Rest of Europe Bicycle Racks for Cars Volume (K) Forecast, by Application 2020 & 2033
- Table 55: Global Bicycle Racks for Cars Revenue undefined Forecast, by Application 2020 & 2033
- Table 56: Global Bicycle Racks for Cars Volume K Forecast, by Application 2020 & 2033
- Table 57: Global Bicycle Racks for Cars Revenue undefined Forecast, by Types 2020 & 2033
- Table 58: Global Bicycle Racks for Cars Volume K Forecast, by Types 2020 & 2033
- Table 59: Global Bicycle Racks for Cars Revenue undefined Forecast, by Country 2020 & 2033
- Table 60: Global Bicycle Racks for Cars Volume K Forecast, by Country 2020 & 2033
- Table 61: Turkey Bicycle Racks for Cars Revenue (undefined) Forecast, by Application 2020 & 2033
- Table 62: Turkey Bicycle Racks for Cars Volume (K) Forecast, by Application 2020 & 2033
- Table 63: Israel Bicycle Racks for Cars Revenue (undefined) Forecast, by Application 2020 & 2033
- Table 64: Israel Bicycle Racks for Cars Volume (K) Forecast, by Application 2020 & 2033
- Table 65: GCC Bicycle Racks for Cars Revenue (undefined) Forecast, by Application 2020 & 2033
- Table 66: GCC Bicycle Racks for Cars Volume (K) Forecast, by Application 2020 & 2033
- Table 67: North Africa Bicycle Racks for Cars Revenue (undefined) Forecast, by Application 2020 & 2033
- Table 68: North Africa Bicycle Racks for Cars Volume (K) Forecast, by Application 2020 & 2033
- Table 69: South Africa Bicycle Racks for Cars Revenue (undefined) Forecast, by Application 2020 & 2033
- Table 70: South Africa Bicycle Racks for Cars Volume (K) Forecast, by Application 2020 & 2033
- Table 71: Rest of Middle East & Africa Bicycle Racks for Cars Revenue (undefined) Forecast, by Application 2020 & 2033
- Table 72: Rest of Middle East & Africa Bicycle Racks for Cars Volume (K) Forecast, by Application 2020 & 2033
- Table 73: Global Bicycle Racks for Cars Revenue undefined Forecast, by Application 2020 & 2033
- Table 74: Global Bicycle Racks for Cars Volume K Forecast, by Application 2020 & 2033
- Table 75: Global Bicycle Racks for Cars Revenue undefined Forecast, by Types 2020 & 2033
- Table 76: Global Bicycle Racks for Cars Volume K Forecast, by Types 2020 & 2033
- Table 77: Global Bicycle Racks for Cars Revenue undefined Forecast, by Country 2020 & 2033
- Table 78: Global Bicycle Racks for Cars Volume K Forecast, by Country 2020 & 2033
- Table 79: China Bicycle Racks for Cars Revenue (undefined) Forecast, by Application 2020 & 2033
- Table 80: China Bicycle Racks for Cars Volume (K) Forecast, by Application 2020 & 2033
- Table 81: India Bicycle Racks for Cars Revenue (undefined) Forecast, by Application 2020 & 2033
- Table 82: India Bicycle Racks for Cars Volume (K) Forecast, by Application 2020 & 2033
- Table 83: Japan Bicycle Racks for Cars Revenue (undefined) Forecast, by Application 2020 & 2033
- Table 84: Japan Bicycle Racks for Cars Volume (K) Forecast, by Application 2020 & 2033
- Table 85: South Korea Bicycle Racks for Cars Revenue (undefined) Forecast, by Application 2020 & 2033
- Table 86: South Korea Bicycle Racks for Cars Volume (K) Forecast, by Application 2020 & 2033
- Table 87: ASEAN Bicycle Racks for Cars Revenue (undefined) Forecast, by Application 2020 & 2033
- Table 88: ASEAN Bicycle Racks for Cars Volume (K) Forecast, by Application 2020 & 2033
- Table 89: Oceania Bicycle Racks for Cars Revenue (undefined) Forecast, by Application 2020 & 2033
- Table 90: Oceania Bicycle Racks for Cars Volume (K) Forecast, by Application 2020 & 2033
- Table 91: Rest of Asia Pacific Bicycle Racks for Cars Revenue (undefined) Forecast, by Application 2020 & 2033
- Table 92: Rest of Asia Pacific Bicycle Racks for Cars Volume (K) Forecast, by Application 2020 & 2033
Frequently Asked Questions
1. What is the projected Compound Annual Growth Rate (CAGR) of the Bicycle Racks for Cars?
The projected CAGR is approximately 5.6%.
2. Which companies are prominent players in the Bicycle Racks for Cars?
Key companies in the market include Thule Group, Allen Sports, Yakima, Saris, Swagman, Hollywood Racks, Graber.
3. What are the main segments of the Bicycle Racks for Cars?
The market segments include Application, Types.
4. Can you provide details about the market size?
The market size is estimated to be USD XXX N/A as of 2022.
5. What are some drivers contributing to market growth?
N/A
6. What are the notable trends driving market growth?
N/A
7. Are there any restraints impacting market growth?
N/A
8. Can you provide examples of recent developments in the market?
N/A
9. What pricing options are available for accessing the report?
Pricing options include single-user, multi-user, and enterprise licenses priced at USD 3350.00, USD 5025.00, and USD 6700.00 respectively.
10. Is the market size provided in terms of value or volume?
The market size is provided in terms of value, measured in N/A and volume, measured in K.
11. Are there any specific market keywords associated with the report?
Yes, the market keyword associated with the report is "Bicycle Racks for Cars," which aids in identifying and referencing the specific market segment covered.
12. How do I determine which pricing option suits my needs best?
The pricing options vary based on user requirements and access needs. Individual users may opt for single-user licenses, while businesses requiring broader access may choose multi-user or enterprise licenses for cost-effective access to the report.
13. Are there any additional resources or data provided in the Bicycle Racks for Cars report?
While the report offers comprehensive insights, it's advisable to review the specific contents or supplementary materials provided to ascertain if additional resources or data are available.
14. How can I stay updated on further developments or reports in the Bicycle Racks for Cars?
To stay informed about further developments, trends, and reports in the Bicycle Racks for Cars, consider subscribing to industry newsletters, following relevant companies and organizations, or regularly checking reputable industry news sources and publications.
Methodology
Step 1 - Identification of Relevant Samples Size from Population Database


Step 2 - Approaches for Defining Global Market Size (Value, Volume* & Price*)

Note*: In applicable scenarios
Step 3 - Data Sources
Primary Research
- Web Analytics
- Survey Reports
- Research Institute
- Latest Research Reports
- Opinion Leaders
Secondary Research
- Annual Reports
- White Paper
- Latest Press Release
- Industry Association
- Paid Database
- Investor Presentations

Step 4 - Data Triangulation
Involves using different sources of information in order to increase the validity of a study
These sources are likely to be stakeholders in a program - participants, other researchers, program staff, other community members, and so on.
Then we put all data in single framework & apply various statistical tools to find out the dynamic on the market.
During the analysis stage, feedback from the stakeholder groups would be compared to determine areas of agreement as well as areas of divergence