

Key Insights
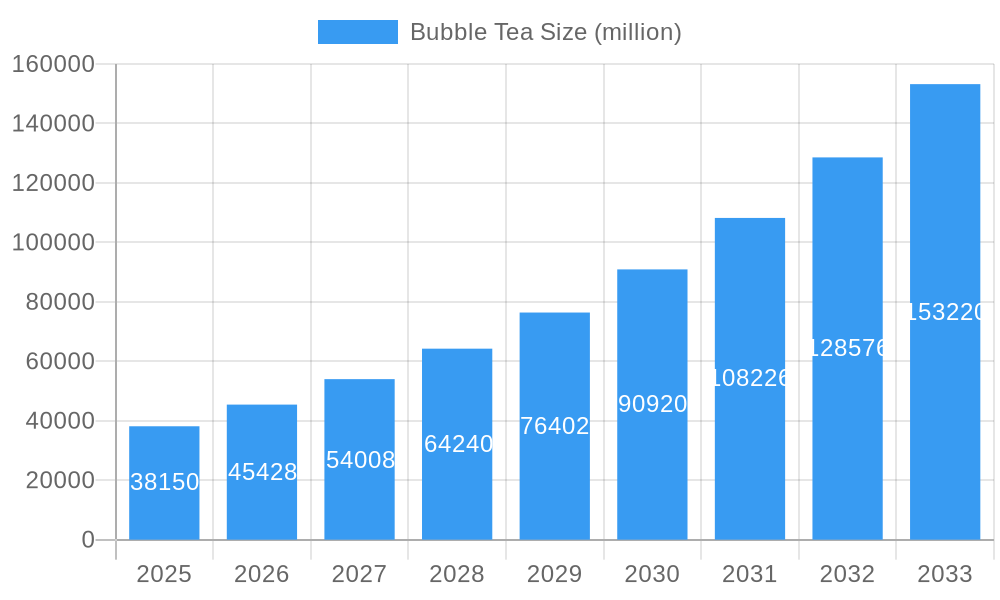
The global bubble tea market is poised for significant expansion, projected to reach $3.96 billion by 2025, with an anticipated Compound Annual Growth Rate (CAGR) of 9.5% from 2025 to 2033. This growth trajectory is propelled by several key drivers. Notably, the beverage's strong appeal among younger demographics, including millennials and Gen Z, ensures sustained demand. Amplified by social media trends and influencer marketing, brand awareness and product visibility are significantly enhanced, directly impacting sales. Furthermore, continuous innovation in flavors, toppings, and customization options effectively caters to evolving consumer preferences, fostering market dynamism. The introduction of healthier alternatives, such as plant-based milks and reduced sugar options, is also broadening the consumer base and addressing health-conscious demands. Strategic expansion by established chains and the emergence of new independent operators are increasing market reach and competition, leading to greater accessibility.
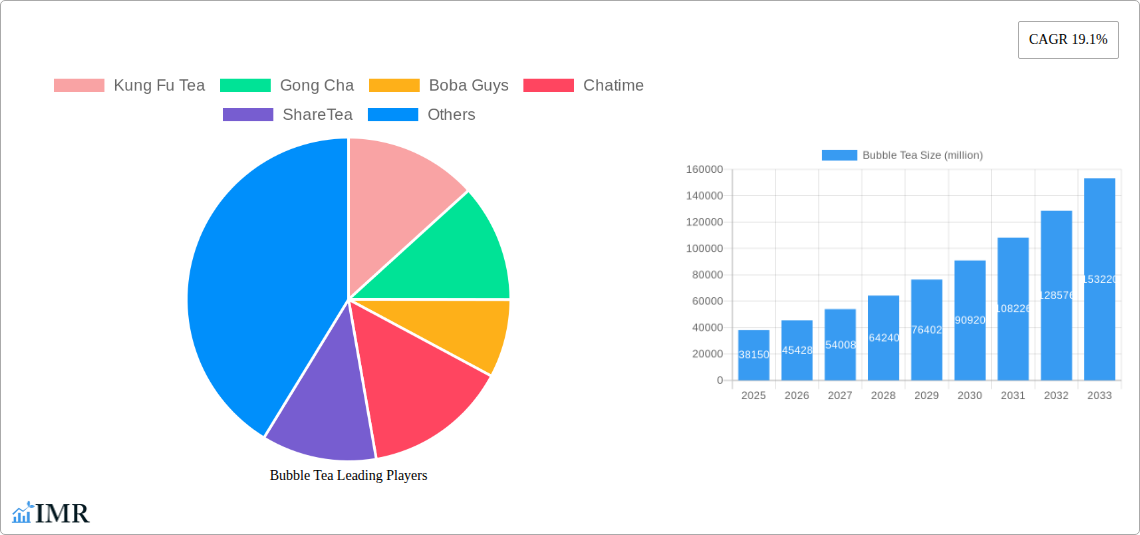
Bubble Tea Market Size (In Billion)
Despite the positive outlook, the market faces certain challenges. Fluctuations in raw material prices, particularly for tea leaves and milk, present a risk to profitability. Maintaining consistent product quality and robust supply chain efficiency across a global landscape is paramount. Intensifying competition necessitates ongoing innovation and strategic marketing to differentiate in a saturated market. Potential market over-saturation in specific regions could lead to price wars and reduced profit margins. Nevertheless, the overall market forecast remains optimistic, signaling continued expansion and promising investment opportunities for both established brands like Kung Fu Tea, Gong Cha, and Chatime, and emerging entrants seeking to capture market share in this vibrant industry. The market's inherent adaptability and capacity to meet diverse consumer tastes position it for sustained long-term growth.
Bubble Tea Company Market Share
Unlock Explosive Growth: The Comprehensive Bubble Tea Market Report (2019-2033)
This in-depth report provides a comprehensive analysis of the global Bubble Tea market, encompassing historical data (2019-2024), current estimates (2025), and future forecasts (2025-2033). Designed for industry professionals, investors, and strategic planners, this report offers invaluable insights into market dynamics, growth trends, competitive landscapes, and future opportunities within this rapidly expanding beverage sector. The report covers key players such as Kung Fu Tea, Gong Cha, Boba Guys, Chatime, ShareTea, 8tea5, Quickly, CoCo Fresh, and ViVi Bubble Tea, across various segments of the parent market (beverage industry) and the child market (ready-to-drink beverages). This report will help you navigate the complexities of the Bubble Tea market and formulate effective strategies for success.
Bubble Tea Market Dynamics & Structure
The global bubble tea market, valued at $xx million in 2025, exhibits a moderately concentrated structure with key players vying for market share. Technological innovation, particularly in flavor profiles, customization options, and automated dispensing systems, is a significant driver. Regulatory frameworks concerning food safety and labeling vary across regions, impacting market access and operational costs. Competitive substitutes include other ready-to-drink beverages like fruit juices, smoothies, and coffee. End-user demographics skew towards younger adults (18-35 years), with significant variations across regions. Mergers and acquisitions (M&A) activity has been relatively moderate in recent years, with approximately xx deals recorded between 2019 and 2024.
- Market Concentration: Moderately concentrated, with top 5 players holding xx% market share in 2025.
- Technological Innovation: Focus on customizable options, unique flavor profiles, and automated dispensing.
- Regulatory Framework: Varies by region, impacting food safety standards and labeling requirements.
- Competitive Substitutes: Fruit juices, smoothies, coffee, and other ready-to-drink beverages.
- End-User Demographics: Predominantly young adults (18-35 years), with regional variations.
- M&A Activity: xx deals between 2019 and 2024, indicating moderate consolidation.
Bubble Tea Growth Trends & Insights
Utilizing a robust methodology combining market research data, industry expert interviews, and financial modeling, this report projects a CAGR of xx% for the bubble tea market during the forecast period (2025-2033). Market size is expected to reach $xx million by 2033, driven by increasing consumer demand, particularly in Asia and North America. Technological disruptions, such as the introduction of innovative flavor combinations and automated brewing systems, are enhancing operational efficiency and product appeal. Consumer behavior shifts towards healthier and customizable options are fueling market growth. Market penetration remains relatively high in established markets, but significant untapped potential exists in emerging economies.
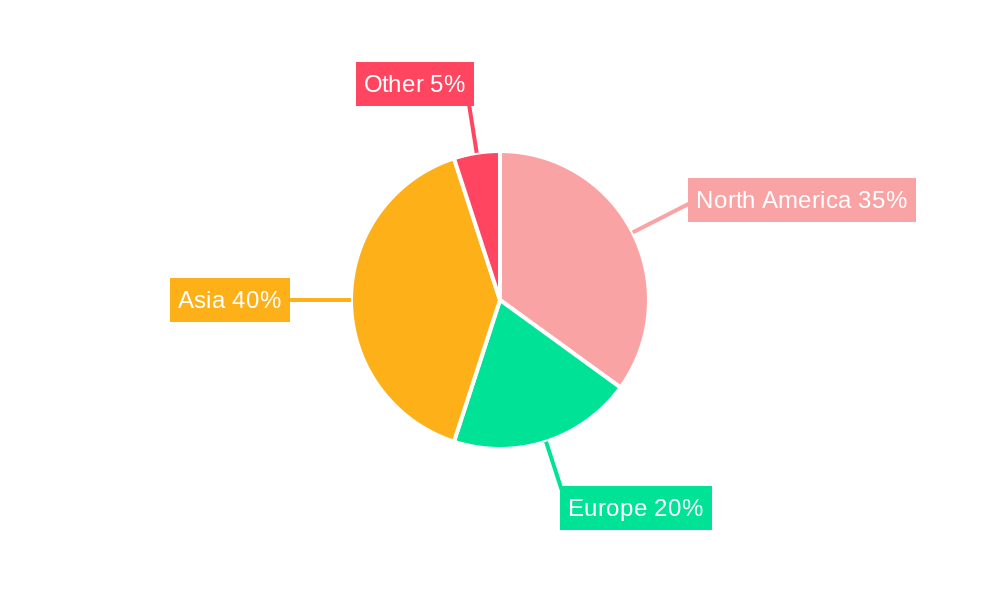
Dominant Regions, Countries, or Segments in Bubble Tea
Asia, particularly Taiwan, continues to dominate the global bubble tea market, holding the largest market share in 2025 at xx%. This dominance is attributed to the origin of the beverage, established consumer preferences, and a strong network of established brands. North America and Europe are experiencing rapid growth, driven by rising disposable incomes, increasing consumer awareness, and the proliferation of bubble tea shops.
- Key Drivers in Asia: Strong consumer base, established brands, and readily available supply chains.
- Key Drivers in North America: Rising disposable incomes, increasing consumer awareness, and franchise expansion.
- Key Drivers in Europe: Growing popularity of Asian-inspired beverages and increasing demand for customized drinks.
- Market Share: Asia (xx%), North America (xx%), Europe (xx%), Rest of World (xx%).
- Growth Potential: High growth potential in emerging markets in South America and Africa.
Bubble Tea Product Landscape
The bubble tea product landscape is characterized by continuous innovation in flavor profiles, toppings, and preparation methods. From classic milk tea variations to fruit-infused options and creative additions like cheese foam and pudding, the product range is extensive. Technological advancements, such as automated dispensing systems and improved ingredient sourcing, contribute to greater efficiency and quality control. Unique selling propositions frequently focus on customization options, fresh ingredients, and signature recipes.
Key Drivers, Barriers & Challenges in Bubble Tea
Key Drivers:
- Increasing consumer demand for customizable beverages.
- Growing popularity of Asian-inspired food and drinks.
- Expansion of retail channels and franchising opportunities.
Key Challenges:
- Intense competition and price pressure. (Impact: xx% reduction in profit margin for some brands)
- Supply chain disruptions impacting ingredient availability and costs. (Impact: xx% increase in raw material costs in 2024)
- Regulatory hurdles related to food safety and labeling requirements.
Emerging Opportunities in Bubble Tea
Emerging opportunities include expansion into new markets (e.g., Africa, South America), the development of healthier and more sustainable options, and the integration of technology to enhance the customer experience (e.g., mobile ordering, loyalty programs). Premiumization and niche offerings, like unique tea blends and artisanal toppings, present lucrative opportunities.
Growth Accelerators in the Bubble Tea Industry
Technological breakthroughs in automation, ingredient sourcing, and flavor development are significantly accelerating growth. Strategic partnerships between tea producers, equipment manufacturers, and franchise operators enhance market reach and efficiency. Focused expansion into new markets, particularly in regions with growing disposable incomes, is a crucial growth catalyst.
Key Players Shaping the Bubble Tea Market
- Kung Fu Tea
- Gong Cha
- Boba Guys
- Chatime
- ShareTea
- 8tea5
- Quickly
- CoCo Fresh
- ViVi Bubble Tea
Notable Milestones in Bubble Tea Sector
- 2020: Launch of several plant-based bubble tea options by major brands.
- 2021: Increased investment in automated dispensing systems to improve efficiency and consistency.
- 2022: Significant expansion of franchise operations in North America and Europe.
- 2023: Introduction of innovative flavor profiles and customizable options.
- 2024: Several mergers and acquisitions amongst smaller bubble tea brands.
In-Depth Bubble Tea Market Outlook
The bubble tea market is poised for sustained growth, driven by continuous innovation, expanding market reach, and evolving consumer preferences. Strategic opportunities lie in leveraging technological advancements to enhance efficiency and customer experience, expanding into untapped markets, and focusing on premiumization and niche offerings. The market’s dynamic nature and resilience to economic shifts suggest a bright future, with significant potential for expansion and innovation across both established and emerging regions.
Bubble Tea Segmentation
-
1. Application
- 1.1. 18-25 years old
- 1.2. 26-35 years old
- 1.3. 36-45 years old
- 1.4. Other Groups
-
2. Type
- 2.1. Classic/Original
- 2.2. Fruit Flavored
- 2.3. Other Flavors
Bubble Tea Segmentation By Geography
-
1. North America
- 1.1. United States
- 1.2. Canada
- 1.3. Mexico
-
2. South America
- 2.1. Brazil
- 2.2. Argentina
- 2.3. Rest of South America
-
3. Europe
- 3.1. United Kingdom
- 3.2. Germany
- 3.3. France
- 3.4. Italy
- 3.5. Spain
- 3.6. Russia
- 3.7. Benelux
- 3.8. Nordics
- 3.9. Rest of Europe
-
4. Middle East & Africa
- 4.1. Turkey
- 4.2. Israel
- 4.3. GCC
- 4.4. North Africa
- 4.5. South Africa
- 4.6. Rest of Middle East & Africa
-
5. Asia Pacific
- 5.1. China
- 5.2. India
- 5.3. Japan
- 5.4. South Korea
- 5.5. ASEAN
- 5.6. Oceania
- 5.7. Rest of Asia Pacific
Bubble Tea Regional Market Share
Geographic Coverage of Bubble Tea
Bubble Tea REPORT HIGHLIGHTS
| Aspects | Details |
|---|---|
| Study Period | 2020-2034 |
| Base Year | 2025 |
| Estimated Year | 2026 |
| Forecast Period | 2026-2034 |
| Historical Period | 2020-2025 |
| Growth Rate | CAGR of 9.5% from 2020-2034 |
| Segmentation |
|
Table of Contents
- 1. Introduction
- 1.1. Research Scope
- 1.2. Market Segmentation
- 1.3. Research Methodology
- 1.4. Definitions and Assumptions
- 2. Executive Summary
- 2.1. Introduction
- 3. Market Dynamics
- 3.1. Introduction
- 3.2. Market Drivers
- 3.3. Market Restrains
- 3.4. Market Trends
- 4. Market Factor Analysis
- 4.1. Porters Five Forces
- 4.2. Supply/Value Chain
- 4.3. PESTEL analysis
- 4.4. Market Entropy
- 4.5. Patent/Trademark Analysis
- 5. Global Bubble Tea Analysis, Insights and Forecast, 2020-2032
- 5.1. Market Analysis, Insights and Forecast - by Application
- 5.1.1. 18-25 years old
- 5.1.2. 26-35 years old
- 5.1.3. 36-45 years old
- 5.1.4. Other Groups
- 5.2. Market Analysis, Insights and Forecast - by Type
- 5.2.1. Classic/Original
- 5.2.2. Fruit Flavored
- 5.2.3. Other Flavors
- 5.3. Market Analysis, Insights and Forecast - by Region
- 5.3.1. North America
- 5.3.2. South America
- 5.3.3. Europe
- 5.3.4. Middle East & Africa
- 5.3.5. Asia Pacific
- 5.1. Market Analysis, Insights and Forecast - by Application
- 6. North America Bubble Tea Analysis, Insights and Forecast, 2020-2032
- 6.1. Market Analysis, Insights and Forecast - by Application
- 6.1.1. 18-25 years old
- 6.1.2. 26-35 years old
- 6.1.3. 36-45 years old
- 6.1.4. Other Groups
- 6.2. Market Analysis, Insights and Forecast - by Type
- 6.2.1. Classic/Original
- 6.2.2. Fruit Flavored
- 6.2.3. Other Flavors
- 6.1. Market Analysis, Insights and Forecast - by Application
- 7. South America Bubble Tea Analysis, Insights and Forecast, 2020-2032
- 7.1. Market Analysis, Insights and Forecast - by Application
- 7.1.1. 18-25 years old
- 7.1.2. 26-35 years old
- 7.1.3. 36-45 years old
- 7.1.4. Other Groups
- 7.2. Market Analysis, Insights and Forecast - by Type
- 7.2.1. Classic/Original
- 7.2.2. Fruit Flavored
- 7.2.3. Other Flavors
- 7.1. Market Analysis, Insights and Forecast - by Application
- 8. Europe Bubble Tea Analysis, Insights and Forecast, 2020-2032
- 8.1. Market Analysis, Insights and Forecast - by Application
- 8.1.1. 18-25 years old
- 8.1.2. 26-35 years old
- 8.1.3. 36-45 years old
- 8.1.4. Other Groups
- 8.2. Market Analysis, Insights and Forecast - by Type
- 8.2.1. Classic/Original
- 8.2.2. Fruit Flavored
- 8.2.3. Other Flavors
- 8.1. Market Analysis, Insights and Forecast - by Application
- 9. Middle East & Africa Bubble Tea Analysis, Insights and Forecast, 2020-2032
- 9.1. Market Analysis, Insights and Forecast - by Application
- 9.1.1. 18-25 years old
- 9.1.2. 26-35 years old
- 9.1.3. 36-45 years old
- 9.1.4. Other Groups
- 9.2. Market Analysis, Insights and Forecast - by Type
- 9.2.1. Classic/Original
- 9.2.2. Fruit Flavored
- 9.2.3. Other Flavors
- 9.1. Market Analysis, Insights and Forecast - by Application
- 10. Asia Pacific Bubble Tea Analysis, Insights and Forecast, 2020-2032
- 10.1. Market Analysis, Insights and Forecast - by Application
- 10.1.1. 18-25 years old
- 10.1.2. 26-35 years old
- 10.1.3. 36-45 years old
- 10.1.4. Other Groups
- 10.2. Market Analysis, Insights and Forecast - by Type
- 10.2.1. Classic/Original
- 10.2.2. Fruit Flavored
- 10.2.3. Other Flavors
- 10.1. Market Analysis, Insights and Forecast - by Application
- 11. Competitive Analysis
- 11.1. Global Market Share Analysis 2025
- 11.2. Company Profiles
- 11.2.1 Kung Fu Tea
- 11.2.1.1. Overview
- 11.2.1.2. Products
- 11.2.1.3. SWOT Analysis
- 11.2.1.4. Recent Developments
- 11.2.1.5. Financials (Based on Availability)
- 11.2.2 Gong Cha
- 11.2.2.1. Overview
- 11.2.2.2. Products
- 11.2.2.3. SWOT Analysis
- 11.2.2.4. Recent Developments
- 11.2.2.5. Financials (Based on Availability)
- 11.2.3 Boba Guys
- 11.2.3.1. Overview
- 11.2.3.2. Products
- 11.2.3.3. SWOT Analysis
- 11.2.3.4. Recent Developments
- 11.2.3.5. Financials (Based on Availability)
- 11.2.4 Chatime
- 11.2.4.1. Overview
- 11.2.4.2. Products
- 11.2.4.3. SWOT Analysis
- 11.2.4.4. Recent Developments
- 11.2.4.5. Financials (Based on Availability)
- 11.2.5 ShareTea
- 11.2.5.1. Overview
- 11.2.5.2. Products
- 11.2.5.3. SWOT Analysis
- 11.2.5.4. Recent Developments
- 11.2.5.5. Financials (Based on Availability)
- 11.2.6 8tea5
- 11.2.6.1. Overview
- 11.2.6.2. Products
- 11.2.6.3. SWOT Analysis
- 11.2.6.4. Recent Developments
- 11.2.6.5. Financials (Based on Availability)
- 11.2.7 Quickly
- 11.2.7.1. Overview
- 11.2.7.2. Products
- 11.2.7.3. SWOT Analysis
- 11.2.7.4. Recent Developments
- 11.2.7.5. Financials (Based on Availability)
- 11.2.8 CoCo Fresh
- 11.2.8.1. Overview
- 11.2.8.2. Products
- 11.2.8.3. SWOT Analysis
- 11.2.8.4. Recent Developments
- 11.2.8.5. Financials (Based on Availability)
- 11.2.9 ViVi Bubble Tea
- 11.2.9.1. Overview
- 11.2.9.2. Products
- 11.2.9.3. SWOT Analysis
- 11.2.9.4. Recent Developments
- 11.2.9.5. Financials (Based on Availability)
- 11.2.1 Kung Fu Tea
List of Figures
- Figure 1: Global Bubble Tea Revenue Breakdown (billion, %) by Region 2025 & 2033
- Figure 2: North America Bubble Tea Revenue (billion), by Application 2025 & 2033
- Figure 3: North America Bubble Tea Revenue Share (%), by Application 2025 & 2033
- Figure 4: North America Bubble Tea Revenue (billion), by Type 2025 & 2033
- Figure 5: North America Bubble Tea Revenue Share (%), by Type 2025 & 2033
- Figure 6: North America Bubble Tea Revenue (billion), by Country 2025 & 2033
- Figure 7: North America Bubble Tea Revenue Share (%), by Country 2025 & 2033
- Figure 8: South America Bubble Tea Revenue (billion), by Application 2025 & 2033
- Figure 9: South America Bubble Tea Revenue Share (%), by Application 2025 & 2033
- Figure 10: South America Bubble Tea Revenue (billion), by Type 2025 & 2033
- Figure 11: South America Bubble Tea Revenue Share (%), by Type 2025 & 2033
- Figure 12: South America Bubble Tea Revenue (billion), by Country 2025 & 2033
- Figure 13: South America Bubble Tea Revenue Share (%), by Country 2025 & 2033
- Figure 14: Europe Bubble Tea Revenue (billion), by Application 2025 & 2033
- Figure 15: Europe Bubble Tea Revenue Share (%), by Application 2025 & 2033
- Figure 16: Europe Bubble Tea Revenue (billion), by Type 2025 & 2033
- Figure 17: Europe Bubble Tea Revenue Share (%), by Type 2025 & 2033
- Figure 18: Europe Bubble Tea Revenue (billion), by Country 2025 & 2033
- Figure 19: Europe Bubble Tea Revenue Share (%), by Country 2025 & 2033
- Figure 20: Middle East & Africa Bubble Tea Revenue (billion), by Application 2025 & 2033
- Figure 21: Middle East & Africa Bubble Tea Revenue Share (%), by Application 2025 & 2033
- Figure 22: Middle East & Africa Bubble Tea Revenue (billion), by Type 2025 & 2033
- Figure 23: Middle East & Africa Bubble Tea Revenue Share (%), by Type 2025 & 2033
- Figure 24: Middle East & Africa Bubble Tea Revenue (billion), by Country 2025 & 2033
- Figure 25: Middle East & Africa Bubble Tea Revenue Share (%), by Country 2025 & 2033
- Figure 26: Asia Pacific Bubble Tea Revenue (billion), by Application 2025 & 2033
- Figure 27: Asia Pacific Bubble Tea Revenue Share (%), by Application 2025 & 2033
- Figure 28: Asia Pacific Bubble Tea Revenue (billion), by Type 2025 & 2033
- Figure 29: Asia Pacific Bubble Tea Revenue Share (%), by Type 2025 & 2033
- Figure 30: Asia Pacific Bubble Tea Revenue (billion), by Country 2025 & 2033
- Figure 31: Asia Pacific Bubble Tea Revenue Share (%), by Country 2025 & 2033
List of Tables
- Table 1: Global Bubble Tea Revenue billion Forecast, by Application 2020 & 2033
- Table 2: Global Bubble Tea Revenue billion Forecast, by Type 2020 & 2033
- Table 3: Global Bubble Tea Revenue billion Forecast, by Region 2020 & 2033
- Table 4: Global Bubble Tea Revenue billion Forecast, by Application 2020 & 2033
- Table 5: Global Bubble Tea Revenue billion Forecast, by Type 2020 & 2033
- Table 6: Global Bubble Tea Revenue billion Forecast, by Country 2020 & 2033
- Table 7: United States Bubble Tea Revenue (billion) Forecast, by Application 2020 & 2033
- Table 8: Canada Bubble Tea Revenue (billion) Forecast, by Application 2020 & 2033
- Table 9: Mexico Bubble Tea Revenue (billion) Forecast, by Application 2020 & 2033
- Table 10: Global Bubble Tea Revenue billion Forecast, by Application 2020 & 2033
- Table 11: Global Bubble Tea Revenue billion Forecast, by Type 2020 & 2033
- Table 12: Global Bubble Tea Revenue billion Forecast, by Country 2020 & 2033
- Table 13: Brazil Bubble Tea Revenue (billion) Forecast, by Application 2020 & 2033
- Table 14: Argentina Bubble Tea Revenue (billion) Forecast, by Application 2020 & 2033
- Table 15: Rest of South America Bubble Tea Revenue (billion) Forecast, by Application 2020 & 2033
- Table 16: Global Bubble Tea Revenue billion Forecast, by Application 2020 & 2033
- Table 17: Global Bubble Tea Revenue billion Forecast, by Type 2020 & 2033
- Table 18: Global Bubble Tea Revenue billion Forecast, by Country 2020 & 2033
- Table 19: United Kingdom Bubble Tea Revenue (billion) Forecast, by Application 2020 & 2033
- Table 20: Germany Bubble Tea Revenue (billion) Forecast, by Application 2020 & 2033
- Table 21: France Bubble Tea Revenue (billion) Forecast, by Application 2020 & 2033
- Table 22: Italy Bubble Tea Revenue (billion) Forecast, by Application 2020 & 2033
- Table 23: Spain Bubble Tea Revenue (billion) Forecast, by Application 2020 & 2033
- Table 24: Russia Bubble Tea Revenue (billion) Forecast, by Application 2020 & 2033
- Table 25: Benelux Bubble Tea Revenue (billion) Forecast, by Application 2020 & 2033
- Table 26: Nordics Bubble Tea Revenue (billion) Forecast, by Application 2020 & 2033
- Table 27: Rest of Europe Bubble Tea Revenue (billion) Forecast, by Application 2020 & 2033
- Table 28: Global Bubble Tea Revenue billion Forecast, by Application 2020 & 2033
- Table 29: Global Bubble Tea Revenue billion Forecast, by Type 2020 & 2033
- Table 30: Global Bubble Tea Revenue billion Forecast, by Country 2020 & 2033
- Table 31: Turkey Bubble Tea Revenue (billion) Forecast, by Application 2020 & 2033
- Table 32: Israel Bubble Tea Revenue (billion) Forecast, by Application 2020 & 2033
- Table 33: GCC Bubble Tea Revenue (billion) Forecast, by Application 2020 & 2033
- Table 34: North Africa Bubble Tea Revenue (billion) Forecast, by Application 2020 & 2033
- Table 35: South Africa Bubble Tea Revenue (billion) Forecast, by Application 2020 & 2033
- Table 36: Rest of Middle East & Africa Bubble Tea Revenue (billion) Forecast, by Application 2020 & 2033
- Table 37: Global Bubble Tea Revenue billion Forecast, by Application 2020 & 2033
- Table 38: Global Bubble Tea Revenue billion Forecast, by Type 2020 & 2033
- Table 39: Global Bubble Tea Revenue billion Forecast, by Country 2020 & 2033
- Table 40: China Bubble Tea Revenue (billion) Forecast, by Application 2020 & 2033
- Table 41: India Bubble Tea Revenue (billion) Forecast, by Application 2020 & 2033
- Table 42: Japan Bubble Tea Revenue (billion) Forecast, by Application 2020 & 2033
- Table 43: South Korea Bubble Tea Revenue (billion) Forecast, by Application 2020 & 2033
- Table 44: ASEAN Bubble Tea Revenue (billion) Forecast, by Application 2020 & 2033
- Table 45: Oceania Bubble Tea Revenue (billion) Forecast, by Application 2020 & 2033
- Table 46: Rest of Asia Pacific Bubble Tea Revenue (billion) Forecast, by Application 2020 & 2033
Frequently Asked Questions
1. What is the projected Compound Annual Growth Rate (CAGR) of the Bubble Tea?
The projected CAGR is approximately 9.5%.
2. Which companies are prominent players in the Bubble Tea?
Key companies in the market include Kung Fu Tea, Gong Cha, Boba Guys, Chatime, ShareTea, 8tea5, Quickly, CoCo Fresh, ViVi Bubble Tea.
3. What are the main segments of the Bubble Tea?
The market segments include Application, Type.
4. Can you provide details about the market size?
The market size is estimated to be USD 3.96 billion as of 2022.
5. What are some drivers contributing to market growth?
N/A
6. What are the notable trends driving market growth?
N/A
7. Are there any restraints impacting market growth?
N/A
8. Can you provide examples of recent developments in the market?
N/A
9. What pricing options are available for accessing the report?
Pricing options include single-user, multi-user, and enterprise licenses priced at USD 5900.00, USD 8850.00, and USD 11800.00 respectively.
10. Is the market size provided in terms of value or volume?
The market size is provided in terms of value, measured in billion.
11. Are there any specific market keywords associated with the report?
Yes, the market keyword associated with the report is "Bubble Tea," which aids in identifying and referencing the specific market segment covered.
12. How do I determine which pricing option suits my needs best?
The pricing options vary based on user requirements and access needs. Individual users may opt for single-user licenses, while businesses requiring broader access may choose multi-user or enterprise licenses for cost-effective access to the report.
13. Are there any additional resources or data provided in the Bubble Tea report?
While the report offers comprehensive insights, it's advisable to review the specific contents or supplementary materials provided to ascertain if additional resources or data are available.
14. How can I stay updated on further developments or reports in the Bubble Tea?
To stay informed about further developments, trends, and reports in the Bubble Tea, consider subscribing to industry newsletters, following relevant companies and organizations, or regularly checking reputable industry news sources and publications.
Methodology
Step 1 - Identification of Relevant Samples Size from Population Database


Step 2 - Approaches for Defining Global Market Size (Value, Volume* & Price*)

Note*: In applicable scenarios
Step 3 - Data Sources
Primary Research
- Web Analytics
- Survey Reports
- Research Institute
- Latest Research Reports
- Opinion Leaders
Secondary Research
- Annual Reports
- White Paper
- Latest Press Release
- Industry Association
- Paid Database
- Investor Presentations

Step 4 - Data Triangulation
Involves using different sources of information in order to increase the validity of a study
These sources are likely to be stakeholders in a program - participants, other researchers, program staff, other community members, and so on.
Then we put all data in single framework & apply various statistical tools to find out the dynamic on the market.
During the analysis stage, feedback from the stakeholder groups would be compared to determine areas of agreement as well as areas of divergence