

Key Insights
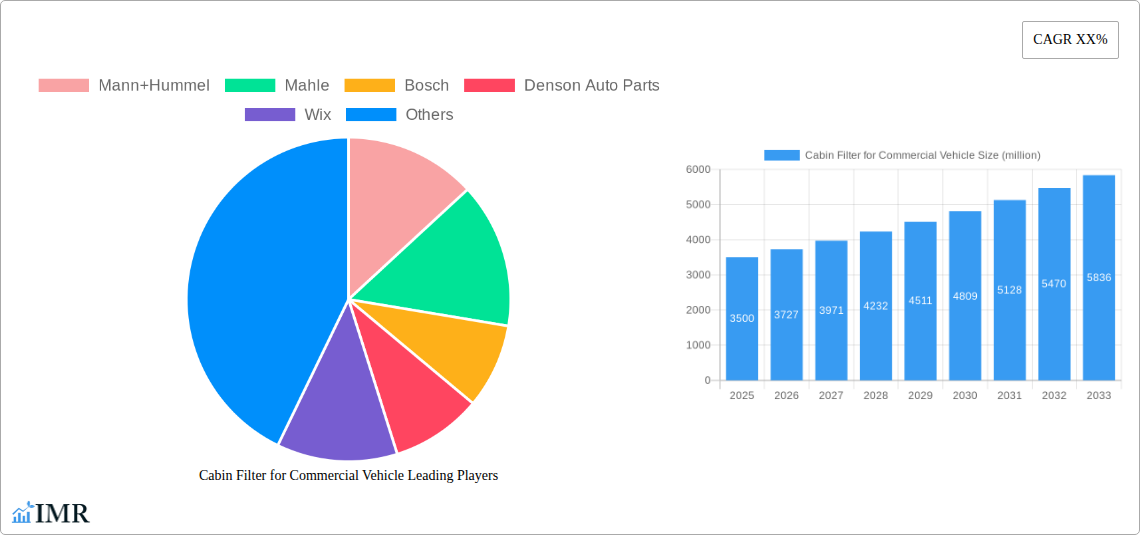
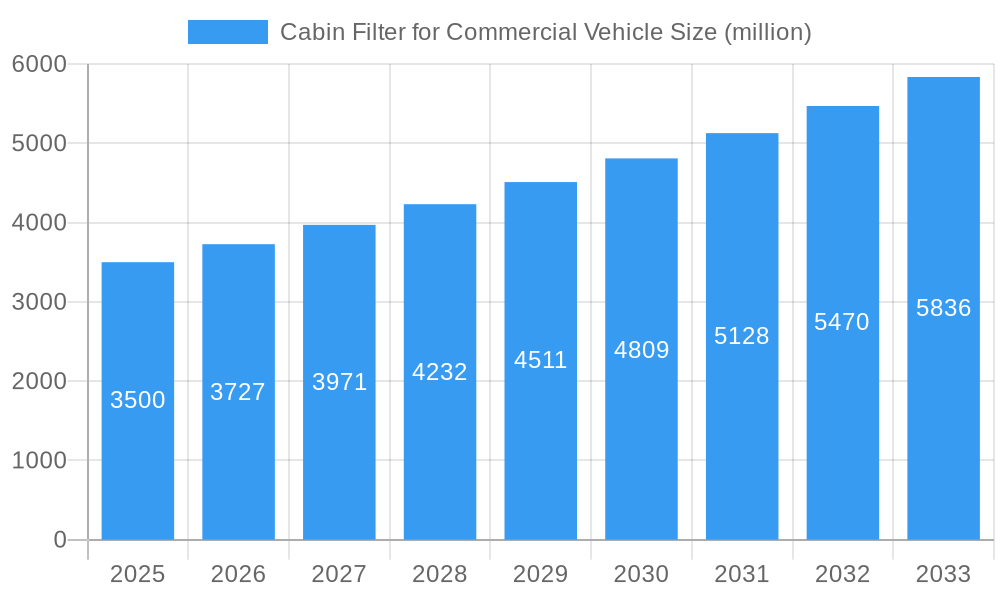
The global cabin filter market for commercial vehicles is poised for substantial growth, projected to reach an estimated $3,500 million by 2025, and is anticipated to expand at a Compound Annual Growth Rate (CAGR) of approximately 6.5% through 2033. This robust expansion is primarily fueled by escalating global demand for efficient and cleaner transportation solutions, directly impacting the commercial vehicle sector. Stringent government regulations mandating improved air quality within vehicle cabins, particularly for long-haul drivers and passengers, are a significant driver. Furthermore, the increasing fleet size of commercial vehicles across various applications, including light and heavy-duty trucks, buses, and specialized utility vehicles, directly correlates with the demand for cabin filters. Technological advancements leading to the development of high-performance filters, such as activated carbon variants offering superior filtration of pollutants and odors, are also contributing to market value. The continuous replacement cycle of these essential components further underpins consistent market demand.
Cabin Filter for Commercial Vehicle Market Size (In Billion)
Key growth drivers for the commercial vehicle cabin filter market include the expanding logistics and e-commerce industries, which necessitate a larger and more frequently utilized commercial fleet. The ongoing trend towards fleet modernization, with operators investing in newer vehicles equipped with advanced cabin air filtration systems to enhance driver comfort and health, also plays a crucial role. Conversely, the market faces certain restraints, including the initial cost of advanced filter technologies and potential price volatility of raw materials used in filter manufacturing. However, the overarching benefits of improved air quality, reduced maintenance costs due to cleaner cabin environments, and enhanced passenger well-being are expected to outweigh these challenges. The market is segmented by application into Light Commercial Vehicle and Heavy Duty Commercial Vehicle, with further categorization by type into Normal Type and Activated Carbon Type, reflecting diverse filtration needs.
Cabin Filter for Commercial Vehicle Company Market Share
This in-depth report provides a complete analysis of the global Cabin Filter for Commercial Vehicle Market, meticulously segmented by application and type, and covering a comprehensive study period from 2019 to 2033. With a base year of 2025, the report offers critical insights into market dynamics, growth trends, regional dominance, product innovation, key drivers, emerging opportunities, and the competitive landscape shaped by leading industry players. For professionals seeking to understand the nuances and future trajectory of this vital automotive component market, this report is an indispensable resource.
Cabin Filter for Commercial Vehicle Market Dynamics & Structure
The Cabin Filter for Commercial Vehicle Market exhibits a moderately concentrated structure, with a few key global players like Mann+Hummel, Mahle, Bosch, and Donaldson holding significant market share. Technological innovation is primarily driven by the increasing demand for enhanced air quality within vehicle cabins, leading to advancements in filtration media and activated carbon technologies. Regulatory frameworks, particularly concerning emissions and driver health and safety, are progressively influencing product development and adoption rates. Competitive product substitutes are limited, as cabin filters are essential components with specific functionalities. End-user demographics are evolving, with a growing focus on fleet operators and logistics companies prioritizing vehicle uptime and driver comfort. Mergers and acquisitions (M&A) trends, while not as rampant as in some automotive sectors, are present as larger players seek to consolidate market presence and expand their product portfolios. For instance, there were approximately 10-15 significant M&A deals recorded between 2019 and 2024, aimed at acquiring innovative technologies or expanding geographical reach. Innovation barriers include the high cost of advanced material research and development, and the need for rigorous testing to meet stringent automotive standards.
- Market Concentration: Moderate, with key players holding substantial share.
- Technological Drivers: Enhanced air quality, particle filtration, odor removal.
- Regulatory Influence: Stringent emission standards, driver health and safety mandates.
- Competitive Landscape: Limited direct substitutes for core functionality.
- End-User Focus: Fleet operators, logistics companies, vehicle manufacturers.
- M&A Activity: Strategic acquisitions to gain market share and technology.
- Innovation Barriers: R&D costs, rigorous testing requirements.
Cabin Filter for Commercial Vehicle Growth Trends & Insights
The Cabin Filter for Commercial Vehicle Market is poised for robust growth, with an estimated market size projected to reach XX billion units by 2033. This growth is underpinned by a sustained increase in the global commercial vehicle parc and a rising awareness among fleet operators regarding the importance of cabin air quality for driver productivity and health. The adoption rates of advanced filtration technologies, such as activated carbon filters, are accelerating as vehicle manufacturers and aftermarket suppliers increasingly emphasize superior air purification capabilities. Technological disruptions, including the integration of smart sensors for filter monitoring and predictive maintenance, are expected to further drive market penetration. Consumer behavior shifts are evident, with a greater demand for healthier and more comfortable driving environments, particularly in long-haul trucking and urban delivery services. The Compound Annual Growth Rate (CAGR) for the forecast period is estimated at XX%, reflecting a steady and predictable expansion. Market penetration for activated carbon filters is projected to increase from XX% in 2025 to XX% by 2033, driven by premiumization trends and regulatory pressures.
Dominant Regions, Countries, or Segments in Cabin Filter for Commercial Vehicle
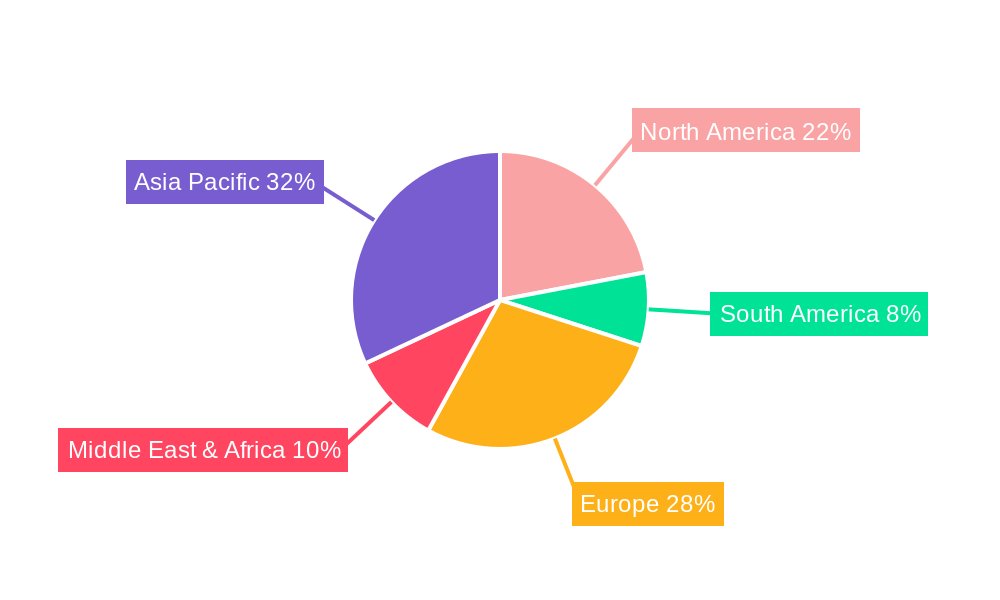
The Heavy Duty Commercial Vehicle segment, specifically within the Application category, is emerging as a dominant driver of growth in the global Cabin Filter for Commercial Vehicle Market. This dominance is attributed to several key factors. Firstly, the sheer volume of heavy-duty trucks operating in global logistics and transportation networks necessitates a continuous demand for replacement filters. Economic policies in major economies like North America and Europe, which often focus on infrastructure development and trade facilitation, directly stimulate the demand for freight movement, thereby increasing the operational hours of heavy-duty vehicles. Furthermore, the increasingly stringent regulations in these regions regarding driver comfort and health mandates the use of high-performance cabin filters to mitigate exposure to pollutants and allergens.
The Activated Carbon Type within the Types category is also experiencing significant growth, driven by the increasing consumer and regulatory demand for improved cabin air quality. This type of filter offers superior protection against odors, volatile organic compounds (VOCs), and fine particulate matter, making it a preferred choice for premium commercial vehicles and those operating in urban or industrial environments. Market share for activated carbon filters is projected to grow substantially, capturing an estimated XX% of the total market by 2033, up from XX% in 2025. Growth potential in regions such as Asia-Pacific is particularly high, fueled by rapid industrialization, increasing urbanization, and the expansion of commercial vehicle fleets. Countries like China and India are key contributors to this growth, owing to massive investments in logistics infrastructure and a burgeoning e-commerce sector.
- Dominant Application Segment: Heavy Duty Commercial Vehicle.
- Key Drivers for Heavy Duty: High vehicle parc, stringent driver health regulations, logistics demand.
- Dominant Type Segment: Activated Carbon Type.
- Key Drivers for Activated Carbon: Enhanced air quality, odor/VOC filtration, premiumization.
- Leading Regions: North America, Europe, Asia-Pacific (especially China and India).
- Regional Growth Factors: Economic policies, infrastructure investment, regulatory mandates.
Cabin Filter for Commercial Vehicle Product Landscape
The product landscape for Cabin Filters for Commercial Vehicles is characterized by continuous innovation aimed at improving filtration efficiency, longevity, and cabin air quality. Manufacturers are introducing multi-layer filtration systems that combine particle capture with advanced activated carbon for superior odor and gas absorption. Performance metrics such as MERV (Minimum Efficiency Reporting Value) ratings are becoming more prominent, with higher MERV ratings indicating better particle capture. Unique selling propositions include extended service intervals, enhanced resistance to moisture and dust, and specialized filters designed for specific environments, such as those with high industrial pollution. Technological advancements include the development of electrostatically charged filter media and the integration of antimicrobial agents to prevent the growth of mold and bacteria within the cabin.
Key Drivers, Barriers & Challenges in Cabin Filter for Commercial Vehicle
Key Drivers:
- Increasing Commercial Vehicle Parc: A growing global fleet necessitates higher replacement filter demand.
- Stricter Air Quality Regulations: Mandates for driver health and safety drive adoption of advanced filters.
- Driver Comfort and Productivity: Fleet operators prioritize well-being for operational efficiency.
- Technological Advancements: Development of multi-layer and activated carbon filters enhances performance.
- Aftermarket Demand: Regular replacement cycles ensure sustained market activity.
Barriers & Challenges:
- Cost Sensitivity: Price remains a significant factor for fleet operators, especially in price-sensitive markets.
- Supply Chain Disruptions: Geopolitical events and material shortages can impact production and availability.
- Counterfeit Products: The presence of substandard or counterfeit filters can erode market trust and quality perception.
- Standardization Issues: Lack of universal standardization across different vehicle models can create complexity.
- Economic Downturns: Recessions can lead to reduced commercial vehicle sales and fleet maintenance budgets, impacting filter demand. The impact of global economic slowdowns can result in an estimated XX% reduction in aftermarket sales during a severe downturn.
Emerging Opportunities in Cabin Filter for Commercial Vehicle
Emerging opportunities in the Cabin Filter for Commercial Vehicle Market lie in the development of smart cabin filters with integrated sensors for real-time monitoring of filter condition and air quality. The increasing focus on sustainable manufacturing processes and the use of eco-friendly materials present a significant avenue for innovation. Untapped markets in developing economies with expanding logistics sectors offer substantial growth potential. Furthermore, the growing demand for customized filtration solutions for specialized commercial vehicles, such as those in the pharmaceutical or food transport industries, presents a niche but lucrative opportunity.
Growth Accelerators in the Cabin Filter for Commercial Vehicle Industry
Growth accelerators in the Cabin Filter for Commercial Vehicle Industry are primarily driven by advancements in filtration technology, leading to the development of more efficient and longer-lasting filters. Strategic partnerships between filter manufacturers and commercial vehicle OEMs (Original Equipment Manufacturers) are crucial for integrating advanced filtration systems as standard equipment. Market expansion strategies, particularly targeting emerging economies with burgeoning logistics sectors, will fuel long-term growth. The increasing adoption of electric commercial vehicles also presents a unique opportunity, as these vehicles often operate in quieter environments where cabin air quality becomes a more prominent comfort factor.
Key Players Shaping the Cabin Filter for Commercial Vehicle Market
- Mann+Hummel
- Mahle
- Bosch
- Denson Auto Parts
- Wix
- Fram
- Freudenberg
- UFI Group
- Cummins
- Donaldson
- Sogefi Group
- Henan Peace Filter
- ROKI Co.,Ltd
- Parker Hannifin
- ACDelco
- APEC KOREA
- Fumod
- YBM
- Zhejiang Universe Filter
- Okyia Auto Technology
- Guangzhou Yifeng
Notable Milestones in Cabin Filter for Commercial Vehicle Sector
- 2019: Mann+Hummel introduces an innovative multi-layer cabin filter for heavy-duty trucks, enhancing particle capture efficiency by XX%.
- 2020: Bosch launches a new range of activated carbon cabin filters with superior odor absorption capabilities for commercial vehicles.
- 2021: Donaldson acquires a leading air filtration technology company, expanding its portfolio in the commercial vehicle segment.
- 2022: Freudenberg develops a bio-based filter media, signaling a move towards more sustainable cabin filter production.
- 2023: Mahle announces significant investment in R&D for smart cabin filtration systems.
- 2024: UFI Group expands its production capacity for activated carbon cabin filters to meet growing demand in Europe.
In-Depth Cabin Filter for Commercial Vehicle Market Outlook
The outlook for the Cabin Filter for Commercial Vehicle Market is exceptionally positive, driven by a confluence of sustained demand for commercial transportation and an escalating emphasis on occupant well-being. Growth accelerators like continuous technological innovation in multi-stage filtration and smart sensor integration will significantly enhance product value and performance. Strategic collaborations between filter manufacturers and vehicle OEMs will ensure deeper market penetration and the adoption of advanced filtration as a standard feature. Expanding into underserved emerging markets, coupled with the rise of electric commercial vehicles, will unlock new avenues for growth, solidifying the market's trajectory towards substantial expansion.
Cabin Filter for Commercial Vehicle Segmentation
-
1. Application
- 1.1. Light Commercial Vehicle
- 1.2. Heavy Duty Commercial Vehicle
-
2. Types
- 2.1. Normal Type
- 2.2. Activated Carbon Type
Cabin Filter for Commercial Vehicle Segmentation By Geography
-
1. North America
- 1.1. United States
- 1.2. Canada
- 1.3. Mexico
-
2. South America
- 2.1. Brazil
- 2.2. Argentina
- 2.3. Rest of South America
-
3. Europe
- 3.1. United Kingdom
- 3.2. Germany
- 3.3. France
- 3.4. Italy
- 3.5. Spain
- 3.6. Russia
- 3.7. Benelux
- 3.8. Nordics
- 3.9. Rest of Europe
-
4. Middle East & Africa
- 4.1. Turkey
- 4.2. Israel
- 4.3. GCC
- 4.4. North Africa
- 4.5. South Africa
- 4.6. Rest of Middle East & Africa
-
5. Asia Pacific
- 5.1. China
- 5.2. India
- 5.3. Japan
- 5.4. South Korea
- 5.5. ASEAN
- 5.6. Oceania
- 5.7. Rest of Asia Pacific
Cabin Filter for Commercial Vehicle Regional Market Share
Geographic Coverage of Cabin Filter for Commercial Vehicle
Cabin Filter for Commercial Vehicle REPORT HIGHLIGHTS
| Aspects | Details |
|---|---|
| Study Period | 2020-2034 |
| Base Year | 2025 |
| Estimated Year | 2026 |
| Forecast Period | 2026-2034 |
| Historical Period | 2020-2025 |
| Growth Rate | CAGR of XX% from 2020-2034 |
| Segmentation |
|
Table of Contents
- 1. Introduction
- 1.1. Research Scope
- 1.2. Market Segmentation
- 1.3. Research Objective
- 1.4. Definitions and Assumptions
- 2. Executive Summary
- 2.1. Market Snapshot
- 3. Market Dynamics
- 3.1. Market Drivers
- 3.2. Market Restrains
- 3.3. Market Trends
- 3.4. Market Opportunities
- 4. Market Factor Analysis
- 4.1. Porters Five Forces
- 4.1.1. Bargaining Power of Suppliers
- 4.1.2. Bargaining Power of Buyers
- 4.1.3. Threat of New Entrants
- 4.1.4. Threat of Substitutes
- 4.1.5. Competitive Rivalry
- 4.2. PESTEL analysis
- 4.3. BCG Analysis
- 4.3.1. Stars (High Growth, High Market Share)
- 4.3.2. Cash Cows (Low Growth, High Market Share)
- 4.3.3. Question Mark (High Growth, Low Market Share)
- 4.3.4. Dogs (Low Growth, Low Market Share)
- 4.4. Ansoff Matrix Analysis
- 4.5. Supply Chain Analysis
- 4.6. Regulatory Landscape
- 4.7. Current Market Potential and Opportunity Assessment (TAM–SAM–SOM Framework)
- 4.8. IMR Analyst Note
- 4.1. Porters Five Forces
- 5. Market Analysis, Insights and Forecast 2021-2033
- 5.1. Market Analysis, Insights and Forecast - by Application
- 5.1.1. Light Commercial Vehicle
- 5.1.2. Heavy Duty Commercial Vehicle
- 5.2. Market Analysis, Insights and Forecast - by Types
- 5.2.1. Normal Type
- 5.2.2. Activated Carbon Type
- 5.3. Market Analysis, Insights and Forecast - by Region
- 5.3.1. North America
- 5.3.2. South America
- 5.3.3. Europe
- 5.3.4. Middle East & Africa
- 5.3.5. Asia Pacific
- 5.1. Market Analysis, Insights and Forecast - by Application
- 6. Global Cabin Filter for Commercial Vehicle Analysis, Insights and Forecast, 2021-2033
- 6.1. Market Analysis, Insights and Forecast - by Application
- 6.1.1. Light Commercial Vehicle
- 6.1.2. Heavy Duty Commercial Vehicle
- 6.2. Market Analysis, Insights and Forecast - by Types
- 6.2.1. Normal Type
- 6.2.2. Activated Carbon Type
- 6.1. Market Analysis, Insights and Forecast - by Application
- 7. North America Cabin Filter for Commercial Vehicle Analysis, Insights and Forecast, 2020-2032
- 7.1. Market Analysis, Insights and Forecast - by Application
- 7.1.1. Light Commercial Vehicle
- 7.1.2. Heavy Duty Commercial Vehicle
- 7.2. Market Analysis, Insights and Forecast - by Types
- 7.2.1. Normal Type
- 7.2.2. Activated Carbon Type
- 7.1. Market Analysis, Insights and Forecast - by Application
- 8. South America Cabin Filter for Commercial Vehicle Analysis, Insights and Forecast, 2020-2032
- 8.1. Market Analysis, Insights and Forecast - by Application
- 8.1.1. Light Commercial Vehicle
- 8.1.2. Heavy Duty Commercial Vehicle
- 8.2. Market Analysis, Insights and Forecast - by Types
- 8.2.1. Normal Type
- 8.2.2. Activated Carbon Type
- 8.1. Market Analysis, Insights and Forecast - by Application
- 9. Europe Cabin Filter for Commercial Vehicle Analysis, Insights and Forecast, 2020-2032
- 9.1. Market Analysis, Insights and Forecast - by Application
- 9.1.1. Light Commercial Vehicle
- 9.1.2. Heavy Duty Commercial Vehicle
- 9.2. Market Analysis, Insights and Forecast - by Types
- 9.2.1. Normal Type
- 9.2.2. Activated Carbon Type
- 9.1. Market Analysis, Insights and Forecast - by Application
- 10. Middle East & Africa Cabin Filter for Commercial Vehicle Analysis, Insights and Forecast, 2020-2032
- 10.1. Market Analysis, Insights and Forecast - by Application
- 10.1.1. Light Commercial Vehicle
- 10.1.2. Heavy Duty Commercial Vehicle
- 10.2. Market Analysis, Insights and Forecast - by Types
- 10.2.1. Normal Type
- 10.2.2. Activated Carbon Type
- 10.1. Market Analysis, Insights and Forecast - by Application
- 11. Asia Pacific Cabin Filter for Commercial Vehicle Analysis, Insights and Forecast, 2020-2032
- 11.1. Market Analysis, Insights and Forecast - by Application
- 11.1.1. Light Commercial Vehicle
- 11.1.2. Heavy Duty Commercial Vehicle
- 11.2. Market Analysis, Insights and Forecast - by Types
- 11.2.1. Normal Type
- 11.2.2. Activated Carbon Type
- 11.1. Market Analysis, Insights and Forecast - by Application
- 12. Competitive Analysis
- 12.1. Company Profiles
- 12.1.1 Mann+Hummel
- 12.1.1.1. Company Overview
- 12.1.1.2. Products
- 12.1.1.3. Company Financials
- 12.1.1.4. SWOT Analysis
- 12.1.2 Mahle
- 12.1.2.1. Company Overview
- 12.1.2.2. Products
- 12.1.2.3. Company Financials
- 12.1.2.4. SWOT Analysis
- 12.1.3 Bosch
- 12.1.3.1. Company Overview
- 12.1.3.2. Products
- 12.1.3.3. Company Financials
- 12.1.3.4. SWOT Analysis
- 12.1.4 Denson Auto Parts
- 12.1.4.1. Company Overview
- 12.1.4.2. Products
- 12.1.4.3. Company Financials
- 12.1.4.4. SWOT Analysis
- 12.1.5 Wix
- 12.1.5.1. Company Overview
- 12.1.5.2. Products
- 12.1.5.3. Company Financials
- 12.1.5.4. SWOT Analysis
- 12.1.6 Fram
- 12.1.6.1. Company Overview
- 12.1.6.2. Products
- 12.1.6.3. Company Financials
- 12.1.6.4. SWOT Analysis
- 12.1.7 Freudenberg
- 12.1.7.1. Company Overview
- 12.1.7.2. Products
- 12.1.7.3. Company Financials
- 12.1.7.4. SWOT Analysis
- 12.1.8 UFI Group
- 12.1.8.1. Company Overview
- 12.1.8.2. Products
- 12.1.8.3. Company Financials
- 12.1.8.4. SWOT Analysis
- 12.1.9 Cummins
- 12.1.9.1. Company Overview
- 12.1.9.2. Products
- 12.1.9.3. Company Financials
- 12.1.9.4. SWOT Analysis
- 12.1.10 Donaldson
- 12.1.10.1. Company Overview
- 12.1.10.2. Products
- 12.1.10.3. Company Financials
- 12.1.10.4. SWOT Analysis
- 12.1.11 Sogefi Group
- 12.1.11.1. Company Overview
- 12.1.11.2. Products
- 12.1.11.3. Company Financials
- 12.1.11.4. SWOT Analysis
- 12.1.12 Henan Peace Filter
- 12.1.12.1. Company Overview
- 12.1.12.2. Products
- 12.1.12.3. Company Financials
- 12.1.12.4. SWOT Analysis
- 12.1.13 ROKI Co.
- 12.1.13.1. Company Overview
- 12.1.13.2. Products
- 12.1.13.3. Company Financials
- 12.1.13.4. SWOT Analysis
- 12.1.14 Ltd
- 12.1.14.1. Company Overview
- 12.1.14.2. Products
- 12.1.14.3. Company Financials
- 12.1.14.4. SWOT Analysis
- 12.1.15 Parker Hannifin
- 12.1.15.1. Company Overview
- 12.1.15.2. Products
- 12.1.15.3. Company Financials
- 12.1.15.4. SWOT Analysis
- 12.1.16 ACDelco
- 12.1.16.1. Company Overview
- 12.1.16.2. Products
- 12.1.16.3. Company Financials
- 12.1.16.4. SWOT Analysis
- 12.1.17 APEC KOREA
- 12.1.17.1. Company Overview
- 12.1.17.2. Products
- 12.1.17.3. Company Financials
- 12.1.17.4. SWOT Analysis
- 12.1.18 Fumod
- 12.1.18.1. Company Overview
- 12.1.18.2. Products
- 12.1.18.3. Company Financials
- 12.1.18.4. SWOT Analysis
- 12.1.19 YBM
- 12.1.19.1. Company Overview
- 12.1.19.2. Products
- 12.1.19.3. Company Financials
- 12.1.19.4. SWOT Analysis
- 12.1.20 Zhejiang Universe Filter
- 12.1.20.1. Company Overview
- 12.1.20.2. Products
- 12.1.20.3. Company Financials
- 12.1.20.4. SWOT Analysis
- 12.1.21 Okyia Auto Technology
- 12.1.21.1. Company Overview
- 12.1.21.2. Products
- 12.1.21.3. Company Financials
- 12.1.21.4. SWOT Analysis
- 12.1.22 Guangzhou Yifeng
- 12.1.22.1. Company Overview
- 12.1.22.2. Products
- 12.1.22.3. Company Financials
- 12.1.22.4. SWOT Analysis
- 12.1.1 Mann+Hummel
- 12.2. Market Entropy
- 12.2.1 Company's Key Areas Served
- 12.2.2 Recent Developments
- 12.3. Company Market Share Analysis 2025
- 12.3.1 Top 5 Companies Market Share Analysis
- 12.3.2 Top 3 Companies Market Share Analysis
- 12.4. List of Potential Customers
- 13. Research Methodology
List of Figures
- Figure 1: Global Cabin Filter for Commercial Vehicle Revenue Breakdown (million, %) by Region 2025 & 2033
- Figure 2: Global Cabin Filter for Commercial Vehicle Volume Breakdown (K, %) by Region 2025 & 2033
- Figure 3: North America Cabin Filter for Commercial Vehicle Revenue (million), by Application 2025 & 2033
- Figure 4: North America Cabin Filter for Commercial Vehicle Volume (K), by Application 2025 & 2033
- Figure 5: North America Cabin Filter for Commercial Vehicle Revenue Share (%), by Application 2025 & 2033
- Figure 6: North America Cabin Filter for Commercial Vehicle Volume Share (%), by Application 2025 & 2033
- Figure 7: North America Cabin Filter for Commercial Vehicle Revenue (million), by Types 2025 & 2033
- Figure 8: North America Cabin Filter for Commercial Vehicle Volume (K), by Types 2025 & 2033
- Figure 9: North America Cabin Filter for Commercial Vehicle Revenue Share (%), by Types 2025 & 2033
- Figure 10: North America Cabin Filter for Commercial Vehicle Volume Share (%), by Types 2025 & 2033
- Figure 11: North America Cabin Filter for Commercial Vehicle Revenue (million), by Country 2025 & 2033
- Figure 12: North America Cabin Filter for Commercial Vehicle Volume (K), by Country 2025 & 2033
- Figure 13: North America Cabin Filter for Commercial Vehicle Revenue Share (%), by Country 2025 & 2033
- Figure 14: North America Cabin Filter for Commercial Vehicle Volume Share (%), by Country 2025 & 2033
- Figure 15: South America Cabin Filter for Commercial Vehicle Revenue (million), by Application 2025 & 2033
- Figure 16: South America Cabin Filter for Commercial Vehicle Volume (K), by Application 2025 & 2033
- Figure 17: South America Cabin Filter for Commercial Vehicle Revenue Share (%), by Application 2025 & 2033
- Figure 18: South America Cabin Filter for Commercial Vehicle Volume Share (%), by Application 2025 & 2033
- Figure 19: South America Cabin Filter for Commercial Vehicle Revenue (million), by Types 2025 & 2033
- Figure 20: South America Cabin Filter for Commercial Vehicle Volume (K), by Types 2025 & 2033
- Figure 21: South America Cabin Filter for Commercial Vehicle Revenue Share (%), by Types 2025 & 2033
- Figure 22: South America Cabin Filter for Commercial Vehicle Volume Share (%), by Types 2025 & 2033
- Figure 23: South America Cabin Filter for Commercial Vehicle Revenue (million), by Country 2025 & 2033
- Figure 24: South America Cabin Filter for Commercial Vehicle Volume (K), by Country 2025 & 2033
- Figure 25: South America Cabin Filter for Commercial Vehicle Revenue Share (%), by Country 2025 & 2033
- Figure 26: South America Cabin Filter for Commercial Vehicle Volume Share (%), by Country 2025 & 2033
- Figure 27: Europe Cabin Filter for Commercial Vehicle Revenue (million), by Application 2025 & 2033
- Figure 28: Europe Cabin Filter for Commercial Vehicle Volume (K), by Application 2025 & 2033
- Figure 29: Europe Cabin Filter for Commercial Vehicle Revenue Share (%), by Application 2025 & 2033
- Figure 30: Europe Cabin Filter for Commercial Vehicle Volume Share (%), by Application 2025 & 2033
- Figure 31: Europe Cabin Filter for Commercial Vehicle Revenue (million), by Types 2025 & 2033
- Figure 32: Europe Cabin Filter for Commercial Vehicle Volume (K), by Types 2025 & 2033
- Figure 33: Europe Cabin Filter for Commercial Vehicle Revenue Share (%), by Types 2025 & 2033
- Figure 34: Europe Cabin Filter for Commercial Vehicle Volume Share (%), by Types 2025 & 2033
- Figure 35: Europe Cabin Filter for Commercial Vehicle Revenue (million), by Country 2025 & 2033
- Figure 36: Europe Cabin Filter for Commercial Vehicle Volume (K), by Country 2025 & 2033
- Figure 37: Europe Cabin Filter for Commercial Vehicle Revenue Share (%), by Country 2025 & 2033
- Figure 38: Europe Cabin Filter for Commercial Vehicle Volume Share (%), by Country 2025 & 2033
- Figure 39: Middle East & Africa Cabin Filter for Commercial Vehicle Revenue (million), by Application 2025 & 2033
- Figure 40: Middle East & Africa Cabin Filter for Commercial Vehicle Volume (K), by Application 2025 & 2033
- Figure 41: Middle East & Africa Cabin Filter for Commercial Vehicle Revenue Share (%), by Application 2025 & 2033
- Figure 42: Middle East & Africa Cabin Filter for Commercial Vehicle Volume Share (%), by Application 2025 & 2033
- Figure 43: Middle East & Africa Cabin Filter for Commercial Vehicle Revenue (million), by Types 2025 & 2033
- Figure 44: Middle East & Africa Cabin Filter for Commercial Vehicle Volume (K), by Types 2025 & 2033
- Figure 45: Middle East & Africa Cabin Filter for Commercial Vehicle Revenue Share (%), by Types 2025 & 2033
- Figure 46: Middle East & Africa Cabin Filter for Commercial Vehicle Volume Share (%), by Types 2025 & 2033
- Figure 47: Middle East & Africa Cabin Filter for Commercial Vehicle Revenue (million), by Country 2025 & 2033
- Figure 48: Middle East & Africa Cabin Filter for Commercial Vehicle Volume (K), by Country 2025 & 2033
- Figure 49: Middle East & Africa Cabin Filter for Commercial Vehicle Revenue Share (%), by Country 2025 & 2033
- Figure 50: Middle East & Africa Cabin Filter for Commercial Vehicle Volume Share (%), by Country 2025 & 2033
- Figure 51: Asia Pacific Cabin Filter for Commercial Vehicle Revenue (million), by Application 2025 & 2033
- Figure 52: Asia Pacific Cabin Filter for Commercial Vehicle Volume (K), by Application 2025 & 2033
- Figure 53: Asia Pacific Cabin Filter for Commercial Vehicle Revenue Share (%), by Application 2025 & 2033
- Figure 54: Asia Pacific Cabin Filter for Commercial Vehicle Volume Share (%), by Application 2025 & 2033
- Figure 55: Asia Pacific Cabin Filter for Commercial Vehicle Revenue (million), by Types 2025 & 2033
- Figure 56: Asia Pacific Cabin Filter for Commercial Vehicle Volume (K), by Types 2025 & 2033
- Figure 57: Asia Pacific Cabin Filter for Commercial Vehicle Revenue Share (%), by Types 2025 & 2033
- Figure 58: Asia Pacific Cabin Filter for Commercial Vehicle Volume Share (%), by Types 2025 & 2033
- Figure 59: Asia Pacific Cabin Filter for Commercial Vehicle Revenue (million), by Country 2025 & 2033
- Figure 60: Asia Pacific Cabin Filter for Commercial Vehicle Volume (K), by Country 2025 & 2033
- Figure 61: Asia Pacific Cabin Filter for Commercial Vehicle Revenue Share (%), by Country 2025 & 2033
- Figure 62: Asia Pacific Cabin Filter for Commercial Vehicle Volume Share (%), by Country 2025 & 2033
List of Tables
- Table 1: Global Cabin Filter for Commercial Vehicle Revenue million Forecast, by Application 2020 & 2033
- Table 2: Global Cabin Filter for Commercial Vehicle Volume K Forecast, by Application 2020 & 2033
- Table 3: Global Cabin Filter for Commercial Vehicle Revenue million Forecast, by Types 2020 & 2033
- Table 4: Global Cabin Filter for Commercial Vehicle Volume K Forecast, by Types 2020 & 2033
- Table 5: Global Cabin Filter for Commercial Vehicle Revenue million Forecast, by Region 2020 & 2033
- Table 6: Global Cabin Filter for Commercial Vehicle Volume K Forecast, by Region 2020 & 2033
- Table 7: Global Cabin Filter for Commercial Vehicle Revenue million Forecast, by Application 2020 & 2033
- Table 8: Global Cabin Filter for Commercial Vehicle Volume K Forecast, by Application 2020 & 2033
- Table 9: Global Cabin Filter for Commercial Vehicle Revenue million Forecast, by Types 2020 & 2033
- Table 10: Global Cabin Filter for Commercial Vehicle Volume K Forecast, by Types 2020 & 2033
- Table 11: Global Cabin Filter for Commercial Vehicle Revenue million Forecast, by Country 2020 & 2033
- Table 12: Global Cabin Filter for Commercial Vehicle Volume K Forecast, by Country 2020 & 2033
- Table 13: United States Cabin Filter for Commercial Vehicle Revenue (million) Forecast, by Application 2020 & 2033
- Table 14: United States Cabin Filter for Commercial Vehicle Volume (K) Forecast, by Application 2020 & 2033
- Table 15: Canada Cabin Filter for Commercial Vehicle Revenue (million) Forecast, by Application 2020 & 2033
- Table 16: Canada Cabin Filter for Commercial Vehicle Volume (K) Forecast, by Application 2020 & 2033
- Table 17: Mexico Cabin Filter for Commercial Vehicle Revenue (million) Forecast, by Application 2020 & 2033
- Table 18: Mexico Cabin Filter for Commercial Vehicle Volume (K) Forecast, by Application 2020 & 2033
- Table 19: Global Cabin Filter for Commercial Vehicle Revenue million Forecast, by Application 2020 & 2033
- Table 20: Global Cabin Filter for Commercial Vehicle Volume K Forecast, by Application 2020 & 2033
- Table 21: Global Cabin Filter for Commercial Vehicle Revenue million Forecast, by Types 2020 & 2033
- Table 22: Global Cabin Filter for Commercial Vehicle Volume K Forecast, by Types 2020 & 2033
- Table 23: Global Cabin Filter for Commercial Vehicle Revenue million Forecast, by Country 2020 & 2033
- Table 24: Global Cabin Filter for Commercial Vehicle Volume K Forecast, by Country 2020 & 2033
- Table 25: Brazil Cabin Filter for Commercial Vehicle Revenue (million) Forecast, by Application 2020 & 2033
- Table 26: Brazil Cabin Filter for Commercial Vehicle Volume (K) Forecast, by Application 2020 & 2033
- Table 27: Argentina Cabin Filter for Commercial Vehicle Revenue (million) Forecast, by Application 2020 & 2033
- Table 28: Argentina Cabin Filter for Commercial Vehicle Volume (K) Forecast, by Application 2020 & 2033
- Table 29: Rest of South America Cabin Filter for Commercial Vehicle Revenue (million) Forecast, by Application 2020 & 2033
- Table 30: Rest of South America Cabin Filter for Commercial Vehicle Volume (K) Forecast, by Application 2020 & 2033
- Table 31: Global Cabin Filter for Commercial Vehicle Revenue million Forecast, by Application 2020 & 2033
- Table 32: Global Cabin Filter for Commercial Vehicle Volume K Forecast, by Application 2020 & 2033
- Table 33: Global Cabin Filter for Commercial Vehicle Revenue million Forecast, by Types 2020 & 2033
- Table 34: Global Cabin Filter for Commercial Vehicle Volume K Forecast, by Types 2020 & 2033
- Table 35: Global Cabin Filter for Commercial Vehicle Revenue million Forecast, by Country 2020 & 2033
- Table 36: Global Cabin Filter for Commercial Vehicle Volume K Forecast, by Country 2020 & 2033
- Table 37: United Kingdom Cabin Filter for Commercial Vehicle Revenue (million) Forecast, by Application 2020 & 2033
- Table 38: United Kingdom Cabin Filter for Commercial Vehicle Volume (K) Forecast, by Application 2020 & 2033
- Table 39: Germany Cabin Filter for Commercial Vehicle Revenue (million) Forecast, by Application 2020 & 2033
- Table 40: Germany Cabin Filter for Commercial Vehicle Volume (K) Forecast, by Application 2020 & 2033
- Table 41: France Cabin Filter for Commercial Vehicle Revenue (million) Forecast, by Application 2020 & 2033
- Table 42: France Cabin Filter for Commercial Vehicle Volume (K) Forecast, by Application 2020 & 2033
- Table 43: Italy Cabin Filter for Commercial Vehicle Revenue (million) Forecast, by Application 2020 & 2033
- Table 44: Italy Cabin Filter for Commercial Vehicle Volume (K) Forecast, by Application 2020 & 2033
- Table 45: Spain Cabin Filter for Commercial Vehicle Revenue (million) Forecast, by Application 2020 & 2033
- Table 46: Spain Cabin Filter for Commercial Vehicle Volume (K) Forecast, by Application 2020 & 2033
- Table 47: Russia Cabin Filter for Commercial Vehicle Revenue (million) Forecast, by Application 2020 & 2033
- Table 48: Russia Cabin Filter for Commercial Vehicle Volume (K) Forecast, by Application 2020 & 2033
- Table 49: Benelux Cabin Filter for Commercial Vehicle Revenue (million) Forecast, by Application 2020 & 2033
- Table 50: Benelux Cabin Filter for Commercial Vehicle Volume (K) Forecast, by Application 2020 & 2033
- Table 51: Nordics Cabin Filter for Commercial Vehicle Revenue (million) Forecast, by Application 2020 & 2033
- Table 52: Nordics Cabin Filter for Commercial Vehicle Volume (K) Forecast, by Application 2020 & 2033
- Table 53: Rest of Europe Cabin Filter for Commercial Vehicle Revenue (million) Forecast, by Application 2020 & 2033
- Table 54: Rest of Europe Cabin Filter for Commercial Vehicle Volume (K) Forecast, by Application 2020 & 2033
- Table 55: Global Cabin Filter for Commercial Vehicle Revenue million Forecast, by Application 2020 & 2033
- Table 56: Global Cabin Filter for Commercial Vehicle Volume K Forecast, by Application 2020 & 2033
- Table 57: Global Cabin Filter for Commercial Vehicle Revenue million Forecast, by Types 2020 & 2033
- Table 58: Global Cabin Filter for Commercial Vehicle Volume K Forecast, by Types 2020 & 2033
- Table 59: Global Cabin Filter for Commercial Vehicle Revenue million Forecast, by Country 2020 & 2033
- Table 60: Global Cabin Filter for Commercial Vehicle Volume K Forecast, by Country 2020 & 2033
- Table 61: Turkey Cabin Filter for Commercial Vehicle Revenue (million) Forecast, by Application 2020 & 2033
- Table 62: Turkey Cabin Filter for Commercial Vehicle Volume (K) Forecast, by Application 2020 & 2033
- Table 63: Israel Cabin Filter for Commercial Vehicle Revenue (million) Forecast, by Application 2020 & 2033
- Table 64: Israel Cabin Filter for Commercial Vehicle Volume (K) Forecast, by Application 2020 & 2033
- Table 65: GCC Cabin Filter for Commercial Vehicle Revenue (million) Forecast, by Application 2020 & 2033
- Table 66: GCC Cabin Filter for Commercial Vehicle Volume (K) Forecast, by Application 2020 & 2033
- Table 67: North Africa Cabin Filter for Commercial Vehicle Revenue (million) Forecast, by Application 2020 & 2033
- Table 68: North Africa Cabin Filter for Commercial Vehicle Volume (K) Forecast, by Application 2020 & 2033
- Table 69: South Africa Cabin Filter for Commercial Vehicle Revenue (million) Forecast, by Application 2020 & 2033
- Table 70: South Africa Cabin Filter for Commercial Vehicle Volume (K) Forecast, by Application 2020 & 2033
- Table 71: Rest of Middle East & Africa Cabin Filter for Commercial Vehicle Revenue (million) Forecast, by Application 2020 & 2033
- Table 72: Rest of Middle East & Africa Cabin Filter for Commercial Vehicle Volume (K) Forecast, by Application 2020 & 2033
- Table 73: Global Cabin Filter for Commercial Vehicle Revenue million Forecast, by Application 2020 & 2033
- Table 74: Global Cabin Filter for Commercial Vehicle Volume K Forecast, by Application 2020 & 2033
- Table 75: Global Cabin Filter for Commercial Vehicle Revenue million Forecast, by Types 2020 & 2033
- Table 76: Global Cabin Filter for Commercial Vehicle Volume K Forecast, by Types 2020 & 2033
- Table 77: Global Cabin Filter for Commercial Vehicle Revenue million Forecast, by Country 2020 & 2033
- Table 78: Global Cabin Filter for Commercial Vehicle Volume K Forecast, by Country 2020 & 2033
- Table 79: China Cabin Filter for Commercial Vehicle Revenue (million) Forecast, by Application 2020 & 2033
- Table 80: China Cabin Filter for Commercial Vehicle Volume (K) Forecast, by Application 2020 & 2033
- Table 81: India Cabin Filter for Commercial Vehicle Revenue (million) Forecast, by Application 2020 & 2033
- Table 82: India Cabin Filter for Commercial Vehicle Volume (K) Forecast, by Application 2020 & 2033
- Table 83: Japan Cabin Filter for Commercial Vehicle Revenue (million) Forecast, by Application 2020 & 2033
- Table 84: Japan Cabin Filter for Commercial Vehicle Volume (K) Forecast, by Application 2020 & 2033
- Table 85: South Korea Cabin Filter for Commercial Vehicle Revenue (million) Forecast, by Application 2020 & 2033
- Table 86: South Korea Cabin Filter for Commercial Vehicle Volume (K) Forecast, by Application 2020 & 2033
- Table 87: ASEAN Cabin Filter for Commercial Vehicle Revenue (million) Forecast, by Application 2020 & 2033
- Table 88: ASEAN Cabin Filter for Commercial Vehicle Volume (K) Forecast, by Application 2020 & 2033
- Table 89: Oceania Cabin Filter for Commercial Vehicle Revenue (million) Forecast, by Application 2020 & 2033
- Table 90: Oceania Cabin Filter for Commercial Vehicle Volume (K) Forecast, by Application 2020 & 2033
- Table 91: Rest of Asia Pacific Cabin Filter for Commercial Vehicle Revenue (million) Forecast, by Application 2020 & 2033
- Table 92: Rest of Asia Pacific Cabin Filter for Commercial Vehicle Volume (K) Forecast, by Application 2020 & 2033
Frequently Asked Questions
1. What is the projected Compound Annual Growth Rate (CAGR) of the Cabin Filter for Commercial Vehicle?
The projected CAGR is approximately XX%.
2. Which companies are prominent players in the Cabin Filter for Commercial Vehicle?
Key companies in the market include Mann+Hummel, Mahle, Bosch, Denson Auto Parts, Wix, Fram, Freudenberg, UFI Group, Cummins, Donaldson, Sogefi Group, Henan Peace Filter, ROKI Co., Ltd, Parker Hannifin, ACDelco, APEC KOREA, Fumod, YBM, Zhejiang Universe Filter, Okyia Auto Technology, Guangzhou Yifeng.
3. What are the main segments of the Cabin Filter for Commercial Vehicle?
The market segments include Application, Types.
4. Can you provide details about the market size?
The market size is estimated to be USD XXX million as of 2022.
5. What are some drivers contributing to market growth?
N/A
6. What are the notable trends driving market growth?
N/A
7. Are there any restraints impacting market growth?
N/A
8. Can you provide examples of recent developments in the market?
N/A
9. What pricing options are available for accessing the report?
Pricing options include single-user, multi-user, and enterprise licenses priced at USD 3350.00, USD 5025.00, and USD 6700.00 respectively.
10. Is the market size provided in terms of value or volume?
The market size is provided in terms of value, measured in million and volume, measured in K.
11. Are there any specific market keywords associated with the report?
Yes, the market keyword associated with the report is "Cabin Filter for Commercial Vehicle," which aids in identifying and referencing the specific market segment covered.
12. How do I determine which pricing option suits my needs best?
The pricing options vary based on user requirements and access needs. Individual users may opt for single-user licenses, while businesses requiring broader access may choose multi-user or enterprise licenses for cost-effective access to the report.
13. Are there any additional resources or data provided in the Cabin Filter for Commercial Vehicle report?
While the report offers comprehensive insights, it's advisable to review the specific contents or supplementary materials provided to ascertain if additional resources or data are available.
14. How can I stay updated on further developments or reports in the Cabin Filter for Commercial Vehicle?
To stay informed about further developments, trends, and reports in the Cabin Filter for Commercial Vehicle, consider subscribing to industry newsletters, following relevant companies and organizations, or regularly checking reputable industry news sources and publications.
Methodology
Step 1 - Identification of Relevant Samples Size from Population Database


Step 2 - Approaches for Defining Global Market Size (Value, Volume* & Price*)

Note*: In applicable scenarios
Step 3 - Data Sources
Primary Research
- Web Analytics
- Survey Reports
- Research Institute
- Latest Research Reports
- Opinion Leaders
Secondary Research
- Annual Reports
- White Paper
- Latest Press Release
- Industry Association
- Paid Database
- Investor Presentations

Step 4 - Data Triangulation
Involves using different sources of information in order to increase the validity of a study
These sources are likely to be stakeholders in a program - participants, other researchers, program staff, other community members, and so on.
Then we put all data in single framework & apply various statistical tools to find out the dynamic on the market.
During the analysis stage, feedback from the stakeholder groups would be compared to determine areas of agreement as well as areas of divergence