

Key Insights
The global Cable-laying Vessel market is projected to reach $5.97 billion by 2025, driven by a CAGR of 7.5%. Key growth factors include the expanding telecommunications infrastructure, particularly subsea fiber optic cables for global connectivity, and the burgeoning offshore renewable energy sector necessitating subsea power cable installation. Digital transformation initiatives also contribute to demand for enhanced data transmission networks. The market is segmented by application, with "Telecommunication" and "Electric Power" as leading segments, and by vessel type, with "Self-propelled" vessels anticipated to dominate due to their operational efficiency.
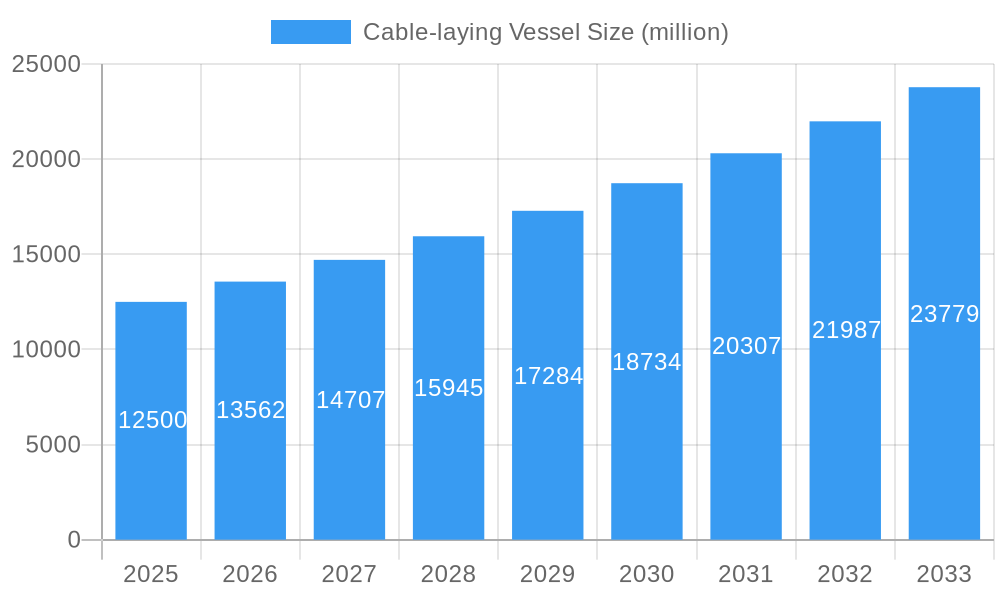
Cable-laying Vessel Market Size (In Billion)
Technological advancements and strategic collaborations are shaping the market. Trends include the development of larger vessels with enhanced capabilities and innovations in subsea cable installation, alongside the adoption of automation and digital technologies. Restraints include high capital expenditure and complex regulatory frameworks. Asia Pacific is expected to lead the market, fueled by economic development and investments in digital infrastructure and offshore energy. Europe is also a significant market due to its established offshore wind industry. Key players are investing in fleet expansion and technological innovation to meet evolving industry demands.
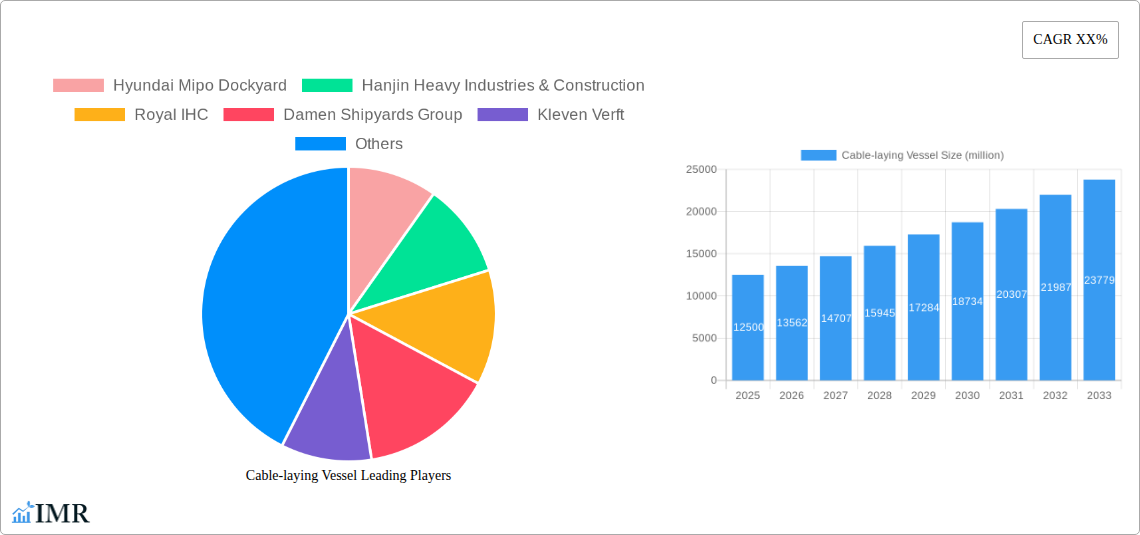
Cable-laying Vessel Company Market Share
Cable-laying Vessel Market: In-depth Analysis & Forecast (2019-2033)
This comprehensive report provides an exhaustive analysis of the global cable-laying vessel market from 2019 to 2033. With a base year of 2025, the report details market dynamics, growth trends, regional analysis, product innovations, key drivers, emerging opportunities, and the competitive landscape. Optimized for SEO, it offers segmented analysis of parent and child market segments. Monetary values are presented in billions.
Cable-laying Vessel Market Dynamics & Structure
The global cable-laying vessel market exhibits a moderate concentration, driven by the substantial capital investment required for vessel construction and operation. Technological innovation is a significant driver, particularly advancements in dynamic positioning systems, subsea laying equipment, and advanced navigation technologies essential for precision cable deployment in challenging offshore environments. Regulatory frameworks, including stringent environmental regulations and maritime safety standards, play a crucial role in shaping operational practices and vessel design. Competitive product substitutes are limited within the specialized cable-laying sector, with traditional vessels being the primary alternative for smaller or less complex projects. End-user demographics are increasingly dominated by telecommunication and electric power sectors, with emerging demand from offshore renewable energy installations. Mergers and acquisitions (M&A) trends are observed as key players seek to expand their fleet capacity, technological capabilities, and geographic reach.
- Market Concentration: Moderate, with a few key players holding significant market share.
- Technological Innovation: Focus on advanced DP systems, specialized laying equipment, and automation.
- Regulatory Frameworks: Stringent safety and environmental compliance are paramount.
- End-User Dominance: Telecommunication (submarine cables), Electric Power (inter-array and export cables for offshore wind), and growing interest from Other (e.g., scientific research).
- M&A Trends: Strategic acquisitions to bolster fleet size and service offerings.
Cable-laying Vessel Growth Trends & Insights
The global cable-laying vessel market is poised for robust growth, projected to witness a Compound Annual Growth Rate (CAGR) of approximately 6.5% from 2025 to 2033. This expansion is fueled by escalating demand for high-speed internet connectivity and the massive investments in subsea telecommunication infrastructure worldwide. The ongoing transition to renewable energy sources, particularly offshore wind farms, is a significant catalyst, requiring extensive subsea power cable installations for inter-array and grid connections. Market penetration of advanced cable-laying technologies is increasing as operators seek greater efficiency, precision, and cost-effectiveness.
Technological disruptions are shaping the industry, with the development of more specialized vessels capable of handling larger and heavier cables, operating in deeper waters, and executing complex installations with enhanced automation. Consumer behavior shifts, in terms of the demand for reliable and high-bandwidth internet services, directly influence the need for expanded submarine cable networks. The increasing need for grid resilience and the development of smart grids also contribute to the demand for offshore power cable laying. Furthermore, government initiatives promoting digital infrastructure and renewable energy expansion are creating a favorable market environment.
- Market Size Evolution: Projected to reach approximately $15,000 million by 2033, from an estimated $8,000 million in 2025.
- CAGR: Approximately 6.5% (2025-2033).
- Adoption Rates: Increasing adoption of advanced, specialized cable-laying vessels.
- Technological Disruptions: Innovations in vessel design, automated laying systems, and deep-sea capabilities.
- Consumer Behavior Shifts: Growing demand for faster internet and reliable energy supply driving infrastructure development.
- Market Penetration: Steadily increasing with project complexity and scale.
Dominant Regions, Countries, or Segments in Cable-laying Vessel
The Telecommunication segment, driven by the insatiable global demand for high-speed internet and the continuous expansion of subsea fiber optic networks, stands as the dominant force in the cable-laying vessel market. This segment accounts for an estimated 55% of the market share in 2025 and is projected to maintain its lead throughout the forecast period. The proliferation of data centers, the rise of cloud computing, and the increasing reliance on digital communication for business and personal use necessitate continuous investment in submarine telecommunication cables.
Electric Power is the second-largest and fastest-growing segment, primarily fueled by the global surge in offshore wind energy development. The installation of inter-array cables connecting wind turbines and export cables transmitting power to onshore grids requires a substantial number of specialized cable-laying vessels. European nations, with their extensive offshore wind portfolios, are leading this demand. Asia-Pacific, particularly China and Southeast Asia, is emerging as a significant growth region for both telecommunication and electric power cable laying due to rapid industrialization and infrastructure development.
- Dominant Application Segment: Telecommunication (approx. 55% market share in 2025).
- Key Drivers: Global demand for high-speed internet, data center expansion, cloud computing growth.
- Market Share: Consistent high share driven by ongoing network upgrades and new deployments.
- Fastest Growing Application Segment: Electric Power (especially for offshore wind farms).
- Key Drivers: Renewable energy transition, government support for offshore wind, grid modernization.
- Growth Potential: Significant growth anticipated due to ambitious offshore wind targets.
- Dominant Region: Europe, particularly for offshore wind installations, followed by North America and Asia-Pacific for telecommunication infrastructure.
- Emerging Trend: Increasing demand for hybrid vessels capable of both telecommunication and power cable laying.
- Type Dominance: Self-propelled vessels are generally favored for their operational flexibility and efficiency in deep-sea operations, representing approximately 70% of the market value.
Cable-laying Vessel Product Landscape
The cable-laying vessel product landscape is characterized by continuous innovation aimed at enhancing efficiency, safety, and capability. Modern vessels are equipped with advanced dynamic positioning (DP) systems for precise station-keeping in challenging sea conditions, sophisticated cable tensioners and carousels for secure cable handling, and specialized ploughs and trenchers for burial operations. Key technological advancements include the integration of remotely operated vehicles (ROVs) for inspection and intervention, improved bollard pull for towing heavier cables, and enhanced deck capacity for longer cable lays. Unique selling propositions revolve around specialized configurations for different cable types (e.g., power vs. fiber optic), deep-water capabilities, and reduced environmental impact through optimized fuel consumption and emission control systems.
Key Drivers, Barriers & Challenges in Cable-laying Vessel
The cable-laying vessel market is propelled by several key drivers. The relentless global demand for enhanced digital connectivity and the expansion of subsea telecommunication networks are paramount. The accelerating transition towards renewable energy sources, particularly offshore wind, necessitates substantial investments in subsea power cable infrastructure. Government policies supporting infrastructure development and digital transformation also act as significant growth accelerators. Technological advancements in vessel design and operational capabilities further fuel market expansion.
However, the industry faces several barriers and challenges. The immense capital expenditure required for building and maintaining specialized cable-laying vessels presents a significant barrier to entry. Stringent environmental regulations and the need for compliance with safety standards can increase operational costs. The cyclical nature of large-scale infrastructure projects can lead to periods of underutilization. Furthermore, supply chain disruptions for critical components and skilled labor shortages can impact project timelines and profitability. The competitive landscape, while not overly saturated, can lead to pricing pressures on contracts.
Emerging Opportunities in Cable-laying Vessel
Emerging opportunities in the cable-laying vessel sector are predominantly centered around the burgeoning offshore renewable energy market. The expansion of floating wind farms and the development of intercontinental power grids present new avenues for specialized cable installation. The increasing demand for subsea internet cables to connect emerging economies and remote regions also offers significant potential. Furthermore, the development of greener shipping technologies, including the adoption of alternative fuels and advanced hull designs for vessels, represents an evolving consumer preference and a potential competitive advantage. The deployment of subsea carbon capture and storage (CCS) infrastructure also signals a future opportunity.
Growth Accelerators in the Cable-laying Vessel Industry
Several catalysts are accelerating the growth of the cable-laying vessel industry. Technological breakthroughs in autonomous underwater vehicles (AUVs) and advanced robotics are enhancing operational efficiency and reducing human intervention in hazardous environments. Strategic partnerships between vessel operators, cable manufacturers, and renewable energy developers are streamlining project execution and resource allocation. Market expansion into new geographical regions with developing digital and energy infrastructure, particularly in Asia-Pacific and Africa, is a key growth strategy. Government incentives and favorable regulatory environments for both telecommunication upgrades and renewable energy projects are also critical growth accelerators.
Key Players Shaping the Cable-laying Vessel Market
- Hyundai Mipo Dockyard
- Hanjin Heavy Industries & Construction
- Royal IHC
- Damen Shipyards Group
- Kleven Verft
- Nexans
- Mitsubishi Heavy Industries
- Colombo Dockyard
- Zhejiang Qiming Group
- Fujian Mawei ShipBuilding
- Vard Group AS
- SembCorp Marine
Notable Milestones in Cable-laying Vessel Sector
- 2019: Launch of Nexans' Aurora, a state-of-the-art cable-laying vessel designed for high-voltage subsea power cables, significantly enhancing its offshore wind capabilities.
- 2020: Royal IHC delivers a highly advanced cable-laying vessel to a major European operator, featuring enhanced DP capabilities and larger cable-handling systems.
- 2021: Damen Shipyards Group announces a new series of modular cable-laying vessels designed for flexibility and efficiency across various project types.
- 2022: Mitsubishi Heavy Industries secures orders for advanced cable-laying vessels, highlighting its growing presence in the offshore infrastructure sector.
- 2023: SembCorp Marine commissions a large-capacity cable-laying vessel, bolstering its fleet for complex subsea projects.
- 2024: Hanjin Heavy Industries & Construction continues to expand its shipbuilding capacity for specialized offshore vessels, including cable layers.
- 2025 (Estimated): Anticipated significant increase in the deployment of vessels for large-scale offshore wind farm construction and subsea telecommunication expansion projects.
In-Depth Cable-laying Vessel Market Outlook
The future outlook for the cable-laying vessel market is exceptionally strong, driven by the continued global push for enhanced digital connectivity and the critical role of subsea cables in the energy transition. Growth accelerators, such as ongoing investments in renewable energy infrastructure, government support for digital transformation, and technological advancements in vessel design and operation, will continue to fuel demand. Strategic partnerships and expansion into emerging markets are expected to further solidify the industry's growth trajectory. The market is poised for sustained expansion, driven by a confluence of technological innovation and indispensable global infrastructure needs.
Cable-laying Vessel Segmentation
-
1. Application
- 1.1. Telecommunication
- 1.2. Electric Power
- 1.3. Others
-
2. Types
- 2.1. Self-propelled
- 2.2. Non-self-propelled
Cable-laying Vessel Segmentation By Geography
-
1. North America
- 1.1. United States
- 1.2. Canada
- 1.3. Mexico
-
2. South America
- 2.1. Brazil
- 2.2. Argentina
- 2.3. Rest of South America
-
3. Europe
- 3.1. United Kingdom
- 3.2. Germany
- 3.3. France
- 3.4. Italy
- 3.5. Spain
- 3.6. Russia
- 3.7. Benelux
- 3.8. Nordics
- 3.9. Rest of Europe
-
4. Middle East & Africa
- 4.1. Turkey
- 4.2. Israel
- 4.3. GCC
- 4.4. North Africa
- 4.5. South Africa
- 4.6. Rest of Middle East & Africa
-
5. Asia Pacific
- 5.1. China
- 5.2. India
- 5.3. Japan
- 5.4. South Korea
- 5.5. ASEAN
- 5.6. Oceania
- 5.7. Rest of Asia Pacific
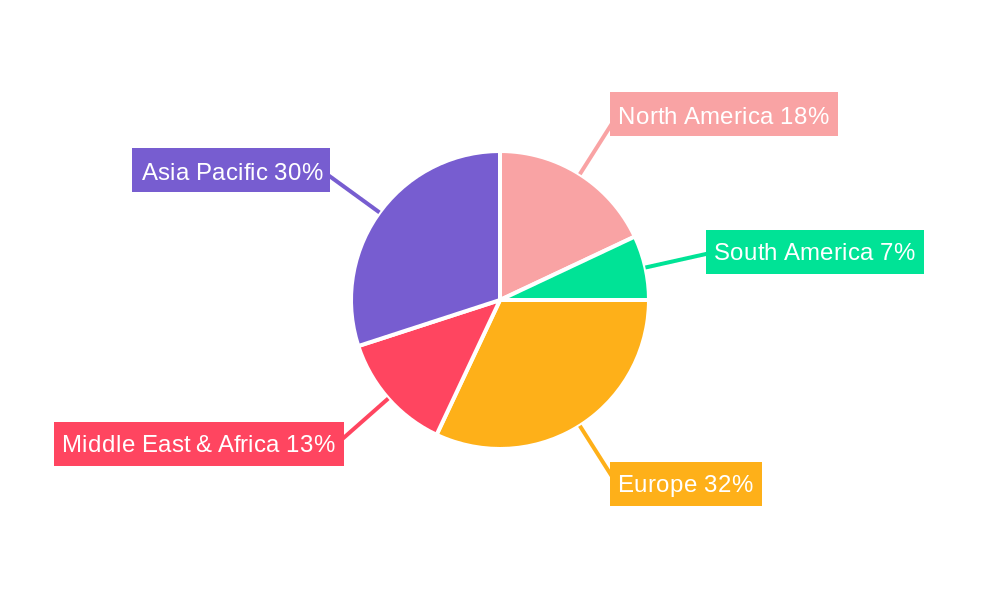
Cable-laying Vessel Regional Market Share
Geographic Coverage of Cable-laying Vessel
Cable-laying Vessel REPORT HIGHLIGHTS
| Aspects | Details |
|---|---|
| Study Period | 2020-2034 |
| Base Year | 2025 |
| Estimated Year | 2026 |
| Forecast Period | 2026-2034 |
| Historical Period | 2020-2025 |
| Growth Rate | CAGR of 7.5% from 2020-2034 |
| Segmentation |
|
Table of Contents
- 1. Introduction
- 1.1. Research Scope
- 1.2. Market Segmentation
- 1.3. Research Objective
- 1.4. Definitions and Assumptions
- 2. Executive Summary
- 2.1. Market Snapshot
- 3. Market Dynamics
- 3.1. Market Drivers
- 3.2. Market Restrains
- 3.3. Market Trends
- 3.4. Market Opportunities
- 4. Market Factor Analysis
- 4.1. Porters Five Forces
- 4.1.1. Bargaining Power of Suppliers
- 4.1.2. Bargaining Power of Buyers
- 4.1.3. Threat of New Entrants
- 4.1.4. Threat of Substitutes
- 4.1.5. Competitive Rivalry
- 4.2. PESTEL analysis
- 4.3. BCG Analysis
- 4.3.1. Stars (High Growth, High Market Share)
- 4.3.2. Cash Cows (Low Growth, High Market Share)
- 4.3.3. Question Mark (High Growth, Low Market Share)
- 4.3.4. Dogs (Low Growth, Low Market Share)
- 4.4. Ansoff Matrix Analysis
- 4.5. Supply Chain Analysis
- 4.6. Regulatory Landscape
- 4.7. Current Market Potential and Opportunity Assessment (TAM–SAM–SOM Framework)
- 4.8. IMR Analyst Note
- 4.1. Porters Five Forces
- 5. Market Analysis, Insights and Forecast 2021-2033
- 5.1. Market Analysis, Insights and Forecast - by Application
- 5.1.1. Telecommunication
- 5.1.2. Electric Power
- 5.1.3. Others
- 5.2. Market Analysis, Insights and Forecast - by Types
- 5.2.1. Self-propelled
- 5.2.2. Non-self-propelled
- 5.3. Market Analysis, Insights and Forecast - by Region
- 5.3.1. North America
- 5.3.2. South America
- 5.3.3. Europe
- 5.3.4. Middle East & Africa
- 5.3.5. Asia Pacific
- 5.1. Market Analysis, Insights and Forecast - by Application
- 6. Global Cable-laying Vessel Analysis, Insights and Forecast, 2021-2033
- 6.1. Market Analysis, Insights and Forecast - by Application
- 6.1.1. Telecommunication
- 6.1.2. Electric Power
- 6.1.3. Others
- 6.2. Market Analysis, Insights and Forecast - by Types
- 6.2.1. Self-propelled
- 6.2.2. Non-self-propelled
- 6.1. Market Analysis, Insights and Forecast - by Application
- 7. North America Cable-laying Vessel Analysis, Insights and Forecast, 2020-2032
- 7.1. Market Analysis, Insights and Forecast - by Application
- 7.1.1. Telecommunication
- 7.1.2. Electric Power
- 7.1.3. Others
- 7.2. Market Analysis, Insights and Forecast - by Types
- 7.2.1. Self-propelled
- 7.2.2. Non-self-propelled
- 7.1. Market Analysis, Insights and Forecast - by Application
- 8. South America Cable-laying Vessel Analysis, Insights and Forecast, 2020-2032
- 8.1. Market Analysis, Insights and Forecast - by Application
- 8.1.1. Telecommunication
- 8.1.2. Electric Power
- 8.1.3. Others
- 8.2. Market Analysis, Insights and Forecast - by Types
- 8.2.1. Self-propelled
- 8.2.2. Non-self-propelled
- 8.1. Market Analysis, Insights and Forecast - by Application
- 9. Europe Cable-laying Vessel Analysis, Insights and Forecast, 2020-2032
- 9.1. Market Analysis, Insights and Forecast - by Application
- 9.1.1. Telecommunication
- 9.1.2. Electric Power
- 9.1.3. Others
- 9.2. Market Analysis, Insights and Forecast - by Types
- 9.2.1. Self-propelled
- 9.2.2. Non-self-propelled
- 9.1. Market Analysis, Insights and Forecast - by Application
- 10. Middle East & Africa Cable-laying Vessel Analysis, Insights and Forecast, 2020-2032
- 10.1. Market Analysis, Insights and Forecast - by Application
- 10.1.1. Telecommunication
- 10.1.2. Electric Power
- 10.1.3. Others
- 10.2. Market Analysis, Insights and Forecast - by Types
- 10.2.1. Self-propelled
- 10.2.2. Non-self-propelled
- 10.1. Market Analysis, Insights and Forecast - by Application
- 11. Asia Pacific Cable-laying Vessel Analysis, Insights and Forecast, 2020-2032
- 11.1. Market Analysis, Insights and Forecast - by Application
- 11.1.1. Telecommunication
- 11.1.2. Electric Power
- 11.1.3. Others
- 11.2. Market Analysis, Insights and Forecast - by Types
- 11.2.1. Self-propelled
- 11.2.2. Non-self-propelled
- 11.1. Market Analysis, Insights and Forecast - by Application
- 12. Competitive Analysis
- 12.1. Company Profiles
- 12.1.1 Hyundai Mipo Dockyard
- 12.1.1.1. Company Overview
- 12.1.1.2. Products
- 12.1.1.3. Company Financials
- 12.1.1.4. SWOT Analysis
- 12.1.2 Hanjin Heavy Industries & Construction
- 12.1.2.1. Company Overview
- 12.1.2.2. Products
- 12.1.2.3. Company Financials
- 12.1.2.4. SWOT Analysis
- 12.1.3 Royal IHC
- 12.1.3.1. Company Overview
- 12.1.3.2. Products
- 12.1.3.3. Company Financials
- 12.1.3.4. SWOT Analysis
- 12.1.4 Damen Shipyards Group
- 12.1.4.1. Company Overview
- 12.1.4.2. Products
- 12.1.4.3. Company Financials
- 12.1.4.4. SWOT Analysis
- 12.1.5 Kleven Verft
- 12.1.5.1. Company Overview
- 12.1.5.2. Products
- 12.1.5.3. Company Financials
- 12.1.5.4. SWOT Analysis
- 12.1.6 Nexans
- 12.1.6.1. Company Overview
- 12.1.6.2. Products
- 12.1.6.3. Company Financials
- 12.1.6.4. SWOT Analysis
- 12.1.7 Mitsubishi Heavy Industries
- 12.1.7.1. Company Overview
- 12.1.7.2. Products
- 12.1.7.3. Company Financials
- 12.1.7.4. SWOT Analysis
- 12.1.8 Colombo Dockyard
- 12.1.8.1. Company Overview
- 12.1.8.2. Products
- 12.1.8.3. Company Financials
- 12.1.8.4. SWOT Analysis
- 12.1.9 Zhejiang Qiming Group
- 12.1.9.1. Company Overview
- 12.1.9.2. Products
- 12.1.9.3. Company Financials
- 12.1.9.4. SWOT Analysis
- 12.1.10 Fujian Mawei ShipBuilding
- 12.1.10.1. Company Overview
- 12.1.10.2. Products
- 12.1.10.3. Company Financials
- 12.1.10.4. SWOT Analysis
- 12.1.11 Vard Group AS
- 12.1.11.1. Company Overview
- 12.1.11.2. Products
- 12.1.11.3. Company Financials
- 12.1.11.4. SWOT Analysis
- 12.1.12 SembCorp Marine
- 12.1.12.1. Company Overview
- 12.1.12.2. Products
- 12.1.12.3. Company Financials
- 12.1.12.4. SWOT Analysis
- 12.1.1 Hyundai Mipo Dockyard
- 12.2. Market Entropy
- 12.2.1 Company's Key Areas Served
- 12.2.2 Recent Developments
- 12.3. Company Market Share Analysis 2025
- 12.3.1 Top 5 Companies Market Share Analysis
- 12.3.2 Top 3 Companies Market Share Analysis
- 12.4. List of Potential Customers
- 13. Research Methodology
List of Figures
- Figure 1: Global Cable-laying Vessel Revenue Breakdown (billion, %) by Region 2025 & 2033
- Figure 2: Global Cable-laying Vessel Volume Breakdown (K, %) by Region 2025 & 2033
- Figure 3: North America Cable-laying Vessel Revenue (billion), by Application 2025 & 2033
- Figure 4: North America Cable-laying Vessel Volume (K), by Application 2025 & 2033
- Figure 5: North America Cable-laying Vessel Revenue Share (%), by Application 2025 & 2033
- Figure 6: North America Cable-laying Vessel Volume Share (%), by Application 2025 & 2033
- Figure 7: North America Cable-laying Vessel Revenue (billion), by Types 2025 & 2033
- Figure 8: North America Cable-laying Vessel Volume (K), by Types 2025 & 2033
- Figure 9: North America Cable-laying Vessel Revenue Share (%), by Types 2025 & 2033
- Figure 10: North America Cable-laying Vessel Volume Share (%), by Types 2025 & 2033
- Figure 11: North America Cable-laying Vessel Revenue (billion), by Country 2025 & 2033
- Figure 12: North America Cable-laying Vessel Volume (K), by Country 2025 & 2033
- Figure 13: North America Cable-laying Vessel Revenue Share (%), by Country 2025 & 2033
- Figure 14: North America Cable-laying Vessel Volume Share (%), by Country 2025 & 2033
- Figure 15: South America Cable-laying Vessel Revenue (billion), by Application 2025 & 2033
- Figure 16: South America Cable-laying Vessel Volume (K), by Application 2025 & 2033
- Figure 17: South America Cable-laying Vessel Revenue Share (%), by Application 2025 & 2033
- Figure 18: South America Cable-laying Vessel Volume Share (%), by Application 2025 & 2033
- Figure 19: South America Cable-laying Vessel Revenue (billion), by Types 2025 & 2033
- Figure 20: South America Cable-laying Vessel Volume (K), by Types 2025 & 2033
- Figure 21: South America Cable-laying Vessel Revenue Share (%), by Types 2025 & 2033
- Figure 22: South America Cable-laying Vessel Volume Share (%), by Types 2025 & 2033
- Figure 23: South America Cable-laying Vessel Revenue (billion), by Country 2025 & 2033
- Figure 24: South America Cable-laying Vessel Volume (K), by Country 2025 & 2033
- Figure 25: South America Cable-laying Vessel Revenue Share (%), by Country 2025 & 2033
- Figure 26: South America Cable-laying Vessel Volume Share (%), by Country 2025 & 2033
- Figure 27: Europe Cable-laying Vessel Revenue (billion), by Application 2025 & 2033
- Figure 28: Europe Cable-laying Vessel Volume (K), by Application 2025 & 2033
- Figure 29: Europe Cable-laying Vessel Revenue Share (%), by Application 2025 & 2033
- Figure 30: Europe Cable-laying Vessel Volume Share (%), by Application 2025 & 2033
- Figure 31: Europe Cable-laying Vessel Revenue (billion), by Types 2025 & 2033
- Figure 32: Europe Cable-laying Vessel Volume (K), by Types 2025 & 2033
- Figure 33: Europe Cable-laying Vessel Revenue Share (%), by Types 2025 & 2033
- Figure 34: Europe Cable-laying Vessel Volume Share (%), by Types 2025 & 2033
- Figure 35: Europe Cable-laying Vessel Revenue (billion), by Country 2025 & 2033
- Figure 36: Europe Cable-laying Vessel Volume (K), by Country 2025 & 2033
- Figure 37: Europe Cable-laying Vessel Revenue Share (%), by Country 2025 & 2033
- Figure 38: Europe Cable-laying Vessel Volume Share (%), by Country 2025 & 2033
- Figure 39: Middle East & Africa Cable-laying Vessel Revenue (billion), by Application 2025 & 2033
- Figure 40: Middle East & Africa Cable-laying Vessel Volume (K), by Application 2025 & 2033
- Figure 41: Middle East & Africa Cable-laying Vessel Revenue Share (%), by Application 2025 & 2033
- Figure 42: Middle East & Africa Cable-laying Vessel Volume Share (%), by Application 2025 & 2033
- Figure 43: Middle East & Africa Cable-laying Vessel Revenue (billion), by Types 2025 & 2033
- Figure 44: Middle East & Africa Cable-laying Vessel Volume (K), by Types 2025 & 2033
- Figure 45: Middle East & Africa Cable-laying Vessel Revenue Share (%), by Types 2025 & 2033
- Figure 46: Middle East & Africa Cable-laying Vessel Volume Share (%), by Types 2025 & 2033
- Figure 47: Middle East & Africa Cable-laying Vessel Revenue (billion), by Country 2025 & 2033
- Figure 48: Middle East & Africa Cable-laying Vessel Volume (K), by Country 2025 & 2033
- Figure 49: Middle East & Africa Cable-laying Vessel Revenue Share (%), by Country 2025 & 2033
- Figure 50: Middle East & Africa Cable-laying Vessel Volume Share (%), by Country 2025 & 2033
- Figure 51: Asia Pacific Cable-laying Vessel Revenue (billion), by Application 2025 & 2033
- Figure 52: Asia Pacific Cable-laying Vessel Volume (K), by Application 2025 & 2033
- Figure 53: Asia Pacific Cable-laying Vessel Revenue Share (%), by Application 2025 & 2033
- Figure 54: Asia Pacific Cable-laying Vessel Volume Share (%), by Application 2025 & 2033
- Figure 55: Asia Pacific Cable-laying Vessel Revenue (billion), by Types 2025 & 2033
- Figure 56: Asia Pacific Cable-laying Vessel Volume (K), by Types 2025 & 2033
- Figure 57: Asia Pacific Cable-laying Vessel Revenue Share (%), by Types 2025 & 2033
- Figure 58: Asia Pacific Cable-laying Vessel Volume Share (%), by Types 2025 & 2033
- Figure 59: Asia Pacific Cable-laying Vessel Revenue (billion), by Country 2025 & 2033
- Figure 60: Asia Pacific Cable-laying Vessel Volume (K), by Country 2025 & 2033
- Figure 61: Asia Pacific Cable-laying Vessel Revenue Share (%), by Country 2025 & 2033
- Figure 62: Asia Pacific Cable-laying Vessel Volume Share (%), by Country 2025 & 2033
List of Tables
- Table 1: Global Cable-laying Vessel Revenue billion Forecast, by Application 2020 & 2033
- Table 2: Global Cable-laying Vessel Volume K Forecast, by Application 2020 & 2033
- Table 3: Global Cable-laying Vessel Revenue billion Forecast, by Types 2020 & 2033
- Table 4: Global Cable-laying Vessel Volume K Forecast, by Types 2020 & 2033
- Table 5: Global Cable-laying Vessel Revenue billion Forecast, by Region 2020 & 2033
- Table 6: Global Cable-laying Vessel Volume K Forecast, by Region 2020 & 2033
- Table 7: Global Cable-laying Vessel Revenue billion Forecast, by Application 2020 & 2033
- Table 8: Global Cable-laying Vessel Volume K Forecast, by Application 2020 & 2033
- Table 9: Global Cable-laying Vessel Revenue billion Forecast, by Types 2020 & 2033
- Table 10: Global Cable-laying Vessel Volume K Forecast, by Types 2020 & 2033
- Table 11: Global Cable-laying Vessel Revenue billion Forecast, by Country 2020 & 2033
- Table 12: Global Cable-laying Vessel Volume K Forecast, by Country 2020 & 2033
- Table 13: United States Cable-laying Vessel Revenue (billion) Forecast, by Application 2020 & 2033
- Table 14: United States Cable-laying Vessel Volume (K) Forecast, by Application 2020 & 2033
- Table 15: Canada Cable-laying Vessel Revenue (billion) Forecast, by Application 2020 & 2033
- Table 16: Canada Cable-laying Vessel Volume (K) Forecast, by Application 2020 & 2033
- Table 17: Mexico Cable-laying Vessel Revenue (billion) Forecast, by Application 2020 & 2033
- Table 18: Mexico Cable-laying Vessel Volume (K) Forecast, by Application 2020 & 2033
- Table 19: Global Cable-laying Vessel Revenue billion Forecast, by Application 2020 & 2033
- Table 20: Global Cable-laying Vessel Volume K Forecast, by Application 2020 & 2033
- Table 21: Global Cable-laying Vessel Revenue billion Forecast, by Types 2020 & 2033
- Table 22: Global Cable-laying Vessel Volume K Forecast, by Types 2020 & 2033
- Table 23: Global Cable-laying Vessel Revenue billion Forecast, by Country 2020 & 2033
- Table 24: Global Cable-laying Vessel Volume K Forecast, by Country 2020 & 2033
- Table 25: Brazil Cable-laying Vessel Revenue (billion) Forecast, by Application 2020 & 2033
- Table 26: Brazil Cable-laying Vessel Volume (K) Forecast, by Application 2020 & 2033
- Table 27: Argentina Cable-laying Vessel Revenue (billion) Forecast, by Application 2020 & 2033
- Table 28: Argentina Cable-laying Vessel Volume (K) Forecast, by Application 2020 & 2033
- Table 29: Rest of South America Cable-laying Vessel Revenue (billion) Forecast, by Application 2020 & 2033
- Table 30: Rest of South America Cable-laying Vessel Volume (K) Forecast, by Application 2020 & 2033
- Table 31: Global Cable-laying Vessel Revenue billion Forecast, by Application 2020 & 2033
- Table 32: Global Cable-laying Vessel Volume K Forecast, by Application 2020 & 2033
- Table 33: Global Cable-laying Vessel Revenue billion Forecast, by Types 2020 & 2033
- Table 34: Global Cable-laying Vessel Volume K Forecast, by Types 2020 & 2033
- Table 35: Global Cable-laying Vessel Revenue billion Forecast, by Country 2020 & 2033
- Table 36: Global Cable-laying Vessel Volume K Forecast, by Country 2020 & 2033
- Table 37: United Kingdom Cable-laying Vessel Revenue (billion) Forecast, by Application 2020 & 2033
- Table 38: United Kingdom Cable-laying Vessel Volume (K) Forecast, by Application 2020 & 2033
- Table 39: Germany Cable-laying Vessel Revenue (billion) Forecast, by Application 2020 & 2033
- Table 40: Germany Cable-laying Vessel Volume (K) Forecast, by Application 2020 & 2033
- Table 41: France Cable-laying Vessel Revenue (billion) Forecast, by Application 2020 & 2033
- Table 42: France Cable-laying Vessel Volume (K) Forecast, by Application 2020 & 2033
- Table 43: Italy Cable-laying Vessel Revenue (billion) Forecast, by Application 2020 & 2033
- Table 44: Italy Cable-laying Vessel Volume (K) Forecast, by Application 2020 & 2033
- Table 45: Spain Cable-laying Vessel Revenue (billion) Forecast, by Application 2020 & 2033
- Table 46: Spain Cable-laying Vessel Volume (K) Forecast, by Application 2020 & 2033
- Table 47: Russia Cable-laying Vessel Revenue (billion) Forecast, by Application 2020 & 2033
- Table 48: Russia Cable-laying Vessel Volume (K) Forecast, by Application 2020 & 2033
- Table 49: Benelux Cable-laying Vessel Revenue (billion) Forecast, by Application 2020 & 2033
- Table 50: Benelux Cable-laying Vessel Volume (K) Forecast, by Application 2020 & 2033
- Table 51: Nordics Cable-laying Vessel Revenue (billion) Forecast, by Application 2020 & 2033
- Table 52: Nordics Cable-laying Vessel Volume (K) Forecast, by Application 2020 & 2033
- Table 53: Rest of Europe Cable-laying Vessel Revenue (billion) Forecast, by Application 2020 & 2033
- Table 54: Rest of Europe Cable-laying Vessel Volume (K) Forecast, by Application 2020 & 2033
- Table 55: Global Cable-laying Vessel Revenue billion Forecast, by Application 2020 & 2033
- Table 56: Global Cable-laying Vessel Volume K Forecast, by Application 2020 & 2033
- Table 57: Global Cable-laying Vessel Revenue billion Forecast, by Types 2020 & 2033
- Table 58: Global Cable-laying Vessel Volume K Forecast, by Types 2020 & 2033
- Table 59: Global Cable-laying Vessel Revenue billion Forecast, by Country 2020 & 2033
- Table 60: Global Cable-laying Vessel Volume K Forecast, by Country 2020 & 2033
- Table 61: Turkey Cable-laying Vessel Revenue (billion) Forecast, by Application 2020 & 2033
- Table 62: Turkey Cable-laying Vessel Volume (K) Forecast, by Application 2020 & 2033
- Table 63: Israel Cable-laying Vessel Revenue (billion) Forecast, by Application 2020 & 2033
- Table 64: Israel Cable-laying Vessel Volume (K) Forecast, by Application 2020 & 2033
- Table 65: GCC Cable-laying Vessel Revenue (billion) Forecast, by Application 2020 & 2033
- Table 66: GCC Cable-laying Vessel Volume (K) Forecast, by Application 2020 & 2033
- Table 67: North Africa Cable-laying Vessel Revenue (billion) Forecast, by Application 2020 & 2033
- Table 68: North Africa Cable-laying Vessel Volume (K) Forecast, by Application 2020 & 2033
- Table 69: South Africa Cable-laying Vessel Revenue (billion) Forecast, by Application 2020 & 2033
- Table 70: South Africa Cable-laying Vessel Volume (K) Forecast, by Application 2020 & 2033
- Table 71: Rest of Middle East & Africa Cable-laying Vessel Revenue (billion) Forecast, by Application 2020 & 2033
- Table 72: Rest of Middle East & Africa Cable-laying Vessel Volume (K) Forecast, by Application 2020 & 2033
- Table 73: Global Cable-laying Vessel Revenue billion Forecast, by Application 2020 & 2033
- Table 74: Global Cable-laying Vessel Volume K Forecast, by Application 2020 & 2033
- Table 75: Global Cable-laying Vessel Revenue billion Forecast, by Types 2020 & 2033
- Table 76: Global Cable-laying Vessel Volume K Forecast, by Types 2020 & 2033
- Table 77: Global Cable-laying Vessel Revenue billion Forecast, by Country 2020 & 2033
- Table 78: Global Cable-laying Vessel Volume K Forecast, by Country 2020 & 2033
- Table 79: China Cable-laying Vessel Revenue (billion) Forecast, by Application 2020 & 2033
- Table 80: China Cable-laying Vessel Volume (K) Forecast, by Application 2020 & 2033
- Table 81: India Cable-laying Vessel Revenue (billion) Forecast, by Application 2020 & 2033
- Table 82: India Cable-laying Vessel Volume (K) Forecast, by Application 2020 & 2033
- Table 83: Japan Cable-laying Vessel Revenue (billion) Forecast, by Application 2020 & 2033
- Table 84: Japan Cable-laying Vessel Volume (K) Forecast, by Application 2020 & 2033
- Table 85: South Korea Cable-laying Vessel Revenue (billion) Forecast, by Application 2020 & 2033
- Table 86: South Korea Cable-laying Vessel Volume (K) Forecast, by Application 2020 & 2033
- Table 87: ASEAN Cable-laying Vessel Revenue (billion) Forecast, by Application 2020 & 2033
- Table 88: ASEAN Cable-laying Vessel Volume (K) Forecast, by Application 2020 & 2033
- Table 89: Oceania Cable-laying Vessel Revenue (billion) Forecast, by Application 2020 & 2033
- Table 90: Oceania Cable-laying Vessel Volume (K) Forecast, by Application 2020 & 2033
- Table 91: Rest of Asia Pacific Cable-laying Vessel Revenue (billion) Forecast, by Application 2020 & 2033
- Table 92: Rest of Asia Pacific Cable-laying Vessel Volume (K) Forecast, by Application 2020 & 2033
Frequently Asked Questions
1. What is the projected Compound Annual Growth Rate (CAGR) of the Cable-laying Vessel?
The projected CAGR is approximately 7.5%.
2. Which companies are prominent players in the Cable-laying Vessel?
Key companies in the market include Hyundai Mipo Dockyard, Hanjin Heavy Industries & Construction, Royal IHC, Damen Shipyards Group, Kleven Verft, Nexans, Mitsubishi Heavy Industries, Colombo Dockyard, Zhejiang Qiming Group, Fujian Mawei ShipBuilding, Vard Group AS, SembCorp Marine.
3. What are the main segments of the Cable-laying Vessel?
The market segments include Application, Types.
4. Can you provide details about the market size?
The market size is estimated to be USD 5.97 billion as of 2022.
5. What are some drivers contributing to market growth?
N/A
6. What are the notable trends driving market growth?
N/A
7. Are there any restraints impacting market growth?
N/A
8. Can you provide examples of recent developments in the market?
N/A
9. What pricing options are available for accessing the report?
Pricing options include single-user, multi-user, and enterprise licenses priced at USD 3350.00, USD 5025.00, and USD 6700.00 respectively.
10. Is the market size provided in terms of value or volume?
The market size is provided in terms of value, measured in billion and volume, measured in K.
11. Are there any specific market keywords associated with the report?
Yes, the market keyword associated with the report is "Cable-laying Vessel," which aids in identifying and referencing the specific market segment covered.
12. How do I determine which pricing option suits my needs best?
The pricing options vary based on user requirements and access needs. Individual users may opt for single-user licenses, while businesses requiring broader access may choose multi-user or enterprise licenses for cost-effective access to the report.
13. Are there any additional resources or data provided in the Cable-laying Vessel report?
While the report offers comprehensive insights, it's advisable to review the specific contents or supplementary materials provided to ascertain if additional resources or data are available.
14. How can I stay updated on further developments or reports in the Cable-laying Vessel?
To stay informed about further developments, trends, and reports in the Cable-laying Vessel, consider subscribing to industry newsletters, following relevant companies and organizations, or regularly checking reputable industry news sources and publications.
Methodology
Step 1 - Identification of Relevant Samples Size from Population Database


Step 2 - Approaches for Defining Global Market Size (Value, Volume* & Price*)

Note*: In applicable scenarios
Step 3 - Data Sources
Primary Research
- Web Analytics
- Survey Reports
- Research Institute
- Latest Research Reports
- Opinion Leaders
Secondary Research
- Annual Reports
- White Paper
- Latest Press Release
- Industry Association
- Paid Database
- Investor Presentations

Step 4 - Data Triangulation
Involves using different sources of information in order to increase the validity of a study
These sources are likely to be stakeholders in a program - participants, other researchers, program staff, other community members, and so on.
Then we put all data in single framework & apply various statistical tools to find out the dynamic on the market.
During the analysis stage, feedback from the stakeholder groups would be compared to determine areas of agreement as well as areas of divergence