

Key Insights
The Capesize bulk carrier market, a pivotal sector within global shipping, is poised for significant expansion between 2025 and 2033. The market size was valued at approximately $12 billion in the base year 2025. A projected compound annual growth rate (CAGR) of 6.1% is anticipated, driven by escalating global demand for essential raw materials such as iron ore and coal. This surge necessitates larger, more efficient Capesize vessels. Advancements in shipbuilding technology, including enhanced fuel efficiency and automation, are further stimulating market growth. Key market constraints include volatile freight rates influenced by geopolitical factors, stringent environmental regulations promoting decarbonization, and potential vessel oversupply during economic downturns. Market segmentation encompasses variations in Capesize vessel dimensions and specialized carriers for distinct commodities. Leading industry participants, including Hyundai Heavy Industries and Mitsui Engineering & Shipbuilding, are strategically positioned to leverage these trends through innovation and fleet expansion.
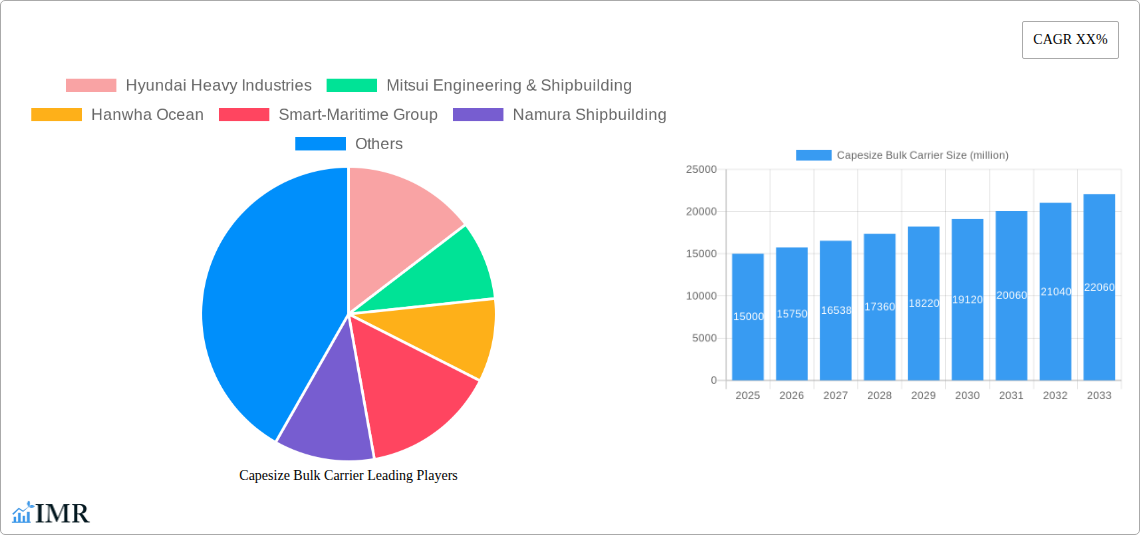
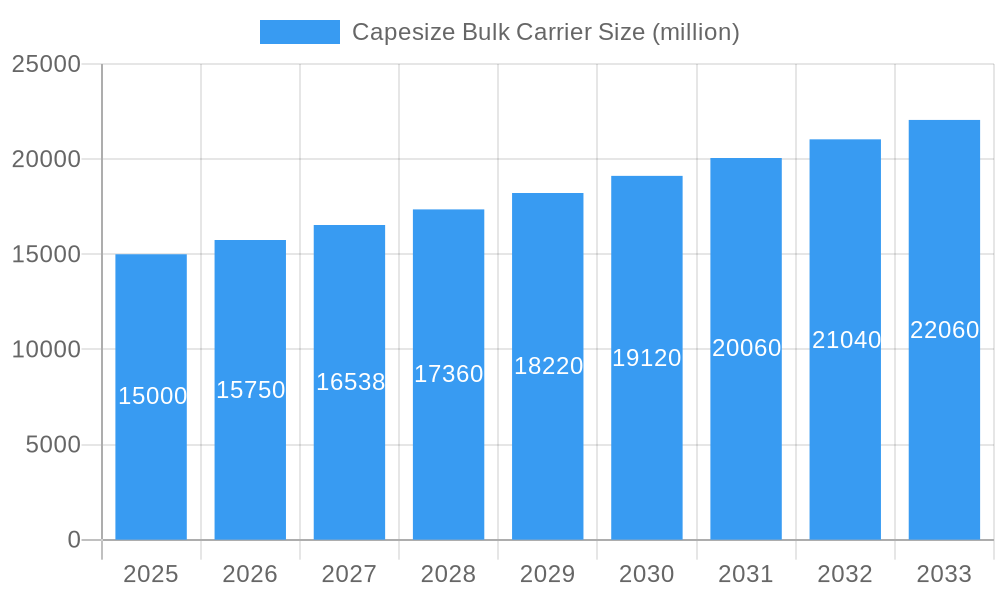
Capesize Bulk Carrier Market Size (In Billion)
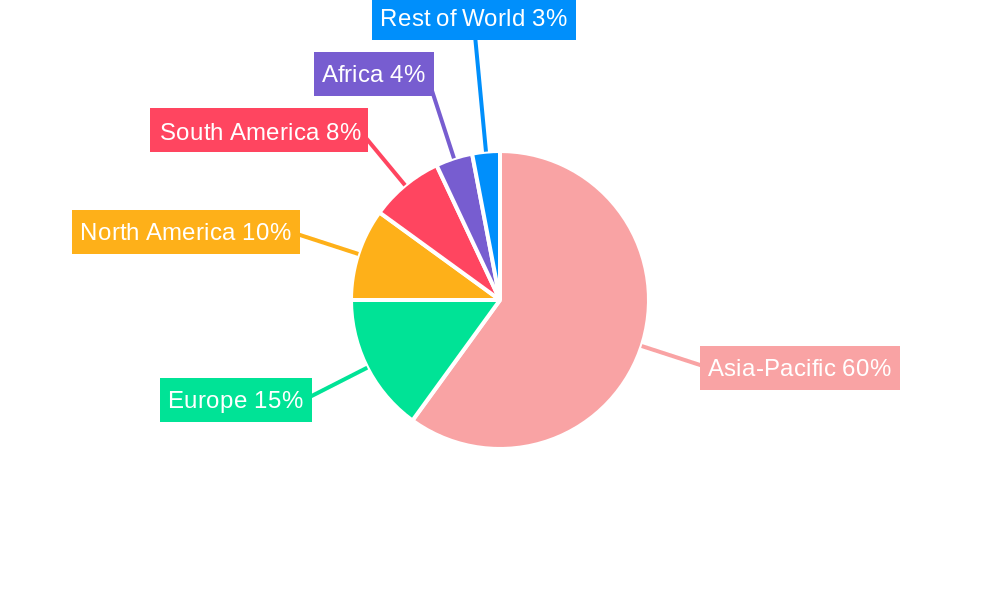
The competitive environment is characterized by intense rivalry among established companies for market share. Strategic collaborations, mergers, and acquisitions are expected to reshape market dynamics. Regional demand patterns and infrastructure development will significantly influence growth trajectories. The Asia-Pacific region is projected to lead market expansion due to its substantial raw material consumption and robust shipbuilding capabilities. However, emerging growth prospects are present in other regions, particularly those undergoing infrastructure development to enhance bulk cargo handling capacity. The forecast period will likely emphasize sustainability and operational efficiency, driving innovation in vessel design and operations to comply with evolving environmental standards and mitigate cost pressures. Strategic navigation of these challenges and effective capitalization on emerging opportunities will be paramount for sustained market success.
Capesize Bulk Carrier Company Market Share
Capesize Bulk Carrier Market Report: 2019-2033 Forecast
This comprehensive report provides an in-depth analysis of the Capesize Bulk Carrier market, encompassing historical data (2019-2024), the base year (2025), and a detailed forecast spanning 2025-2033. The report examines market dynamics, growth trends, key players, and emerging opportunities within the broader Dry Bulk Shipping and Maritime industries. This research is invaluable for industry professionals, investors, and strategic decision-makers seeking a complete understanding of this vital sector.
Capesize Bulk Carrier Market Dynamics & Structure
This section analyzes the Capesize Bulk Carrier market's competitive landscape, technological advancements, regulatory influences, and market trends. The study period (2019-2033) reveals significant shifts in market concentration, with a focus on mergers and acquisitions (M&A) activity and the impact of technological innovations on market structure.
- Market Concentration: The market is moderately concentrated, with the top five players holding approximately xx% of the market share in 2025. This is expected to slightly decrease to xx% by 2033 due to increased competition from emerging players.
- Technological Innovation: Adoption of digital technologies like AI-powered route optimization and predictive maintenance is increasing efficiency and reducing operational costs. However, high initial investment costs present a barrier to entry for smaller players.
- Regulatory Framework: International Maritime Organization (IMO) regulations, particularly concerning emission standards (e.g., IMO 2020), significantly influence ship design and operational practices, impacting market dynamics. Compliance costs are a key factor impacting profitability.
- Competitive Product Substitutes: While direct substitutes are limited, pressure exists from alternative transportation methods like pipelines for specific commodities.
- End-User Demographics: Major end-users are mining companies, steel producers, and agricultural commodity traders, with their demand influencing market cycles significantly. The geographical distribution of these end-users impacts regional market variations.
- M&A Trends: The period 2019-2024 witnessed xx M&A deals in the Capesize Bulk Carrier sector, valued at approximately $xx billion. This activity is anticipated to continue, driven by economies of scale and market consolidation efforts.
Capesize Bulk Carrier Growth Trends & Insights
Analyzing data from 2019 to 2033, this report details the Capesize Bulk Carrier market's evolution. The market demonstrates a cyclical nature influenced by global economic growth, commodity prices, and geopolitical factors. This analysis utilizes various statistical modeling techniques to arrive at robust growth projections.
The market exhibited a CAGR of xx% during the historical period (2019-2024). This growth is projected to moderate to a CAGR of xx% during the forecast period (2025-2033), reaching a market size of $xx billion by 2033. The adoption rate of technologically advanced vessels is a key factor impacting this growth trajectory. Shifts in consumer behavior, driven by increasing environmental concerns and demand for sustainable shipping practices, also play a significant role.
Dominant Regions, Countries, or Segments in Capesize Bulk Carrier
This section identifies the key regions driving market growth, considering factors like economic activity, infrastructure development, and regulatory environments.
- China: China's robust infrastructure development and significant demand for iron ore and coal make it a dominant market. Government policies supporting infrastructure projects continue to fuel demand.
- Australia: As a major exporter of iron ore, Australia is a crucial market for Capesize Bulk Carriers. Mining activity and export volumes significantly influence the market's performance in this region.
- Brazil: Similar to Australia, Brazil's significant commodity exports, particularly iron ore, contribute to its importance in the Capesize Bulk Carrier market.
The Asia-Pacific region is projected to maintain its dominance throughout the forecast period, driven by continued economic expansion and infrastructure investments.
Capesize Bulk Carrier Product Landscape
The Capesize Bulk Carrier market features vessels with varying capacities and technological advancements. Recent innovations focus on fuel efficiency, emission reduction, and improved cargo handling capabilities. The adoption of scrubber technology to meet IMO 2020 regulations is noteworthy. Key performance indicators (KPIs) include cargo capacity, fuel consumption per ton-mile, and operational efficiency metrics. These advancements are enhancing vessel performance and creating unique selling propositions in a competitive landscape.
Key Drivers, Barriers & Challenges in Capesize Bulk Carrier
Key Drivers:
- Strong global demand for raw materials, particularly iron ore and coal.
- Increasing investments in infrastructure projects globally.
- Technological advancements leading to increased efficiency and reduced operational costs.
Key Barriers and Challenges:
- Fluctuations in commodity prices impact freight rates and profitability.
- Stringent environmental regulations increase compliance costs.
- Geopolitical uncertainties and trade disputes affect shipping routes and demand.
- Supply chain disruptions, particularly regarding the availability of skilled labor and shipbuilding capacity, can impact vessel delivery timelines and overall market growth. These disruptions caused an estimated xx% reduction in new vessel deliveries in 2024.
Emerging Opportunities in Capesize Bulk Carrier
- Growth in emerging economies: Expanding infrastructure development in regions like Africa and South America presents significant growth potential.
- Demand for eco-friendly vessels: The increasing focus on sustainable shipping solutions creates opportunities for vessels with advanced emission reduction technologies.
- Digitalization and automation: Implementing advanced technologies, such as autonomous navigation systems, can enhance efficiency and reduce operational costs.
Growth Accelerators in the Capesize Bulk Carrier Industry
Technological advancements in vessel design, propulsion systems, and cargo handling are driving long-term growth. Strategic partnerships between shipbuilders, shipping companies, and technology providers are also accelerating market expansion. Governments’ investments in port infrastructure and initiatives promoting sustainable shipping practices further support growth.
Key Players Shaping the Capesize Bulk Carrier Market
- Hyundai Heavy Industries
- Mitsui Engineering & Shipbuilding
- Hanwha Ocean
- Smart-Maritime Group
- Namura Shipbuilding
- Imabari Shipbuilding
- Shanghai Waigaoqiao Shipbuilding
- DSIC Marine
- Jiangnan Shipyard (CSSC)
- Japan Marine United
Notable Milestones in Capesize Bulk Carrier Sector
- 2020: Implementation of IMO 2020 sulfur regulations significantly impacted vessel design and operations.
- 2021: Increased focus on ESG (Environmental, Social, and Governance) factors influenced investment decisions and vessel specifications.
- 2022: Several major mergers and acquisitions reshaped the market landscape.
- 2023: Significant investments in digital technologies for vessel optimization and improved operational efficiency.
In-Depth Capesize Bulk Carrier Market Outlook
The Capesize Bulk Carrier market is poised for continued growth, driven by increasing global demand for raw materials and ongoing technological advancements. Strategic investments in sustainable shipping practices, coupled with smart automation and digitalization, will shape the sector's future. Opportunities exist for companies that can adapt to evolving regulatory landscapes and meet the demand for environmentally friendly solutions. The market's cyclical nature should be considered when developing long-term strategies, with careful attention to commodity price fluctuations and geopolitical risks.
Capesize Bulk Carrier Segmentation
-
1. Type
- 1.1. Deadweight Less Than 170,000 Tons
- 1.2. Deadweight Higher Than 170,000 Tons Lower Than 200,000 Tons
- 1.3. Deadweight Higher Than 200,000 Tons
-
2. Application
- 2.1. Coal
- 2.2. Ore
- 2.3. Grain
- 2.4. Others
Capesize Bulk Carrier Segmentation By Geography
-
1. North America
- 1.1. United States
- 1.2. Canada
- 1.3. Mexico
-
2. South America
- 2.1. Brazil
- 2.2. Argentina
- 2.3. Rest of South America
-
3. Europe
- 3.1. United Kingdom
- 3.2. Germany
- 3.3. France
- 3.4. Italy
- 3.5. Spain
- 3.6. Russia
- 3.7. Benelux
- 3.8. Nordics
- 3.9. Rest of Europe
-
4. Middle East & Africa
- 4.1. Turkey
- 4.2. Israel
- 4.3. GCC
- 4.4. North Africa
- 4.5. South Africa
- 4.6. Rest of Middle East & Africa
-
5. Asia Pacific
- 5.1. China
- 5.2. India
- 5.3. Japan
- 5.4. South Korea
- 5.5. ASEAN
- 5.6. Oceania
- 5.7. Rest of Asia Pacific
Capesize Bulk Carrier Regional Market Share
Geographic Coverage of Capesize Bulk Carrier
Capesize Bulk Carrier REPORT HIGHLIGHTS
| Aspects | Details |
|---|---|
| Study Period | 2020-2034 |
| Base Year | 2025 |
| Estimated Year | 2026 |
| Forecast Period | 2026-2034 |
| Historical Period | 2020-2025 |
| Growth Rate | CAGR of 6.1% from 2020-2034 |
| Segmentation |
|
Table of Contents
- 1. Introduction
- 1.1. Research Scope
- 1.2. Market Segmentation
- 1.3. Research Objective
- 1.4. Definitions and Assumptions
- 2. Executive Summary
- 2.1. Market Snapshot
- 3. Market Dynamics
- 3.1. Market Drivers
- 3.2. Market Restrains
- 3.3. Market Trends
- 3.4. Market Opportunities
- 4. Market Factor Analysis
- 4.1. Porters Five Forces
- 4.1.1. Bargaining Power of Suppliers
- 4.1.2. Bargaining Power of Buyers
- 4.1.3. Threat of New Entrants
- 4.1.4. Threat of Substitutes
- 4.1.5. Competitive Rivalry
- 4.2. PESTEL analysis
- 4.3. BCG Analysis
- 4.3.1. Stars (High Growth, High Market Share)
- 4.3.2. Cash Cows (Low Growth, High Market Share)
- 4.3.3. Question Mark (High Growth, Low Market Share)
- 4.3.4. Dogs (Low Growth, Low Market Share)
- 4.4. Ansoff Matrix Analysis
- 4.5. Supply Chain Analysis
- 4.6. Regulatory Landscape
- 4.7. Current Market Potential and Opportunity Assessment (TAM–SAM–SOM Framework)
- 4.8. IMR Analyst Note
- 4.1. Porters Five Forces
- 5. Market Analysis, Insights and Forecast 2021-2033
- 5.1. Market Analysis, Insights and Forecast - by Type
- 5.1.1. Deadweight Less Than 170,000 Tons
- 5.1.2. Deadweight Higher Than 170,000 Tons Lower Than 200,000 Tons
- 5.1.3. Deadweight Higher Than 200,000 Tons
- 5.2. Market Analysis, Insights and Forecast - by Application
- 5.2.1. Coal
- 5.2.2. Ore
- 5.2.3. Grain
- 5.2.4. Others
- 5.3. Market Analysis, Insights and Forecast - by Region
- 5.3.1. North America
- 5.3.2. South America
- 5.3.3. Europe
- 5.3.4. Middle East & Africa
- 5.3.5. Asia Pacific
- 5.1. Market Analysis, Insights and Forecast - by Type
- 6. Global Capesize Bulk Carrier Analysis, Insights and Forecast, 2021-2033
- 6.1. Market Analysis, Insights and Forecast - by Type
- 6.1.1. Deadweight Less Than 170,000 Tons
- 6.1.2. Deadweight Higher Than 170,000 Tons Lower Than 200,000 Tons
- 6.1.3. Deadweight Higher Than 200,000 Tons
- 6.2. Market Analysis, Insights and Forecast - by Application
- 6.2.1. Coal
- 6.2.2. Ore
- 6.2.3. Grain
- 6.2.4. Others
- 6.1. Market Analysis, Insights and Forecast - by Type
- 7. North America Capesize Bulk Carrier Analysis, Insights and Forecast, 2020-2032
- 7.1. Market Analysis, Insights and Forecast - by Type
- 7.1.1. Deadweight Less Than 170,000 Tons
- 7.1.2. Deadweight Higher Than 170,000 Tons Lower Than 200,000 Tons
- 7.1.3. Deadweight Higher Than 200,000 Tons
- 7.2. Market Analysis, Insights and Forecast - by Application
- 7.2.1. Coal
- 7.2.2. Ore
- 7.2.3. Grain
- 7.2.4. Others
- 7.1. Market Analysis, Insights and Forecast - by Type
- 8. South America Capesize Bulk Carrier Analysis, Insights and Forecast, 2020-2032
- 8.1. Market Analysis, Insights and Forecast - by Type
- 8.1.1. Deadweight Less Than 170,000 Tons
- 8.1.2. Deadweight Higher Than 170,000 Tons Lower Than 200,000 Tons
- 8.1.3. Deadweight Higher Than 200,000 Tons
- 8.2. Market Analysis, Insights and Forecast - by Application
- 8.2.1. Coal
- 8.2.2. Ore
- 8.2.3. Grain
- 8.2.4. Others
- 8.1. Market Analysis, Insights and Forecast - by Type
- 9. Europe Capesize Bulk Carrier Analysis, Insights and Forecast, 2020-2032
- 9.1. Market Analysis, Insights and Forecast - by Type
- 9.1.1. Deadweight Less Than 170,000 Tons
- 9.1.2. Deadweight Higher Than 170,000 Tons Lower Than 200,000 Tons
- 9.1.3. Deadweight Higher Than 200,000 Tons
- 9.2. Market Analysis, Insights and Forecast - by Application
- 9.2.1. Coal
- 9.2.2. Ore
- 9.2.3. Grain
- 9.2.4. Others
- 9.1. Market Analysis, Insights and Forecast - by Type
- 10. Middle East & Africa Capesize Bulk Carrier Analysis, Insights and Forecast, 2020-2032
- 10.1. Market Analysis, Insights and Forecast - by Type
- 10.1.1. Deadweight Less Than 170,000 Tons
- 10.1.2. Deadweight Higher Than 170,000 Tons Lower Than 200,000 Tons
- 10.1.3. Deadweight Higher Than 200,000 Tons
- 10.2. Market Analysis, Insights and Forecast - by Application
- 10.2.1. Coal
- 10.2.2. Ore
- 10.2.3. Grain
- 10.2.4. Others
- 10.1. Market Analysis, Insights and Forecast - by Type
- 11. Asia Pacific Capesize Bulk Carrier Analysis, Insights and Forecast, 2020-2032
- 11.1. Market Analysis, Insights and Forecast - by Type
- 11.1.1. Deadweight Less Than 170,000 Tons
- 11.1.2. Deadweight Higher Than 170,000 Tons Lower Than 200,000 Tons
- 11.1.3. Deadweight Higher Than 200,000 Tons
- 11.2. Market Analysis, Insights and Forecast - by Application
- 11.2.1. Coal
- 11.2.2. Ore
- 11.2.3. Grain
- 11.2.4. Others
- 11.1. Market Analysis, Insights and Forecast - by Type
- 12. Competitive Analysis
- 12.1. Company Profiles
- 12.1.1 Hyundai Heavy Industries
- 12.1.1.1. Company Overview
- 12.1.1.2. Products
- 12.1.1.3. Company Financials
- 12.1.1.4. SWOT Analysis
- 12.1.2 Mitsui Engineering & Shipbuilding
- 12.1.2.1. Company Overview
- 12.1.2.2. Products
- 12.1.2.3. Company Financials
- 12.1.2.4. SWOT Analysis
- 12.1.3 Hanwha Ocean
- 12.1.3.1. Company Overview
- 12.1.3.2. Products
- 12.1.3.3. Company Financials
- 12.1.3.4. SWOT Analysis
- 12.1.4 Smart-Maritime Group
- 12.1.4.1. Company Overview
- 12.1.4.2. Products
- 12.1.4.3. Company Financials
- 12.1.4.4. SWOT Analysis
- 12.1.5 Namura Shipbuilding
- 12.1.5.1. Company Overview
- 12.1.5.2. Products
- 12.1.5.3. Company Financials
- 12.1.5.4. SWOT Analysis
- 12.1.6 Imabari Shipbuilding
- 12.1.6.1. Company Overview
- 12.1.6.2. Products
- 12.1.6.3. Company Financials
- 12.1.6.4. SWOT Analysis
- 12.1.7 Shanghai Waigaoqiao Shipbuilding
- 12.1.7.1. Company Overview
- 12.1.7.2. Products
- 12.1.7.3. Company Financials
- 12.1.7.4. SWOT Analysis
- 12.1.8 DSIC Marine
- 12.1.8.1. Company Overview
- 12.1.8.2. Products
- 12.1.8.3. Company Financials
- 12.1.8.4. SWOT Analysis
- 12.1.9 Jiangnan Shipyard (CSSC)
- 12.1.9.1. Company Overview
- 12.1.9.2. Products
- 12.1.9.3. Company Financials
- 12.1.9.4. SWOT Analysis
- 12.1.10 Japan Marine United
- 12.1.10.1. Company Overview
- 12.1.10.2. Products
- 12.1.10.3. Company Financials
- 12.1.10.4. SWOT Analysis
- 12.1.1 Hyundai Heavy Industries
- 12.2. Market Entropy
- 12.2.1 Company's Key Areas Served
- 12.2.2 Recent Developments
- 12.3. Company Market Share Analysis 2025
- 12.3.1 Top 5 Companies Market Share Analysis
- 12.3.2 Top 3 Companies Market Share Analysis
- 12.4. List of Potential Customers
- 13. Research Methodology
List of Figures
- Figure 1: Global Capesize Bulk Carrier Revenue Breakdown (billion, %) by Region 2025 & 2033
- Figure 2: North America Capesize Bulk Carrier Revenue (billion), by Type 2025 & 2033
- Figure 3: North America Capesize Bulk Carrier Revenue Share (%), by Type 2025 & 2033
- Figure 4: North America Capesize Bulk Carrier Revenue (billion), by Application 2025 & 2033
- Figure 5: North America Capesize Bulk Carrier Revenue Share (%), by Application 2025 & 2033
- Figure 6: North America Capesize Bulk Carrier Revenue (billion), by Country 2025 & 2033
- Figure 7: North America Capesize Bulk Carrier Revenue Share (%), by Country 2025 & 2033
- Figure 8: South America Capesize Bulk Carrier Revenue (billion), by Type 2025 & 2033
- Figure 9: South America Capesize Bulk Carrier Revenue Share (%), by Type 2025 & 2033
- Figure 10: South America Capesize Bulk Carrier Revenue (billion), by Application 2025 & 2033
- Figure 11: South America Capesize Bulk Carrier Revenue Share (%), by Application 2025 & 2033
- Figure 12: South America Capesize Bulk Carrier Revenue (billion), by Country 2025 & 2033
- Figure 13: South America Capesize Bulk Carrier Revenue Share (%), by Country 2025 & 2033
- Figure 14: Europe Capesize Bulk Carrier Revenue (billion), by Type 2025 & 2033
- Figure 15: Europe Capesize Bulk Carrier Revenue Share (%), by Type 2025 & 2033
- Figure 16: Europe Capesize Bulk Carrier Revenue (billion), by Application 2025 & 2033
- Figure 17: Europe Capesize Bulk Carrier Revenue Share (%), by Application 2025 & 2033
- Figure 18: Europe Capesize Bulk Carrier Revenue (billion), by Country 2025 & 2033
- Figure 19: Europe Capesize Bulk Carrier Revenue Share (%), by Country 2025 & 2033
- Figure 20: Middle East & Africa Capesize Bulk Carrier Revenue (billion), by Type 2025 & 2033
- Figure 21: Middle East & Africa Capesize Bulk Carrier Revenue Share (%), by Type 2025 & 2033
- Figure 22: Middle East & Africa Capesize Bulk Carrier Revenue (billion), by Application 2025 & 2033
- Figure 23: Middle East & Africa Capesize Bulk Carrier Revenue Share (%), by Application 2025 & 2033
- Figure 24: Middle East & Africa Capesize Bulk Carrier Revenue (billion), by Country 2025 & 2033
- Figure 25: Middle East & Africa Capesize Bulk Carrier Revenue Share (%), by Country 2025 & 2033
- Figure 26: Asia Pacific Capesize Bulk Carrier Revenue (billion), by Type 2025 & 2033
- Figure 27: Asia Pacific Capesize Bulk Carrier Revenue Share (%), by Type 2025 & 2033
- Figure 28: Asia Pacific Capesize Bulk Carrier Revenue (billion), by Application 2025 & 2033
- Figure 29: Asia Pacific Capesize Bulk Carrier Revenue Share (%), by Application 2025 & 2033
- Figure 30: Asia Pacific Capesize Bulk Carrier Revenue (billion), by Country 2025 & 2033
- Figure 31: Asia Pacific Capesize Bulk Carrier Revenue Share (%), by Country 2025 & 2033
List of Tables
- Table 1: Global Capesize Bulk Carrier Revenue billion Forecast, by Type 2020 & 2033
- Table 2: Global Capesize Bulk Carrier Revenue billion Forecast, by Application 2020 & 2033
- Table 3: Global Capesize Bulk Carrier Revenue billion Forecast, by Region 2020 & 2033
- Table 4: Global Capesize Bulk Carrier Revenue billion Forecast, by Type 2020 & 2033
- Table 5: Global Capesize Bulk Carrier Revenue billion Forecast, by Application 2020 & 2033
- Table 6: Global Capesize Bulk Carrier Revenue billion Forecast, by Country 2020 & 2033
- Table 7: United States Capesize Bulk Carrier Revenue (billion) Forecast, by Application 2020 & 2033
- Table 8: Canada Capesize Bulk Carrier Revenue (billion) Forecast, by Application 2020 & 2033
- Table 9: Mexico Capesize Bulk Carrier Revenue (billion) Forecast, by Application 2020 & 2033
- Table 10: Global Capesize Bulk Carrier Revenue billion Forecast, by Type 2020 & 2033
- Table 11: Global Capesize Bulk Carrier Revenue billion Forecast, by Application 2020 & 2033
- Table 12: Global Capesize Bulk Carrier Revenue billion Forecast, by Country 2020 & 2033
- Table 13: Brazil Capesize Bulk Carrier Revenue (billion) Forecast, by Application 2020 & 2033
- Table 14: Argentina Capesize Bulk Carrier Revenue (billion) Forecast, by Application 2020 & 2033
- Table 15: Rest of South America Capesize Bulk Carrier Revenue (billion) Forecast, by Application 2020 & 2033
- Table 16: Global Capesize Bulk Carrier Revenue billion Forecast, by Type 2020 & 2033
- Table 17: Global Capesize Bulk Carrier Revenue billion Forecast, by Application 2020 & 2033
- Table 18: Global Capesize Bulk Carrier Revenue billion Forecast, by Country 2020 & 2033
- Table 19: United Kingdom Capesize Bulk Carrier Revenue (billion) Forecast, by Application 2020 & 2033
- Table 20: Germany Capesize Bulk Carrier Revenue (billion) Forecast, by Application 2020 & 2033
- Table 21: France Capesize Bulk Carrier Revenue (billion) Forecast, by Application 2020 & 2033
- Table 22: Italy Capesize Bulk Carrier Revenue (billion) Forecast, by Application 2020 & 2033
- Table 23: Spain Capesize Bulk Carrier Revenue (billion) Forecast, by Application 2020 & 2033
- Table 24: Russia Capesize Bulk Carrier Revenue (billion) Forecast, by Application 2020 & 2033
- Table 25: Benelux Capesize Bulk Carrier Revenue (billion) Forecast, by Application 2020 & 2033
- Table 26: Nordics Capesize Bulk Carrier Revenue (billion) Forecast, by Application 2020 & 2033
- Table 27: Rest of Europe Capesize Bulk Carrier Revenue (billion) Forecast, by Application 2020 & 2033
- Table 28: Global Capesize Bulk Carrier Revenue billion Forecast, by Type 2020 & 2033
- Table 29: Global Capesize Bulk Carrier Revenue billion Forecast, by Application 2020 & 2033
- Table 30: Global Capesize Bulk Carrier Revenue billion Forecast, by Country 2020 & 2033
- Table 31: Turkey Capesize Bulk Carrier Revenue (billion) Forecast, by Application 2020 & 2033
- Table 32: Israel Capesize Bulk Carrier Revenue (billion) Forecast, by Application 2020 & 2033
- Table 33: GCC Capesize Bulk Carrier Revenue (billion) Forecast, by Application 2020 & 2033
- Table 34: North Africa Capesize Bulk Carrier Revenue (billion) Forecast, by Application 2020 & 2033
- Table 35: South Africa Capesize Bulk Carrier Revenue (billion) Forecast, by Application 2020 & 2033
- Table 36: Rest of Middle East & Africa Capesize Bulk Carrier Revenue (billion) Forecast, by Application 2020 & 2033
- Table 37: Global Capesize Bulk Carrier Revenue billion Forecast, by Type 2020 & 2033
- Table 38: Global Capesize Bulk Carrier Revenue billion Forecast, by Application 2020 & 2033
- Table 39: Global Capesize Bulk Carrier Revenue billion Forecast, by Country 2020 & 2033
- Table 40: China Capesize Bulk Carrier Revenue (billion) Forecast, by Application 2020 & 2033
- Table 41: India Capesize Bulk Carrier Revenue (billion) Forecast, by Application 2020 & 2033
- Table 42: Japan Capesize Bulk Carrier Revenue (billion) Forecast, by Application 2020 & 2033
- Table 43: South Korea Capesize Bulk Carrier Revenue (billion) Forecast, by Application 2020 & 2033
- Table 44: ASEAN Capesize Bulk Carrier Revenue (billion) Forecast, by Application 2020 & 2033
- Table 45: Oceania Capesize Bulk Carrier Revenue (billion) Forecast, by Application 2020 & 2033
- Table 46: Rest of Asia Pacific Capesize Bulk Carrier Revenue (billion) Forecast, by Application 2020 & 2033
Frequently Asked Questions
1. What is the projected Compound Annual Growth Rate (CAGR) of the Capesize Bulk Carrier?
The projected CAGR is approximately 6.1%.
2. Which companies are prominent players in the Capesize Bulk Carrier?
Key companies in the market include Hyundai Heavy Industries, Mitsui Engineering & Shipbuilding, Hanwha Ocean, Smart-Maritime Group, Namura Shipbuilding, Imabari Shipbuilding, Shanghai Waigaoqiao Shipbuilding, DSIC Marine, Jiangnan Shipyard (CSSC), Japan Marine United.
3. What are the main segments of the Capesize Bulk Carrier?
The market segments include Type, Application.
4. Can you provide details about the market size?
The market size is estimated to be USD 12 billion as of 2022.
5. What are some drivers contributing to market growth?
N/A
6. What are the notable trends driving market growth?
N/A
7. Are there any restraints impacting market growth?
N/A
8. Can you provide examples of recent developments in the market?
N/A
9. What pricing options are available for accessing the report?
Pricing options include single-user, multi-user, and enterprise licenses priced at USD 2900.00, USD 4350.00, and USD 5800.00 respectively.
10. Is the market size provided in terms of value or volume?
The market size is provided in terms of value, measured in billion.
11. Are there any specific market keywords associated with the report?
Yes, the market keyword associated with the report is "Capesize Bulk Carrier," which aids in identifying and referencing the specific market segment covered.
12. How do I determine which pricing option suits my needs best?
The pricing options vary based on user requirements and access needs. Individual users may opt for single-user licenses, while businesses requiring broader access may choose multi-user or enterprise licenses for cost-effective access to the report.
13. Are there any additional resources or data provided in the Capesize Bulk Carrier report?
While the report offers comprehensive insights, it's advisable to review the specific contents or supplementary materials provided to ascertain if additional resources or data are available.
14. How can I stay updated on further developments or reports in the Capesize Bulk Carrier?
To stay informed about further developments, trends, and reports in the Capesize Bulk Carrier, consider subscribing to industry newsletters, following relevant companies and organizations, or regularly checking reputable industry news sources and publications.
Methodology
Step 1 - Identification of Relevant Samples Size from Population Database


Step 2 - Approaches for Defining Global Market Size (Value, Volume* & Price*)

Note*: In applicable scenarios
Step 3 - Data Sources
Primary Research
- Web Analytics
- Survey Reports
- Research Institute
- Latest Research Reports
- Opinion Leaders
Secondary Research
- Annual Reports
- White Paper
- Latest Press Release
- Industry Association
- Paid Database
- Investor Presentations

Step 4 - Data Triangulation
Involves using different sources of information in order to increase the validity of a study
These sources are likely to be stakeholders in a program - participants, other researchers, program staff, other community members, and so on.
Then we put all data in single framework & apply various statistical tools to find out the dynamic on the market.
During the analysis stage, feedback from the stakeholder groups would be compared to determine areas of agreement as well as areas of divergence