

Key Insights
The global CNG Commercial Vehicles market is poised for significant expansion, driven by a confluence of environmental imperatives and economic advantages. Valued at 46110 million in 2025, the market is projected to grow at a robust CAGR of 4.4% from 2025 to 2033. This growth is primarily fueled by stringent global emission regulations compelling fleet operators to adopt greener alternatives, coupled with the rising costs of conventional diesel and gasoline. CNG vehicles offer a compelling proposition for reducing operational expenses through lower fuel costs and potentially reduced maintenance. Furthermore, government incentives and subsidies in various regions actively encourage the shift towards natural gas vehicles, accelerating their adoption in urban logistics, public transportation (buses and coaches), and heavy-duty trucking segments. Key market drivers also include the increasing demand for sustainable transport solutions and the expanding network of natural gas refueling infrastructure, particularly in developing economies.
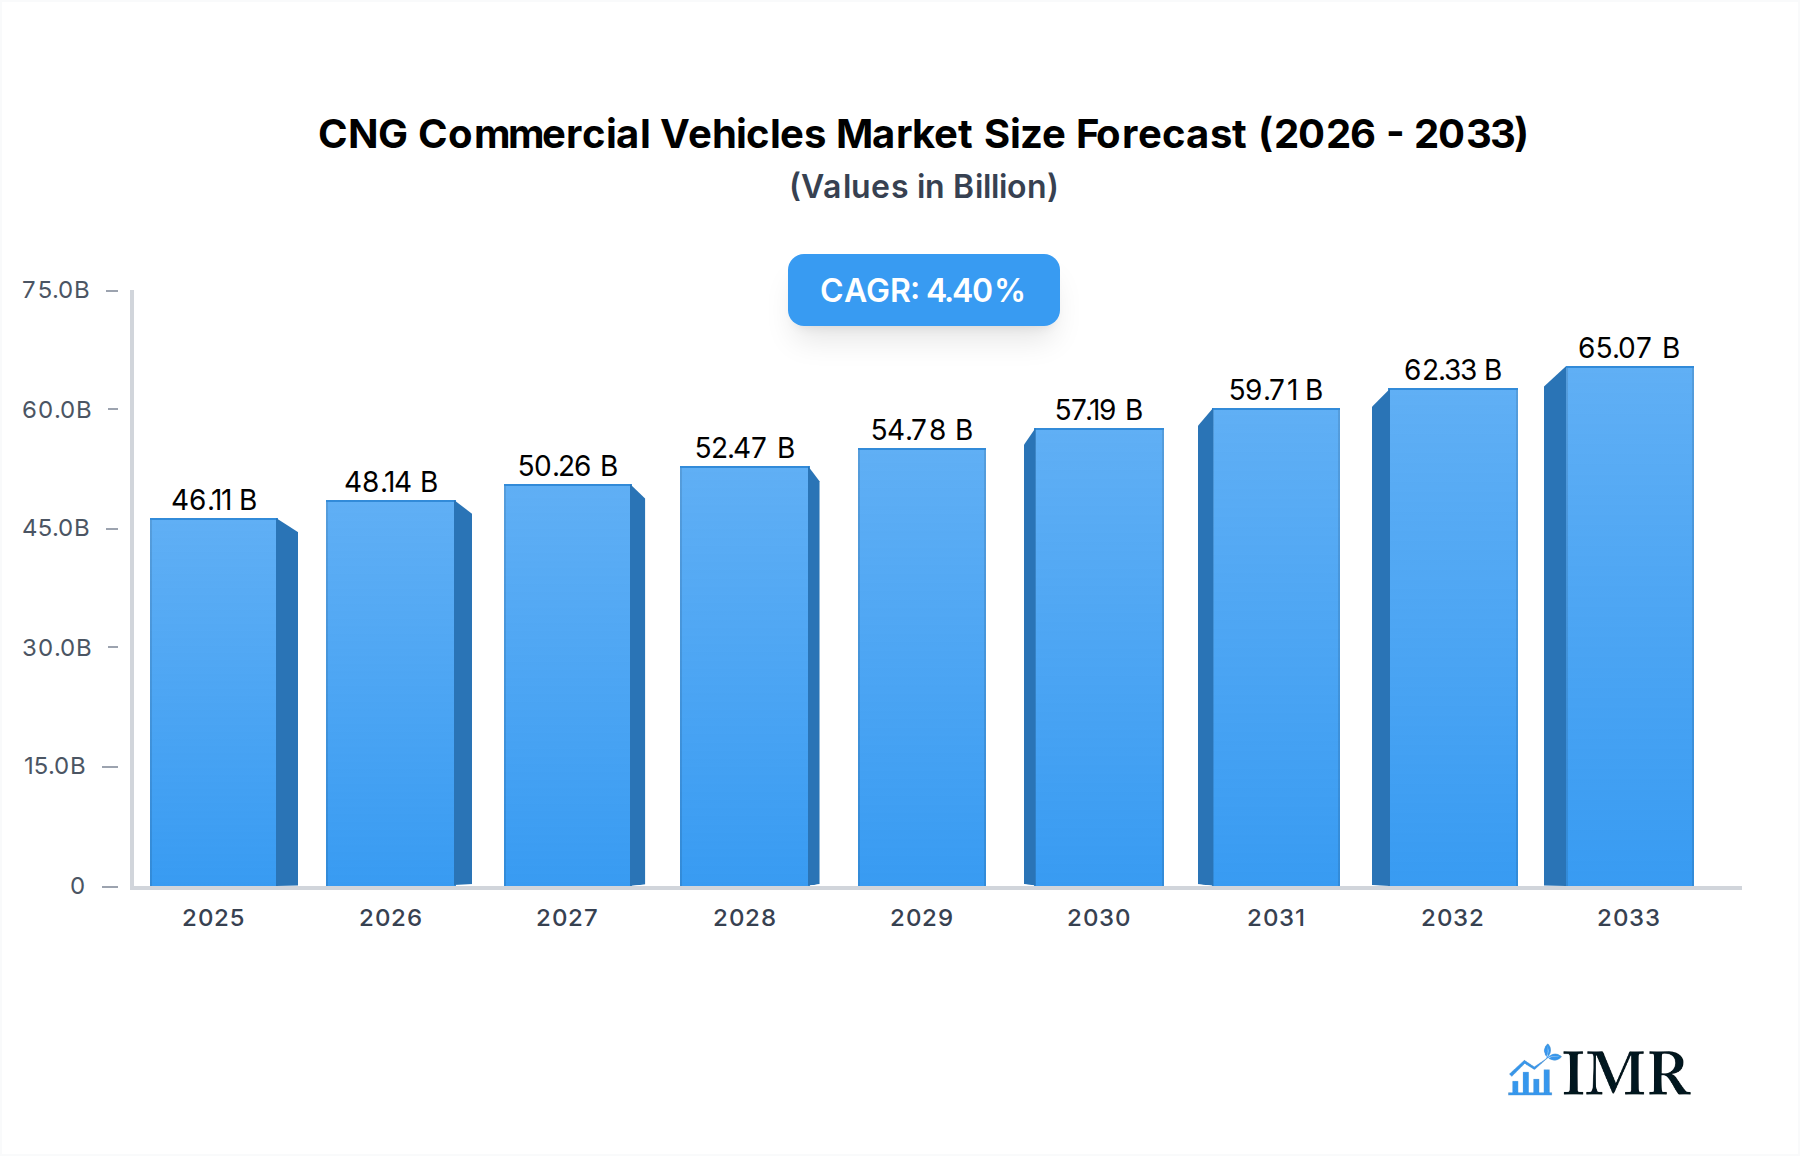
CNG Commercial Vehicles Market Size (In Billion)
Market trends indicate a continuous evolution in CNG vehicle technology, leading to improved engine efficiency, extended range, and enhanced performance, making them increasingly competitive with traditional fuel vehicles. The focus on fleet decarbonization and the circular economy further bolsters the appeal of CNG options. While challenges such as initial vehicle acquisition costs and the perception of limited refueling points persist, ongoing advancements in fuel storage and distribution technologies are mitigating these restraints. Asia Pacific, spearheaded by countries like China and India, is expected to remain a dominant force due to massive industrial growth and urgent need for pollution control, while Europe and North America will also witness steady growth driven by strong environmental policies and well-established automotive ecosystems, shaping a greener future for commercial transportation worldwide.

CNG Commercial Vehicles Company Market Share
This comprehensive report provides an unparalleled deep dive into the CNG Commercial Vehicles Market, a critical segment of the broader Sustainable Transportation and Commercial Fleet Decarbonization industries. From 2019 to 2033, we analyze the dynamic shifts, technological innovations, and strategic imperatives driving the adoption of natural gas trucks and buses globally. This study leverages a robust historical period (2019–2024), grounds its findings in a base and estimated year of 2025, and forecasts critical trends through 2033, offering stakeholders invaluable insights to navigate this high-growth sector. All market values are presented in million units, ensuring clear, scalable understanding of the market's financial landscape.
CNG Commercial Vehicles Market Dynamics & Structure
The CNG Commercial Vehicles market operates within a rapidly evolving ecosystem, characterized by intensifying competition and a strategic push towards lower emissions. Market concentration, while present among established global OEMs, is seeing a shift as regional players gain traction. The top five global manufacturers, including Volvo Group, Daimler AG, and PACCAR, collectively hold an estimated xx% of the market share, dominating the premium and heavy-duty segments. However, companies like Dongfeng Motor, Sinotruk, and Tata Motors are significant players in high-growth emerging markets, challenging traditional leadership. Technological innovation is a primary driver, with advancements in engine efficiency, fuel storage, and telemetry systems continually enhancing the appeal of CNG vehicles. Investments in R&D for more efficient fuel injection systems and lightweight composite CNG tanks are projected to reach over $150 million annually by 2025.
Regulatory frameworks, particularly stringent emission norms such as Euro VI and equivalent standards in other regions, are pivotal in accelerating market adoption, mandating fleet operators to consider cleaner alternatives. Conversely, a lack of consistent global policies or sudden changes can create innovation barriers and uncertainty. Competitive product substitutes, predominantly electric commercial vehicles and hydrogen fuel cell vehicles, pose a long-term challenge, but CNG maintains a compelling Total Cost of Ownership (TCO) advantage, especially for high-mileage routes and regions with developed natural gas infrastructure. End-user demographics are shifting, with a growing number of logistics companies, public transport authorities, and municipal fleets prioritizing sustainability and operational cost savings. M&A trends reflect this strategic reorientation, with recent deals valued at over $200 million annually, focusing on expanding market reach or acquiring advanced propulsion technologies. For instance, xx acquisitions occurred in the last two years, primarily involving engine technology firms or regional distribution networks. The market structure, while mature in some respects, remains fluid, driven by both top-down regulatory pressure and bottom-up demand for sustainable and economically viable transport solutions. The interplay of these dynamics shapes a market that is both competitive and ripe for innovation.
CNG Commercial Vehicles Growth Trends & Insights
The CNG Commercial Vehicles market is experiencing robust growth, driven by a confluence of economic, environmental, and technological factors. From a market size of approximately $12,500 million in 2019, the sector is projected to reach an impressive $15,000 million in the base year 2025. This growth trajectory is underpinned by an estimated Compound Annual Growth Rate (CAGR) of 8.5% during the forecast period of 2025–2033, propelling the market to an estimated $28,000 million by 2033. Adoption rates for CNG commercial vehicles, particularly in heavy-duty trucks and city buses, are accelerating globally. This is largely due to increasing awareness of environmental benefits, coupled with attractive government incentives and the stable pricing of natural gas compared to diesel. Market penetration, which stood at around xx% within the total commercial vehicle segment in 2024, is forecast to increase to over xx% by 2033, indicating a significant shift in fleet composition.
Technological disruptions are playing a crucial role in this evolution. Advancements in CNG engine technology have resulted in higher power output, improved fuel efficiency, and extended service intervals, effectively addressing previous performance concerns. Innovations such as advanced lean-burn engines and optimized fuel delivery systems are making CNG vehicles more competitive against traditional diesel counterparts. Furthermore, the development of lighter, stronger, and more cost-effective CNG storage tanks is enhancing payload capacity and range, directly influencing consumer behavior. Fleet operators are increasingly evaluating the long-term operational costs and environmental impact, with TCO calculations often favoring CNG vehicles due to lower fuel costs and reduced emissions penalties. Consumer behavior shifts are also evident in procurement decisions, where sustainability is becoming a key criterion alongside reliability and performance. The move towards green logistics and fleet decarbonization initiatives by major corporations is further solidifying the demand for CNG commercial vehicles. The urban transport segment, particularly in rapidly urbanizing economies, is witnessing substantial growth in CNG bus fleets due to air quality concerns and governmental mandates. This trend is not uniform across all regions, but a general global movement towards cleaner fuels is undeniably shaping the market's trajectory, making CNG a vital component of future commercial transportation strategies.
Dominant Regions, Countries, or Segments in CNG Commercial Vehicles
The CNG Commercial Vehicles market exhibits distinct patterns of dominance across various geographical regions and application segments. The Asia Pacific region emerges as the unequivocal leader, driving a significant portion of global market growth. Within this region, China and India stand out as the primary growth engines, collectively accounting for over xx% of the region's CNG commercial vehicle sales in 2024. This dominance is primarily fueled by a potent combination of factors:
- Economic Policies: Robust government support in China and India, including subsidies for CNG vehicle purchases, tax incentives, and mandates for public transport fleets to transition to cleaner fuels, has been instrumental.
- Infrastructure Development: Extensive and continuously expanding CNG refueling station networks in both countries reduce range anxiety and increase operational feasibility for fleet operators.
- Urban Air Quality Concerns: Rapid urbanization and severe air pollution issues in major cities have compelled governments to aggressively promote CNG vehicles, especially for buses and municipal service trucks.
- Cost-Effectiveness: The lower operating cost of CNG compared to diesel in these markets presents a compelling economic advantage for businesses.
Within the application segments, Trucks represent the largest and fastest-growing category, commanding an estimated xx% market share in 2025. This is driven by the increasing demand for sustainable freight transportation, particularly for medium and heavy-duty applications. Logistics companies are increasingly investing in CNG trucks to meet environmental targets and capitalize on fuel cost savings. The Buses & Coaches segment follows closely, especially in urban public transport, where fleet conversions to CNG are a global trend. The "Others" segment, encompassing utility vehicles and specialized commercial applications, is also showing promising growth, albeit from a smaller base.
Regarding types, the OEM (Original Equipment Manufacturer) segment holds the overwhelming majority of the market, accounting for over xx% of new CNG commercial vehicle sales. OEMs like Tata Motors, Ashok Leyland, Sinotruk, and Dongfeng Motor have made substantial investments in developing dedicated CNG platforms, offering vehicles with integrated performance, safety, and warranty support. The Car Modification (Aftermarket Conversion) segment, while smaller, plays a crucial role in regions where new OEM CNG vehicle availability might be limited or where existing fleets seek to transition economically. However, regulatory hurdles and safety standards often make OEM solutions preferable for large-scale commercial operations. The dominance of these regions and segments is not static; ongoing policy shifts, infrastructure investments, and technological advancements will continue to reshape the competitive landscape, but the foundational drivers suggest their leadership will endure through the forecast period.
CNG Commercial Vehicles Product Landscape
The CNG Commercial Vehicles product landscape is marked by continuous innovation, aiming to enhance performance, efficiency, and environmental credentials. Modern CNG engines, developed by leading OEMs such as Scania and MAN Truck & Bus, feature advanced lean-burn or stoichiometric combustion technologies, delivering comparable power and torque to their diesel counterparts while significantly reducing NOx and PM emissions. Key advancements include high-pressure direct injection systems and robust engine control units that optimize fuel consumption. Applications range from urban delivery trucks and long-haul transport to public transit buses and waste management vehicles. For instance, new CNG models offer a typical driving range of 400-600 km, supported by improved fuel tank capacities and quick refueling times. Unique selling propositions center on a significantly lower carbon footprint, reduced noise levels, and compelling operational cost savings due to the price differential between CNG and conventional fuels. Volvo Group's and Daimler AG's latest CNG offerings emphasize telematics integration for fleet management and predictive maintenance, further improving efficiency and uptime for operators.
Key Drivers, Barriers & Challenges in CNG Commercial Vehicles
The CNG Commercial Vehicles market is propelled by several potent drivers. Technological advancements in engine design, fuel storage, and vehicle integration have significantly improved performance, range, and reliability, making CNG a viable alternative to diesel. Economic factors, primarily the lower and more stable price of natural gas compared to petroleum fuels, offer substantial operational cost savings, boosting the Total Cost of Ownership (TCO) advantage for fleet operators. Policy-driven factors, such as stringent emission regulations (e.g., Euro VI, Bharat Stage VI), government incentives (subsidies, tax breaks), and mandates for green fleets in urban areas, are critical catalysts for adoption. For example, several cities in India mandate CNG for public transport, while European initiatives encourage sustainable urban logistics. The growing global focus on reducing greenhouse gas emissions and improving urban air quality further strengthens the market's foundation.
Despite these drivers, the market faces notable barriers and challenges. Infrastructure availability, particularly the limited network of CNG refueling stations outside major urban centers and along long-haul routes, remains a significant restraint, causing range anxiety for fleet managers. High upfront investment costs for CNG vehicles and refueling infrastructure can deter smaller operators, despite long-term operational savings. Regulatory hurdles related to vehicle certification, safety standards for high-pressure fuel systems, and inconsistent policies across regions create complexities. Furthermore, supply chain issues for specific CNG components, such as specialized tanks and high-pressure valves, can lead to production delays and increased costs. The competitive pressure from rapidly advancing electric and hydrogen fuel cell commercial vehicles also presents a long-term challenge, as these alternatives benefit from substantial R&D investments and increasing policy support for zero-emission solutions.
Emerging Opportunities in CNG Commercial Vehicles
The CNG Commercial Vehicles market is poised for significant growth through several emerging opportunities. Untapped markets in developing economies, particularly across Southeast Asia and Africa, present immense potential as these regions urbanize and seek cost-effective, cleaner transportation solutions. As natural gas infrastructure expands, these regions are likely to see rapid adoption. Innovative applications beyond traditional buses and trucks, such as CNG-powered port vehicles, construction machinery, and specialized municipal utility vehicles, represent new frontiers. The integration of biomethane (renewable natural gas - RNG) offers a compelling pathway to near-zero carbon transport, elevating CNG's environmental credentials and opening doors to new policy support and premium market segments. Evolving consumer preferences towards eco-friendly logistics and sustainable supply chains are compelling corporate fleets to transition to cleaner alternatives, creating a pull for CNG solutions. The growth of last-mile delivery services in dense urban areas, where air quality is a major concern, also offers a niche for smaller CNG commercial vehicles.
Growth Accelerators in the CNG Commercial Vehicles Industry
Several catalysts are set to accelerate long-term growth in the CNG Commercial Vehicles industry. Foremost among these are technological breakthroughs in engine efficiency, lighter composite fuel tanks, and advanced telematics. These innovations will enhance vehicle performance, extend range, and reduce operational costs, making CNG vehicles even more attractive. Strategic partnerships between vehicle manufacturers, natural gas suppliers, and infrastructure developers are crucial for building integrated ecosystems that simplify adoption for fleet operators. Collaborative initiatives for developing refueling networks and financing solutions will mitigate key barriers. Furthermore, market expansion strategies targeting new geographical regions with nascent natural gas infrastructure and increasing urbanization, coupled with targeted incentives for fleet conversions, will drive volume growth. The increasing global focus on circular economy principles and the production of biomethane (RNG) from organic waste will also provide a sustainable fuel source, enhancing the green credentials and long-term viability of CNG commercial vehicles, positioning them as a critical element of the global energy transition.
Key Players Shaping the CNG Commercial Vehicles Market
- Volvo Group
- Daimler AG
- PACCAR
- Iveco
- Scania
- MAN Truck & Bus
- Dongfeng Motor
- Sinotruk
- FAW
- Tata Motors
- Ashok Leyland
Notable Milestones in CNG Commercial Vehicles Sector
- 2019: European Commission introduces stricter CO2 emission targets for heavy-duty vehicles, indirectly boosting interest in alternative fuels like CNG.
- 2020: Tata Motors launches BSVI-compliant CNG truck and bus range in India, significantly upgrading offerings for key emerging markets.
- 2021 (May): Iveco introduces the first natural gas-powered heavy-duty truck with a range of up to 1,600 km, showcasing range parity with diesel for long-haul applications.
- 2022 (July): China announces aggressive plans to expand its CNG and LNG refueling infrastructure, signaling continued strong support for natural gas vehicles.
- 2023 (October): PACCAR's DAF Trucks division introduces new generation CNG engines for vocational applications, demonstrating commitment from major Western OEMs.
- 2024 (February): Several major logistics companies in North America announce pilots and significant orders for CNG trucks, driven by sustainability targets and fuel cost stability.
In-Depth CNG Commercial Vehicles Market Outlook
The outlook for the CNG Commercial Vehicles market is exceedingly positive, driven by persistent demand for sustainable and economically viable transportation solutions. Growth accelerators, including continuous technological advancements in engine efficiency and fuel storage, will enhance vehicle performance and broaden application scope. Strategic partnerships across the value chain, from natural gas suppliers to vehicle manufacturers and fleet operators, will foster a more integrated and accessible ecosystem, overcoming infrastructure challenges. Furthermore, proactive market expansion strategies targeting high-growth emerging economies and specialized commercial segments will unlock new revenue streams. The increasing adoption of biomethane (RNG) will significantly bolster CNG's environmental credentials, positioning it as a leading solution for fleet decarbonization and a bridge to a truly carbon-neutral future. This convergence of technological prowess, collaborative efforts, and strategic market positioning underscores a robust future market potential, offering significant strategic opportunities for stakeholders across the entire commercial vehicle industry.
CNG Commercial Vehicles Segmentation
-
1. Application
- 1.1. Buses & Coaches
- 1.2. Trucks
- 1.3. Others
-
2. Types
- 2.1. OEM
- 2.2. Car Modification
CNG Commercial Vehicles Segmentation By Geography
-
1. North America
- 1.1. United States
- 1.2. Canada
- 1.3. Mexico
-
2. South America
- 2.1. Brazil
- 2.2. Argentina
- 2.3. Rest of South America
-
3. Europe
- 3.1. United Kingdom
- 3.2. Germany
- 3.3. France
- 3.4. Italy
- 3.5. Spain
- 3.6. Russia
- 3.7. Benelux
- 3.8. Nordics
- 3.9. Rest of Europe
-
4. Middle East & Africa
- 4.1. Turkey
- 4.2. Israel
- 4.3. GCC
- 4.4. North Africa
- 4.5. South Africa
- 4.6. Rest of Middle East & Africa
-
5. Asia Pacific
- 5.1. China
- 5.2. India
- 5.3. Japan
- 5.4. South Korea
- 5.5. ASEAN
- 5.6. Oceania
- 5.7. Rest of Asia Pacific
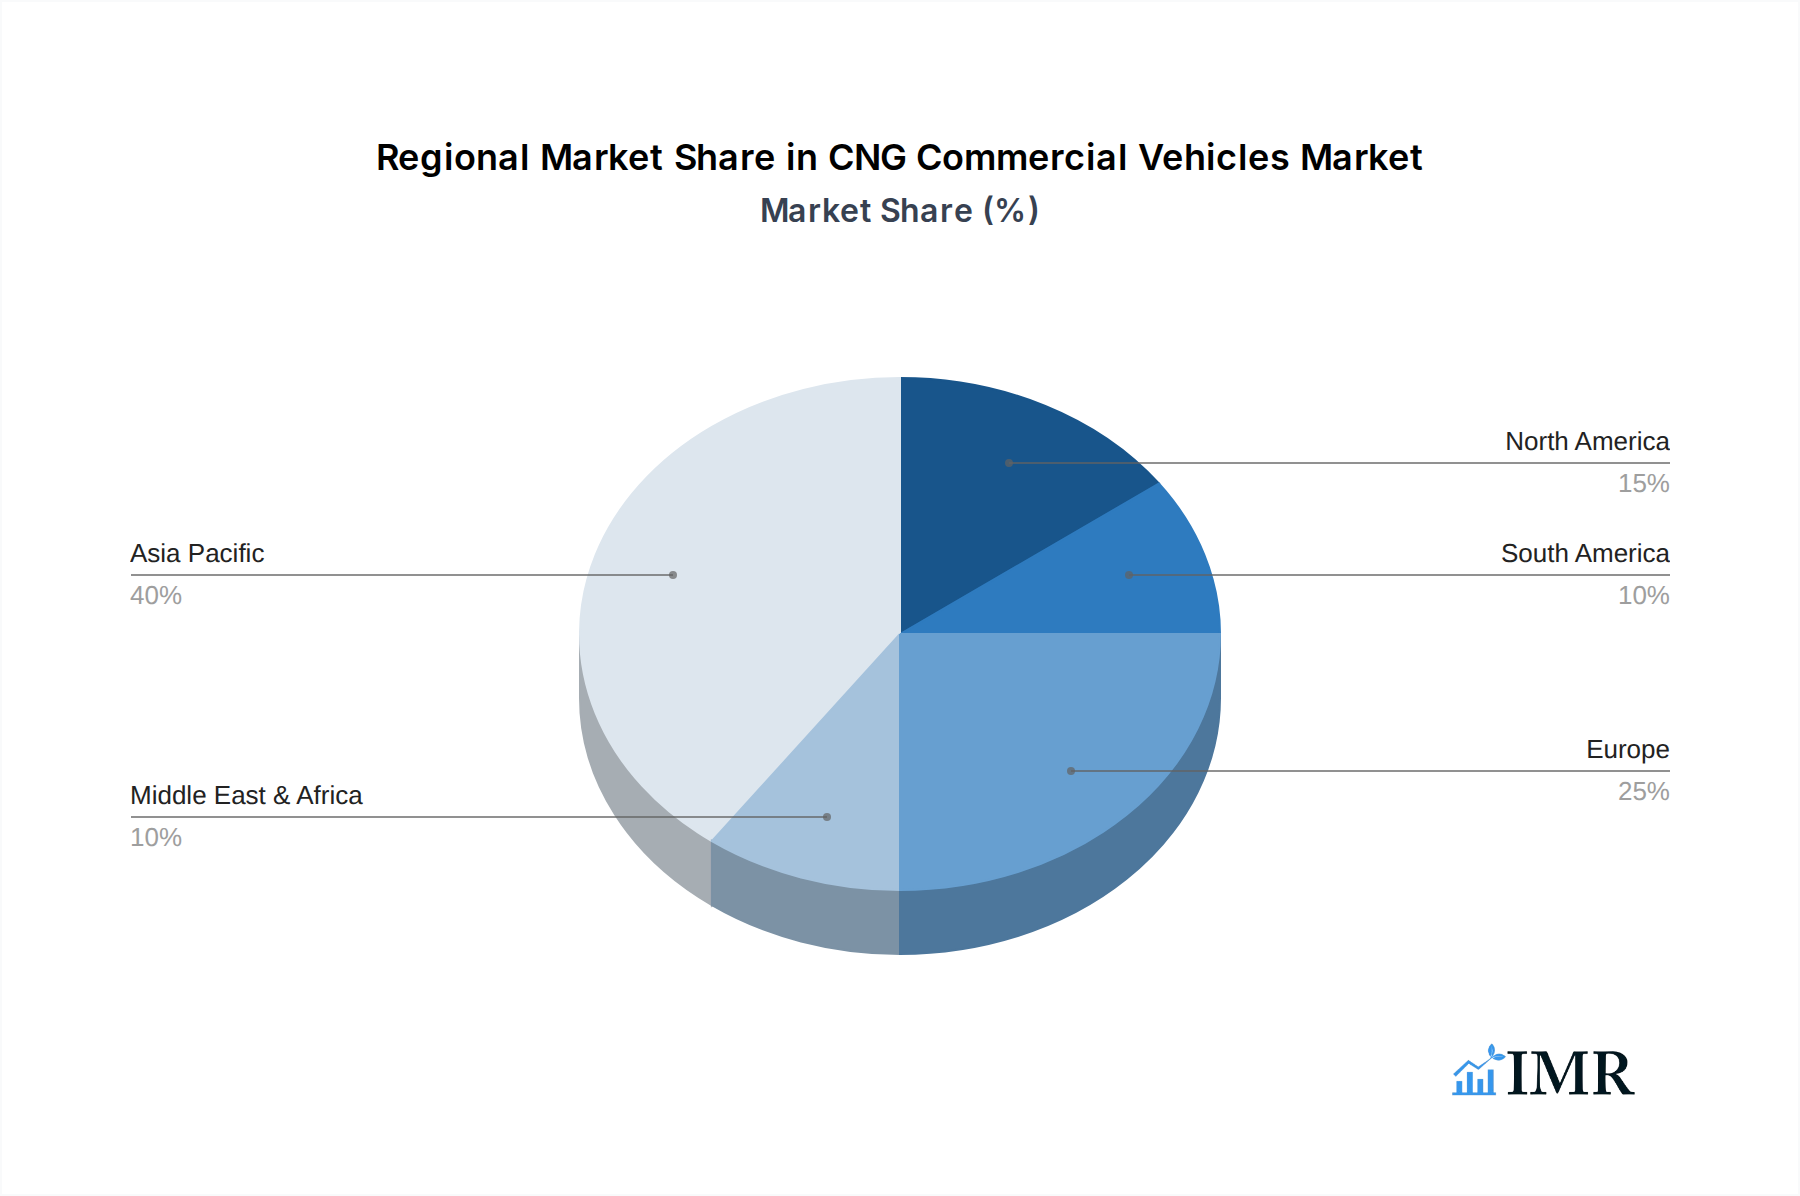
CNG Commercial Vehicles Regional Market Share
Geographic Coverage of CNG Commercial Vehicles
CNG Commercial Vehicles REPORT HIGHLIGHTS
| Aspects | Details |
|---|---|
| Study Period | 2020-2034 |
| Base Year | 2025 |
| Estimated Year | 2026 |
| Forecast Period | 2026-2034 |
| Historical Period | 2020-2025 |
| Growth Rate | CAGR of 5.68% from 2020-2034 |
| Segmentation |
|
Table of Contents
- 1. Introduction
- 1.1. Research Scope
- 1.2. Market Segmentation
- 1.3. Research Objective
- 1.4. Definitions and Assumptions
- 2. Executive Summary
- 2.1. Market Snapshot
- 3. Market Dynamics
- 3.1. Market Drivers
- 3.2. Market Restrains
- 3.3. Market Trends
- 3.4. Market Opportunities
- 4. Market Factor Analysis
- 4.1. Porters Five Forces
- 4.1.1. Bargaining Power of Suppliers
- 4.1.2. Bargaining Power of Buyers
- 4.1.3. Threat of New Entrants
- 4.1.4. Threat of Substitutes
- 4.1.5. Competitive Rivalry
- 4.2. PESTEL analysis
- 4.3. BCG Analysis
- 4.3.1. Stars (High Growth, High Market Share)
- 4.3.2. Cash Cows (Low Growth, High Market Share)
- 4.3.3. Question Mark (High Growth, Low Market Share)
- 4.3.4. Dogs (Low Growth, Low Market Share)
- 4.4. Ansoff Matrix Analysis
- 4.5. Supply Chain Analysis
- 4.6. Regulatory Landscape
- 4.7. Current Market Potential and Opportunity Assessment (TAM–SAM–SOM Framework)
- 4.8. IMR Analyst Note
- 4.1. Porters Five Forces
- 5. Market Analysis, Insights and Forecast 2021-2033
- 5.1. Market Analysis, Insights and Forecast - by Application
- 5.1.1. Buses & Coaches
- 5.1.2. Trucks
- 5.1.3. Others
- 5.2. Market Analysis, Insights and Forecast - by Types
- 5.2.1. OEM
- 5.2.2. Car Modification
- 5.3. Market Analysis, Insights and Forecast - by Region
- 5.3.1. North America
- 5.3.2. South America
- 5.3.3. Europe
- 5.3.4. Middle East & Africa
- 5.3.5. Asia Pacific
- 5.1. Market Analysis, Insights and Forecast - by Application
- 6. Global CNG Commercial Vehicles Analysis, Insights and Forecast, 2021-2033
- 6.1. Market Analysis, Insights and Forecast - by Application
- 6.1.1. Buses & Coaches
- 6.1.2. Trucks
- 6.1.3. Others
- 6.2. Market Analysis, Insights and Forecast - by Types
- 6.2.1. OEM
- 6.2.2. Car Modification
- 6.1. Market Analysis, Insights and Forecast - by Application
- 7. North America CNG Commercial Vehicles Analysis, Insights and Forecast, 2020-2032
- 7.1. Market Analysis, Insights and Forecast - by Application
- 7.1.1. Buses & Coaches
- 7.1.2. Trucks
- 7.1.3. Others
- 7.2. Market Analysis, Insights and Forecast - by Types
- 7.2.1. OEM
- 7.2.2. Car Modification
- 7.1. Market Analysis, Insights and Forecast - by Application
- 8. South America CNG Commercial Vehicles Analysis, Insights and Forecast, 2020-2032
- 8.1. Market Analysis, Insights and Forecast - by Application
- 8.1.1. Buses & Coaches
- 8.1.2. Trucks
- 8.1.3. Others
- 8.2. Market Analysis, Insights and Forecast - by Types
- 8.2.1. OEM
- 8.2.2. Car Modification
- 8.1. Market Analysis, Insights and Forecast - by Application
- 9. Europe CNG Commercial Vehicles Analysis, Insights and Forecast, 2020-2032
- 9.1. Market Analysis, Insights and Forecast - by Application
- 9.1.1. Buses & Coaches
- 9.1.2. Trucks
- 9.1.3. Others
- 9.2. Market Analysis, Insights and Forecast - by Types
- 9.2.1. OEM
- 9.2.2. Car Modification
- 9.1. Market Analysis, Insights and Forecast - by Application
- 10. Middle East & Africa CNG Commercial Vehicles Analysis, Insights and Forecast, 2020-2032
- 10.1. Market Analysis, Insights and Forecast - by Application
- 10.1.1. Buses & Coaches
- 10.1.2. Trucks
- 10.1.3. Others
- 10.2. Market Analysis, Insights and Forecast - by Types
- 10.2.1. OEM
- 10.2.2. Car Modification
- 10.1. Market Analysis, Insights and Forecast - by Application
- 11. Asia Pacific CNG Commercial Vehicles Analysis, Insights and Forecast, 2020-2032
- 11.1. Market Analysis, Insights and Forecast - by Application
- 11.1.1. Buses & Coaches
- 11.1.2. Trucks
- 11.1.3. Others
- 11.2. Market Analysis, Insights and Forecast - by Types
- 11.2.1. OEM
- 11.2.2. Car Modification
- 11.1. Market Analysis, Insights and Forecast - by Application
- 12. Competitive Analysis
- 12.1. Company Profiles
- 12.1.1 Volvo Group
- 12.1.1.1. Company Overview
- 12.1.1.2. Products
- 12.1.1.3. Company Financials
- 12.1.1.4. SWOT Analysis
- 12.1.2 Daimler AG
- 12.1.2.1. Company Overview
- 12.1.2.2. Products
- 12.1.2.3. Company Financials
- 12.1.2.4. SWOT Analysis
- 12.1.3 PACCAR
- 12.1.3.1. Company Overview
- 12.1.3.2. Products
- 12.1.3.3. Company Financials
- 12.1.3.4. SWOT Analysis
- 12.1.4 Iveco
- 12.1.4.1. Company Overview
- 12.1.4.2. Products
- 12.1.4.3. Company Financials
- 12.1.4.4. SWOT Analysis
- 12.1.5 Scania
- 12.1.5.1. Company Overview
- 12.1.5.2. Products
- 12.1.5.3. Company Financials
- 12.1.5.4. SWOT Analysis
- 12.1.6 MAN Truck & Bus
- 12.1.6.1. Company Overview
- 12.1.6.2. Products
- 12.1.6.3. Company Financials
- 12.1.6.4. SWOT Analysis
- 12.1.7 Dongfeng Motor
- 12.1.7.1. Company Overview
- 12.1.7.2. Products
- 12.1.7.3. Company Financials
- 12.1.7.4. SWOT Analysis
- 12.1.8 Sinotruk
- 12.1.8.1. Company Overview
- 12.1.8.2. Products
- 12.1.8.3. Company Financials
- 12.1.8.4. SWOT Analysis
- 12.1.9 FAW
- 12.1.9.1. Company Overview
- 12.1.9.2. Products
- 12.1.9.3. Company Financials
- 12.1.9.4. SWOT Analysis
- 12.1.10 Tata Motors
- 12.1.10.1. Company Overview
- 12.1.10.2. Products
- 12.1.10.3. Company Financials
- 12.1.10.4. SWOT Analysis
- 12.1.11 Ashok Leyland
- 12.1.11.1. Company Overview
- 12.1.11.2. Products
- 12.1.11.3. Company Financials
- 12.1.11.4. SWOT Analysis
- 12.1.1 Volvo Group
- 12.2. Market Entropy
- 12.2.1 Company's Key Areas Served
- 12.2.2 Recent Developments
- 12.3. Company Market Share Analysis 2025
- 12.3.1 Top 5 Companies Market Share Analysis
- 12.3.2 Top 3 Companies Market Share Analysis
- 12.4. List of Potential Customers
- 13. Research Methodology
List of Figures
- Figure 1: Global CNG Commercial Vehicles Revenue Breakdown (billion, %) by Region 2025 & 2033
- Figure 2: Global CNG Commercial Vehicles Volume Breakdown (K, %) by Region 2025 & 2033
- Figure 3: North America CNG Commercial Vehicles Revenue (billion), by Application 2025 & 2033
- Figure 4: North America CNG Commercial Vehicles Volume (K), by Application 2025 & 2033
- Figure 5: North America CNG Commercial Vehicles Revenue Share (%), by Application 2025 & 2033
- Figure 6: North America CNG Commercial Vehicles Volume Share (%), by Application 2025 & 2033
- Figure 7: North America CNG Commercial Vehicles Revenue (billion), by Types 2025 & 2033
- Figure 8: North America CNG Commercial Vehicles Volume (K), by Types 2025 & 2033
- Figure 9: North America CNG Commercial Vehicles Revenue Share (%), by Types 2025 & 2033
- Figure 10: North America CNG Commercial Vehicles Volume Share (%), by Types 2025 & 2033
- Figure 11: North America CNG Commercial Vehicles Revenue (billion), by Country 2025 & 2033
- Figure 12: North America CNG Commercial Vehicles Volume (K), by Country 2025 & 2033
- Figure 13: North America CNG Commercial Vehicles Revenue Share (%), by Country 2025 & 2033
- Figure 14: North America CNG Commercial Vehicles Volume Share (%), by Country 2025 & 2033
- Figure 15: South America CNG Commercial Vehicles Revenue (billion), by Application 2025 & 2033
- Figure 16: South America CNG Commercial Vehicles Volume (K), by Application 2025 & 2033
- Figure 17: South America CNG Commercial Vehicles Revenue Share (%), by Application 2025 & 2033
- Figure 18: South America CNG Commercial Vehicles Volume Share (%), by Application 2025 & 2033
- Figure 19: South America CNG Commercial Vehicles Revenue (billion), by Types 2025 & 2033
- Figure 20: South America CNG Commercial Vehicles Volume (K), by Types 2025 & 2033
- Figure 21: South America CNG Commercial Vehicles Revenue Share (%), by Types 2025 & 2033
- Figure 22: South America CNG Commercial Vehicles Volume Share (%), by Types 2025 & 2033
- Figure 23: South America CNG Commercial Vehicles Revenue (billion), by Country 2025 & 2033
- Figure 24: South America CNG Commercial Vehicles Volume (K), by Country 2025 & 2033
- Figure 25: South America CNG Commercial Vehicles Revenue Share (%), by Country 2025 & 2033
- Figure 26: South America CNG Commercial Vehicles Volume Share (%), by Country 2025 & 2033
- Figure 27: Europe CNG Commercial Vehicles Revenue (billion), by Application 2025 & 2033
- Figure 28: Europe CNG Commercial Vehicles Volume (K), by Application 2025 & 2033
- Figure 29: Europe CNG Commercial Vehicles Revenue Share (%), by Application 2025 & 2033
- Figure 30: Europe CNG Commercial Vehicles Volume Share (%), by Application 2025 & 2033
- Figure 31: Europe CNG Commercial Vehicles Revenue (billion), by Types 2025 & 2033
- Figure 32: Europe CNG Commercial Vehicles Volume (K), by Types 2025 & 2033
- Figure 33: Europe CNG Commercial Vehicles Revenue Share (%), by Types 2025 & 2033
- Figure 34: Europe CNG Commercial Vehicles Volume Share (%), by Types 2025 & 2033
- Figure 35: Europe CNG Commercial Vehicles Revenue (billion), by Country 2025 & 2033
- Figure 36: Europe CNG Commercial Vehicles Volume (K), by Country 2025 & 2033
- Figure 37: Europe CNG Commercial Vehicles Revenue Share (%), by Country 2025 & 2033
- Figure 38: Europe CNG Commercial Vehicles Volume Share (%), by Country 2025 & 2033
- Figure 39: Middle East & Africa CNG Commercial Vehicles Revenue (billion), by Application 2025 & 2033
- Figure 40: Middle East & Africa CNG Commercial Vehicles Volume (K), by Application 2025 & 2033
- Figure 41: Middle East & Africa CNG Commercial Vehicles Revenue Share (%), by Application 2025 & 2033
- Figure 42: Middle East & Africa CNG Commercial Vehicles Volume Share (%), by Application 2025 & 2033
- Figure 43: Middle East & Africa CNG Commercial Vehicles Revenue (billion), by Types 2025 & 2033
- Figure 44: Middle East & Africa CNG Commercial Vehicles Volume (K), by Types 2025 & 2033
- Figure 45: Middle East & Africa CNG Commercial Vehicles Revenue Share (%), by Types 2025 & 2033
- Figure 46: Middle East & Africa CNG Commercial Vehicles Volume Share (%), by Types 2025 & 2033
- Figure 47: Middle East & Africa CNG Commercial Vehicles Revenue (billion), by Country 2025 & 2033
- Figure 48: Middle East & Africa CNG Commercial Vehicles Volume (K), by Country 2025 & 2033
- Figure 49: Middle East & Africa CNG Commercial Vehicles Revenue Share (%), by Country 2025 & 2033
- Figure 50: Middle East & Africa CNG Commercial Vehicles Volume Share (%), by Country 2025 & 2033
- Figure 51: Asia Pacific CNG Commercial Vehicles Revenue (billion), by Application 2025 & 2033
- Figure 52: Asia Pacific CNG Commercial Vehicles Volume (K), by Application 2025 & 2033
- Figure 53: Asia Pacific CNG Commercial Vehicles Revenue Share (%), by Application 2025 & 2033
- Figure 54: Asia Pacific CNG Commercial Vehicles Volume Share (%), by Application 2025 & 2033
- Figure 55: Asia Pacific CNG Commercial Vehicles Revenue (billion), by Types 2025 & 2033
- Figure 56: Asia Pacific CNG Commercial Vehicles Volume (K), by Types 2025 & 2033
- Figure 57: Asia Pacific CNG Commercial Vehicles Revenue Share (%), by Types 2025 & 2033
- Figure 58: Asia Pacific CNG Commercial Vehicles Volume Share (%), by Types 2025 & 2033
- Figure 59: Asia Pacific CNG Commercial Vehicles Revenue (billion), by Country 2025 & 2033
- Figure 60: Asia Pacific CNG Commercial Vehicles Volume (K), by Country 2025 & 2033
- Figure 61: Asia Pacific CNG Commercial Vehicles Revenue Share (%), by Country 2025 & 2033
- Figure 62: Asia Pacific CNG Commercial Vehicles Volume Share (%), by Country 2025 & 2033
List of Tables
- Table 1: Global CNG Commercial Vehicles Revenue billion Forecast, by Application 2020 & 2033
- Table 2: Global CNG Commercial Vehicles Volume K Forecast, by Application 2020 & 2033
- Table 3: Global CNG Commercial Vehicles Revenue billion Forecast, by Types 2020 & 2033
- Table 4: Global CNG Commercial Vehicles Volume K Forecast, by Types 2020 & 2033
- Table 5: Global CNG Commercial Vehicles Revenue billion Forecast, by Region 2020 & 2033
- Table 6: Global CNG Commercial Vehicles Volume K Forecast, by Region 2020 & 2033
- Table 7: Global CNG Commercial Vehicles Revenue billion Forecast, by Application 2020 & 2033
- Table 8: Global CNG Commercial Vehicles Volume K Forecast, by Application 2020 & 2033
- Table 9: Global CNG Commercial Vehicles Revenue billion Forecast, by Types 2020 & 2033
- Table 10: Global CNG Commercial Vehicles Volume K Forecast, by Types 2020 & 2033
- Table 11: Global CNG Commercial Vehicles Revenue billion Forecast, by Country 2020 & 2033
- Table 12: Global CNG Commercial Vehicles Volume K Forecast, by Country 2020 & 2033
- Table 13: United States CNG Commercial Vehicles Revenue (billion) Forecast, by Application 2020 & 2033
- Table 14: United States CNG Commercial Vehicles Volume (K) Forecast, by Application 2020 & 2033
- Table 15: Canada CNG Commercial Vehicles Revenue (billion) Forecast, by Application 2020 & 2033
- Table 16: Canada CNG Commercial Vehicles Volume (K) Forecast, by Application 2020 & 2033
- Table 17: Mexico CNG Commercial Vehicles Revenue (billion) Forecast, by Application 2020 & 2033
- Table 18: Mexico CNG Commercial Vehicles Volume (K) Forecast, by Application 2020 & 2033
- Table 19: Global CNG Commercial Vehicles Revenue billion Forecast, by Application 2020 & 2033
- Table 20: Global CNG Commercial Vehicles Volume K Forecast, by Application 2020 & 2033
- Table 21: Global CNG Commercial Vehicles Revenue billion Forecast, by Types 2020 & 2033
- Table 22: Global CNG Commercial Vehicles Volume K Forecast, by Types 2020 & 2033
- Table 23: Global CNG Commercial Vehicles Revenue billion Forecast, by Country 2020 & 2033
- Table 24: Global CNG Commercial Vehicles Volume K Forecast, by Country 2020 & 2033
- Table 25: Brazil CNG Commercial Vehicles Revenue (billion) Forecast, by Application 2020 & 2033
- Table 26: Brazil CNG Commercial Vehicles Volume (K) Forecast, by Application 2020 & 2033
- Table 27: Argentina CNG Commercial Vehicles Revenue (billion) Forecast, by Application 2020 & 2033
- Table 28: Argentina CNG Commercial Vehicles Volume (K) Forecast, by Application 2020 & 2033
- Table 29: Rest of South America CNG Commercial Vehicles Revenue (billion) Forecast, by Application 2020 & 2033
- Table 30: Rest of South America CNG Commercial Vehicles Volume (K) Forecast, by Application 2020 & 2033
- Table 31: Global CNG Commercial Vehicles Revenue billion Forecast, by Application 2020 & 2033
- Table 32: Global CNG Commercial Vehicles Volume K Forecast, by Application 2020 & 2033
- Table 33: Global CNG Commercial Vehicles Revenue billion Forecast, by Types 2020 & 2033
- Table 34: Global CNG Commercial Vehicles Volume K Forecast, by Types 2020 & 2033
- Table 35: Global CNG Commercial Vehicles Revenue billion Forecast, by Country 2020 & 2033
- Table 36: Global CNG Commercial Vehicles Volume K Forecast, by Country 2020 & 2033
- Table 37: United Kingdom CNG Commercial Vehicles Revenue (billion) Forecast, by Application 2020 & 2033
- Table 38: United Kingdom CNG Commercial Vehicles Volume (K) Forecast, by Application 2020 & 2033
- Table 39: Germany CNG Commercial Vehicles Revenue (billion) Forecast, by Application 2020 & 2033
- Table 40: Germany CNG Commercial Vehicles Volume (K) Forecast, by Application 2020 & 2033
- Table 41: France CNG Commercial Vehicles Revenue (billion) Forecast, by Application 2020 & 2033
- Table 42: France CNG Commercial Vehicles Volume (K) Forecast, by Application 2020 & 2033
- Table 43: Italy CNG Commercial Vehicles Revenue (billion) Forecast, by Application 2020 & 2033
- Table 44: Italy CNG Commercial Vehicles Volume (K) Forecast, by Application 2020 & 2033
- Table 45: Spain CNG Commercial Vehicles Revenue (billion) Forecast, by Application 2020 & 2033
- Table 46: Spain CNG Commercial Vehicles Volume (K) Forecast, by Application 2020 & 2033
- Table 47: Russia CNG Commercial Vehicles Revenue (billion) Forecast, by Application 2020 & 2033
- Table 48: Russia CNG Commercial Vehicles Volume (K) Forecast, by Application 2020 & 2033
- Table 49: Benelux CNG Commercial Vehicles Revenue (billion) Forecast, by Application 2020 & 2033
- Table 50: Benelux CNG Commercial Vehicles Volume (K) Forecast, by Application 2020 & 2033
- Table 51: Nordics CNG Commercial Vehicles Revenue (billion) Forecast, by Application 2020 & 2033
- Table 52: Nordics CNG Commercial Vehicles Volume (K) Forecast, by Application 2020 & 2033
- Table 53: Rest of Europe CNG Commercial Vehicles Revenue (billion) Forecast, by Application 2020 & 2033
- Table 54: Rest of Europe CNG Commercial Vehicles Volume (K) Forecast, by Application 2020 & 2033
- Table 55: Global CNG Commercial Vehicles Revenue billion Forecast, by Application 2020 & 2033
- Table 56: Global CNG Commercial Vehicles Volume K Forecast, by Application 2020 & 2033
- Table 57: Global CNG Commercial Vehicles Revenue billion Forecast, by Types 2020 & 2033
- Table 58: Global CNG Commercial Vehicles Volume K Forecast, by Types 2020 & 2033
- Table 59: Global CNG Commercial Vehicles Revenue billion Forecast, by Country 2020 & 2033
- Table 60: Global CNG Commercial Vehicles Volume K Forecast, by Country 2020 & 2033
- Table 61: Turkey CNG Commercial Vehicles Revenue (billion) Forecast, by Application 2020 & 2033
- Table 62: Turkey CNG Commercial Vehicles Volume (K) Forecast, by Application 2020 & 2033
- Table 63: Israel CNG Commercial Vehicles Revenue (billion) Forecast, by Application 2020 & 2033
- Table 64: Israel CNG Commercial Vehicles Volume (K) Forecast, by Application 2020 & 2033
- Table 65: GCC CNG Commercial Vehicles Revenue (billion) Forecast, by Application 2020 & 2033
- Table 66: GCC CNG Commercial Vehicles Volume (K) Forecast, by Application 2020 & 2033
- Table 67: North Africa CNG Commercial Vehicles Revenue (billion) Forecast, by Application 2020 & 2033
- Table 68: North Africa CNG Commercial Vehicles Volume (K) Forecast, by Application 2020 & 2033
- Table 69: South Africa CNG Commercial Vehicles Revenue (billion) Forecast, by Application 2020 & 2033
- Table 70: South Africa CNG Commercial Vehicles Volume (K) Forecast, by Application 2020 & 2033
- Table 71: Rest of Middle East & Africa CNG Commercial Vehicles Revenue (billion) Forecast, by Application 2020 & 2033
- Table 72: Rest of Middle East & Africa CNG Commercial Vehicles Volume (K) Forecast, by Application 2020 & 2033
- Table 73: Global CNG Commercial Vehicles Revenue billion Forecast, by Application 2020 & 2033
- Table 74: Global CNG Commercial Vehicles Volume K Forecast, by Application 2020 & 2033
- Table 75: Global CNG Commercial Vehicles Revenue billion Forecast, by Types 2020 & 2033
- Table 76: Global CNG Commercial Vehicles Volume K Forecast, by Types 2020 & 2033
- Table 77: Global CNG Commercial Vehicles Revenue billion Forecast, by Country 2020 & 2033
- Table 78: Global CNG Commercial Vehicles Volume K Forecast, by Country 2020 & 2033
- Table 79: China CNG Commercial Vehicles Revenue (billion) Forecast, by Application 2020 & 2033
- Table 80: China CNG Commercial Vehicles Volume (K) Forecast, by Application 2020 & 2033
- Table 81: India CNG Commercial Vehicles Revenue (billion) Forecast, by Application 2020 & 2033
- Table 82: India CNG Commercial Vehicles Volume (K) Forecast, by Application 2020 & 2033
- Table 83: Japan CNG Commercial Vehicles Revenue (billion) Forecast, by Application 2020 & 2033
- Table 84: Japan CNG Commercial Vehicles Volume (K) Forecast, by Application 2020 & 2033
- Table 85: South Korea CNG Commercial Vehicles Revenue (billion) Forecast, by Application 2020 & 2033
- Table 86: South Korea CNG Commercial Vehicles Volume (K) Forecast, by Application 2020 & 2033
- Table 87: ASEAN CNG Commercial Vehicles Revenue (billion) Forecast, by Application 2020 & 2033
- Table 88: ASEAN CNG Commercial Vehicles Volume (K) Forecast, by Application 2020 & 2033
- Table 89: Oceania CNG Commercial Vehicles Revenue (billion) Forecast, by Application 2020 & 2033
- Table 90: Oceania CNG Commercial Vehicles Volume (K) Forecast, by Application 2020 & 2033
- Table 91: Rest of Asia Pacific CNG Commercial Vehicles Revenue (billion) Forecast, by Application 2020 & 2033
- Table 92: Rest of Asia Pacific CNG Commercial Vehicles Volume (K) Forecast, by Application 2020 & 2033
Frequently Asked Questions
1. What is the projected Compound Annual Growth Rate (CAGR) of the CNG Commercial Vehicles?
The projected CAGR is approximately 5.68%.
2. Which companies are prominent players in the CNG Commercial Vehicles?
Key companies in the market include Volvo Group, Daimler AG, PACCAR, Iveco, Scania, MAN Truck & Bus, Dongfeng Motor, Sinotruk, FAW, Tata Motors, Ashok Leyland.
3. What are the main segments of the CNG Commercial Vehicles?
The market segments include Application, Types.
4. Can you provide details about the market size?
The market size is estimated to be USD 52.28 billion as of 2022.
5. What are some drivers contributing to market growth?
N/A
6. What are the notable trends driving market growth?
N/A
7. Are there any restraints impacting market growth?
N/A
8. Can you provide examples of recent developments in the market?
N/A
9. What pricing options are available for accessing the report?
Pricing options include single-user, multi-user, and enterprise licenses priced at USD 4350.00, USD 6525.00, and USD 8700.00 respectively.
10. Is the market size provided in terms of value or volume?
The market size is provided in terms of value, measured in billion and volume, measured in K.
11. Are there any specific market keywords associated with the report?
Yes, the market keyword associated with the report is "CNG Commercial Vehicles," which aids in identifying and referencing the specific market segment covered.
12. How do I determine which pricing option suits my needs best?
The pricing options vary based on user requirements and access needs. Individual users may opt for single-user licenses, while businesses requiring broader access may choose multi-user or enterprise licenses for cost-effective access to the report.
13. Are there any additional resources or data provided in the CNG Commercial Vehicles report?
While the report offers comprehensive insights, it's advisable to review the specific contents or supplementary materials provided to ascertain if additional resources or data are available.
14. How can I stay updated on further developments or reports in the CNG Commercial Vehicles?
To stay informed about further developments, trends, and reports in the CNG Commercial Vehicles, consider subscribing to industry newsletters, following relevant companies and organizations, or regularly checking reputable industry news sources and publications.
Methodology
Step 1 - Identification of Relevant Samples Size from Population Database


Step 2 - Approaches for Defining Global Market Size (Value, Volume* & Price*)

Note*: In applicable scenarios
Step 3 - Data Sources
Primary Research
- Web Analytics
- Survey Reports
- Research Institute
- Latest Research Reports
- Opinion Leaders
Secondary Research
- Annual Reports
- White Paper
- Latest Press Release
- Industry Association
- Paid Database
- Investor Presentations

Step 4 - Data Triangulation
Involves using different sources of information in order to increase the validity of a study
These sources are likely to be stakeholders in a program - participants, other researchers, program staff, other community members, and so on.
Then we put all data in single framework & apply various statistical tools to find out the dynamic on the market.
During the analysis stage, feedback from the stakeholder groups would be compared to determine areas of agreement as well as areas of divergence