

Key Insights
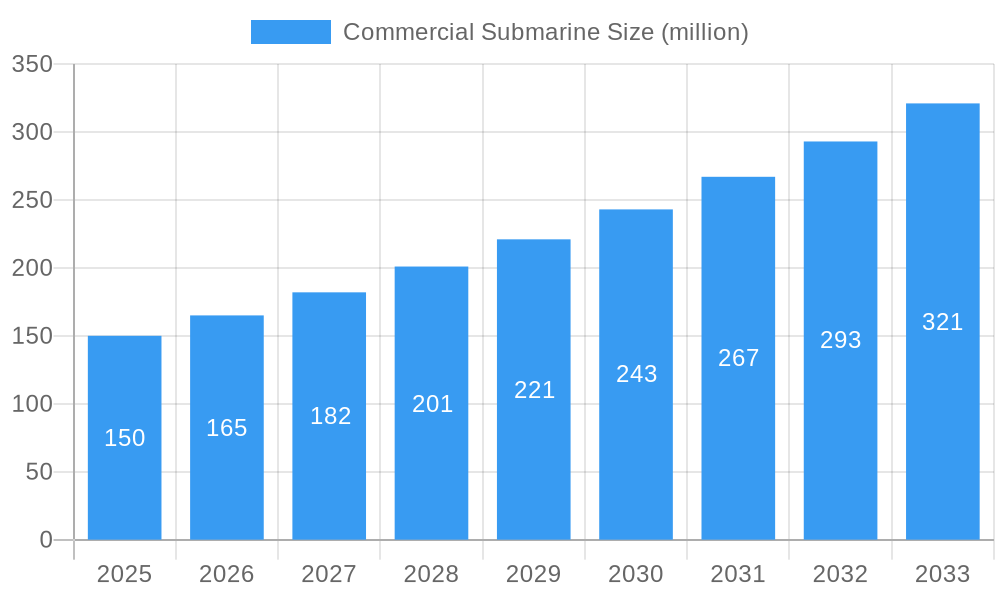
The commercial submarine market, while niche, is experiencing robust growth, driven by increasing demand from tourism, research, and exploration sectors. The market's value in 2025 is estimated at $150 million, reflecting a Compound Annual Growth Rate (CAGR) of 12% from 2019 to 2024. This growth trajectory is projected to continue, with a forecast CAGR of 10% from 2025 to 2033, indicating a market value exceeding $400 million by the end of the forecast period. Key drivers include rising affluence and increasing disposable incomes fueling luxury tourism, advancements in submarine technology leading to safer and more comfortable submersibles, and a growing need for underwater research and exploration in various fields such as marine biology, geology, and archaeology. Companies like Triton, U-Boat Worx, SEAmagine, Y.CO, and Go Friday are key players, leading innovation and expanding market access through diverse product offerings and strategic partnerships.
Commercial Submarine Market Size (In Million)
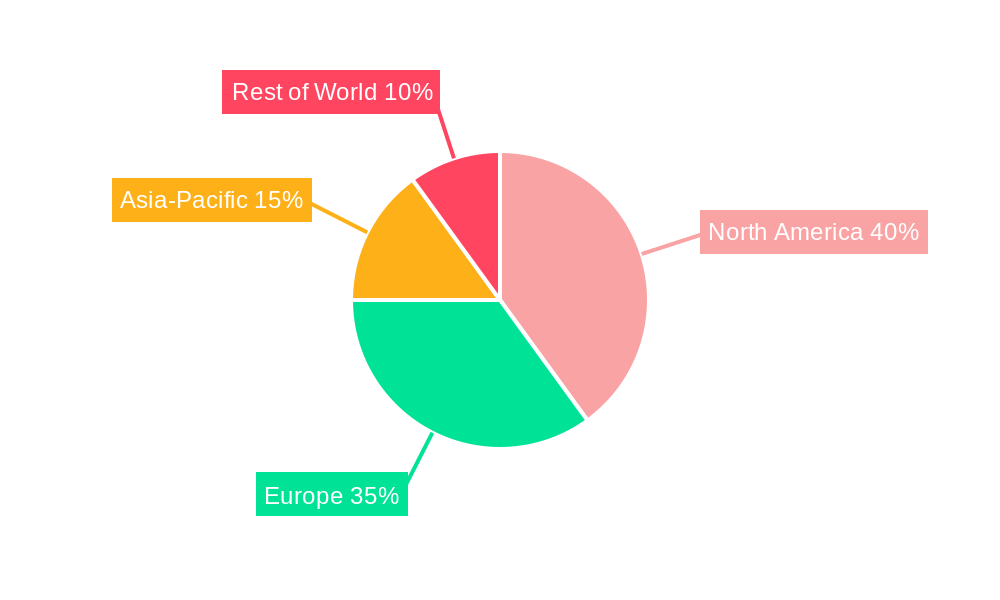
However, market restraints include high initial investment costs associated with purchasing and maintaining commercial submarines, stringent safety regulations, and potential environmental concerns related to underwater operations. The market segmentation is diverse, encompassing various vessel sizes, technological capabilities, and target applications. The regional distribution is expected to be skewed towards North America and Europe, driven by the concentration of high-net-worth individuals and established research institutions in these regions. However, emerging markets in Asia-Pacific are expected to show significant growth potential as tourism and research investment increase. The future growth of this market will strongly depend on continuous technological innovation, addressing safety and environmental concerns, and further development of regulatory frameworks that encourage responsible exploration and tourism.
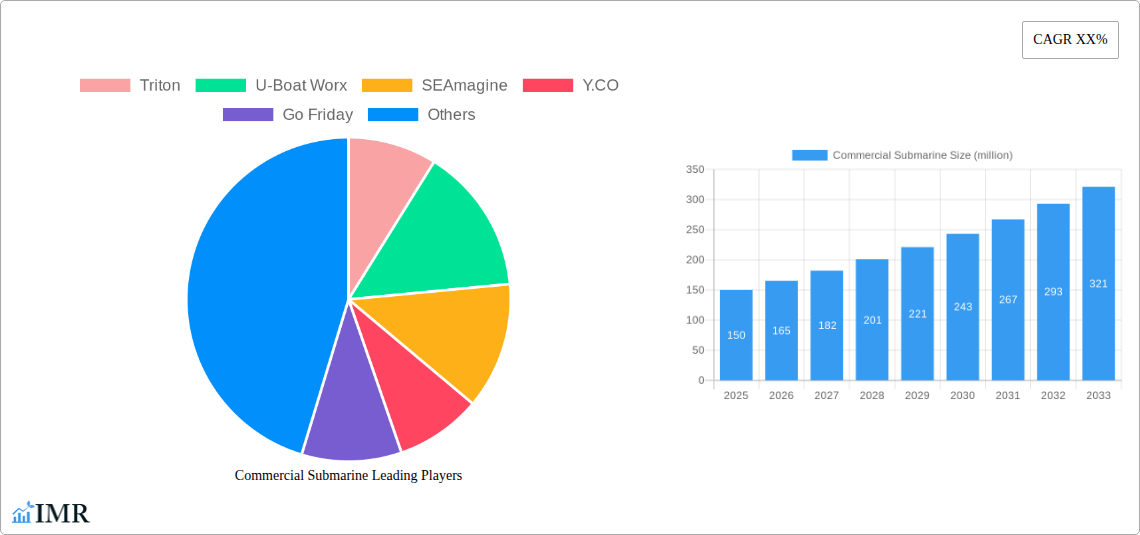
Commercial Submarine Company Market Share
Dive Deep into the Thriving Commercial Submarine Market: A Comprehensive Report (2019-2033)
This meticulously researched report provides a comprehensive analysis of the Commercial Submarine market, offering invaluable insights for industry professionals, investors, and strategic decision-makers. Spanning the period from 2019 to 2033, with a base year of 2025 and a forecast period from 2025 to 2033, this report leverages robust data and in-depth analysis to uncover key market trends, opportunities, and challenges. The report covers the parent market of underwater vehicles and the child market of commercial submarine tourism and research.
Commercial Submarine Market Dynamics & Structure
The global commercial submarine market exhibits a moderately concentrated structure, with key players such as Triton, U-Boat Worx, SEAmagine, Y.CO, and Go Friday holding significant market share. Technological innovation, particularly in materials science and propulsion systems, is a major driver, while regulatory frameworks concerning safety and environmental impact exert considerable influence. The market faces competition from alternative technologies like remotely operated vehicles (ROVs) and autonomous underwater vehicles (AUVs) for specific applications. End-user demographics are broadening, encompassing research institutions, tourism operators, and private individuals. M&A activity has been relatively modest (xx deals in the historical period), primarily focused on consolidating technological expertise and expanding market reach.
- Market Concentration: Moderately concentrated, with top 5 players holding xx% market share in 2025.
- Innovation Drivers: Advancements in battery technology, materials science, and AI-powered navigation systems.
- Regulatory Landscape: Stringent safety standards and environmental regulations influence market growth.
- Competitive Substitutes: ROVs, AUVs, and other underwater exploration technologies.
- End-User Demographics: Research institutions, tourism operators, private owners, and government agencies.
- M&A Trends: Limited M&A activity, primarily focused on technology integration and market expansion.
Commercial Submarine Growth Trends & Insights
The commercial submarine market experienced a compound annual growth rate (CAGR) of xx% during the historical period (2019-2024), driven by increasing demand for underwater exploration and tourism. The market size reached xx million in 2025 and is projected to grow to xx million by 2033, exhibiting a CAGR of xx% during the forecast period (2025-2033). Technological advancements, such as longer operating times and improved safety features, are boosting adoption rates. The rise of luxury underwater tourism and increased government investment in marine research are contributing to market expansion. Consumer behavior is shifting towards experiential tourism, driving demand for personalized and immersive submarine experiences.
Dominant Regions, Countries, or Segments in Commercial Submarine
North America currently dominates the commercial submarine market, accounting for xx% of the global market share in 2025, driven by strong demand from both private and commercial sectors. Europe follows closely, holding xx% market share, fueled by substantial investment in marine research and the growth of the luxury tourism industry. The Asia-Pacific region shows considerable growth potential due to increasing government spending on marine infrastructure and exploration projects.
- North America: High disposable income, well-developed tourism infrastructure, and strong government support for marine research.
- Europe: Significant investments in scientific research and a burgeoning luxury tourism market driving demand.
- Asia-Pacific: Rapid economic growth, expanding tourism sector, and increasing government focus on marine exploration.
Commercial Submarine Product Landscape
The commercial submarine market offers a range of products tailored to diverse applications, from small, single-person submersibles for private exploration to larger, multi-person vessels for research or tourism. Recent innovations focus on enhancing safety features, extending operating range, and improving maneuverability. Manufacturers are emphasizing unique selling propositions such as enhanced viewing systems, comfortable interiors, and advanced navigation technologies. The adoption of lighter, stronger materials is improving both depth capabilities and energy efficiency.
Key Drivers, Barriers & Challenges in Commercial Submarine
Key Drivers:
- Growing demand for underwater tourism and exploration.
- Technological advancements leading to improved safety and performance.
- Increasing government investments in marine research and exploration.
Key Challenges and Restraints:
- High manufacturing costs limiting market accessibility.
- Stringent safety regulations and certification requirements.
- Supply chain constraints impacting production efficiency. This led to a xx% reduction in production capacity in 2024.
Emerging Opportunities in Commercial Submarine
- Expansion of underwater tourism to new markets and destinations.
- Development of specialized submersibles for scientific research and deep-sea exploration.
- Integration of advanced technologies such as AI and autonomous systems.
Growth Accelerators in the Commercial Submarine Industry
Technological breakthroughs in materials science and battery technology are poised to significantly enhance the operational capabilities and cost-effectiveness of commercial submarines, driving substantial market growth. Strategic partnerships between submarine manufacturers and tourism operators are crucial in expanding market reach and creating unique customer experiences. Expansion into new geographic markets with untapped tourism potential will also play a key role in future growth.
Key Players Shaping the Commercial Submarine Market
- Triton Submarines
- U-Boat Worx
- SEAmagine Hydrospace Corporation
- Y.CO
- Go Friday
Notable Milestones in Commercial Submarine Sector
- 2021: Triton Submarines launched the 36,000-foot capable Triton 36,000/2, expanding the depth range of commercial submarines.
- 2022: U-Boat Worx unveiled the Nemo 2, a luxury submarine designed for private exploration.
- 2023: xx - Significant investment in R&D by a major player announced.
In-Depth Commercial Submarine Market Outlook
The commercial submarine market is poised for sustained growth, driven by continuous technological advancements, increased investment in marine research, and the expanding popularity of luxury underwater tourism. Strategic partnerships and market expansion into emerging economies present significant opportunities for industry players to capitalize on the substantial market potential, with a projected value of xx million by 2033.
Commercial Submarine Segmentation
-
1. Application
- 1.1. Tourism
- 1.2. Personal Use
- 1.3. Others
-
2. Types
- 2.1. 1-7 People
- 2.2. Above 7 People
Commercial Submarine Segmentation By Geography
-
1. North America
- 1.1. United States
- 1.2. Canada
- 1.3. Mexico
-
2. South America
- 2.1. Brazil
- 2.2. Argentina
- 2.3. Rest of South America
-
3. Europe
- 3.1. United Kingdom
- 3.2. Germany
- 3.3. France
- 3.4. Italy
- 3.5. Spain
- 3.6. Russia
- 3.7. Benelux
- 3.8. Nordics
- 3.9. Rest of Europe
-
4. Middle East & Africa
- 4.1. Turkey
- 4.2. Israel
- 4.3. GCC
- 4.4. North Africa
- 4.5. South Africa
- 4.6. Rest of Middle East & Africa
-
5. Asia Pacific
- 5.1. China
- 5.2. India
- 5.3. Japan
- 5.4. South Korea
- 5.5. ASEAN
- 5.6. Oceania
- 5.7. Rest of Asia Pacific
Commercial Submarine Regional Market Share
Geographic Coverage of Commercial Submarine
Commercial Submarine REPORT HIGHLIGHTS
| Aspects | Details |
|---|---|
| Study Period | 2020-2034 |
| Base Year | 2025 |
| Estimated Year | 2026 |
| Forecast Period | 2026-2034 |
| Historical Period | 2020-2025 |
| Growth Rate | CAGR of XX% from 2020-2034 |
| Segmentation |
|
Table of Contents
- 1. Introduction
- 1.1. Research Scope
- 1.2. Market Segmentation
- 1.3. Research Objective
- 1.4. Definitions and Assumptions
- 2. Executive Summary
- 2.1. Market Snapshot
- 3. Market Dynamics
- 3.1. Market Drivers
- 3.2. Market Restrains
- 3.3. Market Trends
- 3.4. Market Opportunities
- 4. Market Factor Analysis
- 4.1. Porters Five Forces
- 4.1.1. Bargaining Power of Suppliers
- 4.1.2. Bargaining Power of Buyers
- 4.1.3. Threat of New Entrants
- 4.1.4. Threat of Substitutes
- 4.1.5. Competitive Rivalry
- 4.2. PESTEL analysis
- 4.3. BCG Analysis
- 4.3.1. Stars (High Growth, High Market Share)
- 4.3.2. Cash Cows (Low Growth, High Market Share)
- 4.3.3. Question Mark (High Growth, Low Market Share)
- 4.3.4. Dogs (Low Growth, Low Market Share)
- 4.4. Ansoff Matrix Analysis
- 4.5. Supply Chain Analysis
- 4.6. Regulatory Landscape
- 4.7. Current Market Potential and Opportunity Assessment (TAM–SAM–SOM Framework)
- 4.8. IMR Analyst Note
- 4.1. Porters Five Forces
- 5. Market Analysis, Insights and Forecast 2021-2033
- 5.1. Market Analysis, Insights and Forecast - by Application
- 5.1.1. Tourism
- 5.1.2. Personal Use
- 5.1.3. Others
- 5.2. Market Analysis, Insights and Forecast - by Types
- 5.2.1. 1-7 People
- 5.2.2. Above 7 People
- 5.3. Market Analysis, Insights and Forecast - by Region
- 5.3.1. North America
- 5.3.2. South America
- 5.3.3. Europe
- 5.3.4. Middle East & Africa
- 5.3.5. Asia Pacific
- 5.1. Market Analysis, Insights and Forecast - by Application
- 6. Global Commercial Submarine Analysis, Insights and Forecast, 2021-2033
- 6.1. Market Analysis, Insights and Forecast - by Application
- 6.1.1. Tourism
- 6.1.2. Personal Use
- 6.1.3. Others
- 6.2. Market Analysis, Insights and Forecast - by Types
- 6.2.1. 1-7 People
- 6.2.2. Above 7 People
- 6.1. Market Analysis, Insights and Forecast - by Application
- 7. North America Commercial Submarine Analysis, Insights and Forecast, 2020-2032
- 7.1. Market Analysis, Insights and Forecast - by Application
- 7.1.1. Tourism
- 7.1.2. Personal Use
- 7.1.3. Others
- 7.2. Market Analysis, Insights and Forecast - by Types
- 7.2.1. 1-7 People
- 7.2.2. Above 7 People
- 7.1. Market Analysis, Insights and Forecast - by Application
- 8. South America Commercial Submarine Analysis, Insights and Forecast, 2020-2032
- 8.1. Market Analysis, Insights and Forecast - by Application
- 8.1.1. Tourism
- 8.1.2. Personal Use
- 8.1.3. Others
- 8.2. Market Analysis, Insights and Forecast - by Types
- 8.2.1. 1-7 People
- 8.2.2. Above 7 People
- 8.1. Market Analysis, Insights and Forecast - by Application
- 9. Europe Commercial Submarine Analysis, Insights and Forecast, 2020-2032
- 9.1. Market Analysis, Insights and Forecast - by Application
- 9.1.1. Tourism
- 9.1.2. Personal Use
- 9.1.3. Others
- 9.2. Market Analysis, Insights and Forecast - by Types
- 9.2.1. 1-7 People
- 9.2.2. Above 7 People
- 9.1. Market Analysis, Insights and Forecast - by Application
- 10. Middle East & Africa Commercial Submarine Analysis, Insights and Forecast, 2020-2032
- 10.1. Market Analysis, Insights and Forecast - by Application
- 10.1.1. Tourism
- 10.1.2. Personal Use
- 10.1.3. Others
- 10.2. Market Analysis, Insights and Forecast - by Types
- 10.2.1. 1-7 People
- 10.2.2. Above 7 People
- 10.1. Market Analysis, Insights and Forecast - by Application
- 11. Asia Pacific Commercial Submarine Analysis, Insights and Forecast, 2020-2032
- 11.1. Market Analysis, Insights and Forecast - by Application
- 11.1.1. Tourism
- 11.1.2. Personal Use
- 11.1.3. Others
- 11.2. Market Analysis, Insights and Forecast - by Types
- 11.2.1. 1-7 People
- 11.2.2. Above 7 People
- 11.1. Market Analysis, Insights and Forecast - by Application
- 12. Competitive Analysis
- 12.1. Company Profiles
- 12.1.1 Triton
- 12.1.1.1. Company Overview
- 12.1.1.2. Products
- 12.1.1.3. Company Financials
- 12.1.1.4. SWOT Analysis
- 12.1.2 U-Boat Worx
- 12.1.2.1. Company Overview
- 12.1.2.2. Products
- 12.1.2.3. Company Financials
- 12.1.2.4. SWOT Analysis
- 12.1.3 SEAmagine
- 12.1.3.1. Company Overview
- 12.1.3.2. Products
- 12.1.3.3. Company Financials
- 12.1.3.4. SWOT Analysis
- 12.1.4 Y.CO
- 12.1.4.1. Company Overview
- 12.1.4.2. Products
- 12.1.4.3. Company Financials
- 12.1.4.4. SWOT Analysis
- 12.1.5 Go Friday
- 12.1.5.1. Company Overview
- 12.1.5.2. Products
- 12.1.5.3. Company Financials
- 12.1.5.4. SWOT Analysis
- 12.1.1 Triton
- 12.2. Market Entropy
- 12.2.1 Company's Key Areas Served
- 12.2.2 Recent Developments
- 12.3. Company Market Share Analysis 2025
- 12.3.1 Top 5 Companies Market Share Analysis
- 12.3.2 Top 3 Companies Market Share Analysis
- 12.4. List of Potential Customers
- 13. Research Methodology
List of Figures
- Figure 1: Global Commercial Submarine Revenue Breakdown (million, %) by Region 2025 & 2033
- Figure 2: North America Commercial Submarine Revenue (million), by Application 2025 & 2033
- Figure 3: North America Commercial Submarine Revenue Share (%), by Application 2025 & 2033
- Figure 4: North America Commercial Submarine Revenue (million), by Types 2025 & 2033
- Figure 5: North America Commercial Submarine Revenue Share (%), by Types 2025 & 2033
- Figure 6: North America Commercial Submarine Revenue (million), by Country 2025 & 2033
- Figure 7: North America Commercial Submarine Revenue Share (%), by Country 2025 & 2033
- Figure 8: South America Commercial Submarine Revenue (million), by Application 2025 & 2033
- Figure 9: South America Commercial Submarine Revenue Share (%), by Application 2025 & 2033
- Figure 10: South America Commercial Submarine Revenue (million), by Types 2025 & 2033
- Figure 11: South America Commercial Submarine Revenue Share (%), by Types 2025 & 2033
- Figure 12: South America Commercial Submarine Revenue (million), by Country 2025 & 2033
- Figure 13: South America Commercial Submarine Revenue Share (%), by Country 2025 & 2033
- Figure 14: Europe Commercial Submarine Revenue (million), by Application 2025 & 2033
- Figure 15: Europe Commercial Submarine Revenue Share (%), by Application 2025 & 2033
- Figure 16: Europe Commercial Submarine Revenue (million), by Types 2025 & 2033
- Figure 17: Europe Commercial Submarine Revenue Share (%), by Types 2025 & 2033
- Figure 18: Europe Commercial Submarine Revenue (million), by Country 2025 & 2033
- Figure 19: Europe Commercial Submarine Revenue Share (%), by Country 2025 & 2033
- Figure 20: Middle East & Africa Commercial Submarine Revenue (million), by Application 2025 & 2033
- Figure 21: Middle East & Africa Commercial Submarine Revenue Share (%), by Application 2025 & 2033
- Figure 22: Middle East & Africa Commercial Submarine Revenue (million), by Types 2025 & 2033
- Figure 23: Middle East & Africa Commercial Submarine Revenue Share (%), by Types 2025 & 2033
- Figure 24: Middle East & Africa Commercial Submarine Revenue (million), by Country 2025 & 2033
- Figure 25: Middle East & Africa Commercial Submarine Revenue Share (%), by Country 2025 & 2033
- Figure 26: Asia Pacific Commercial Submarine Revenue (million), by Application 2025 & 2033
- Figure 27: Asia Pacific Commercial Submarine Revenue Share (%), by Application 2025 & 2033
- Figure 28: Asia Pacific Commercial Submarine Revenue (million), by Types 2025 & 2033
- Figure 29: Asia Pacific Commercial Submarine Revenue Share (%), by Types 2025 & 2033
- Figure 30: Asia Pacific Commercial Submarine Revenue (million), by Country 2025 & 2033
- Figure 31: Asia Pacific Commercial Submarine Revenue Share (%), by Country 2025 & 2033
List of Tables
- Table 1: Global Commercial Submarine Revenue million Forecast, by Application 2020 & 2033
- Table 2: Global Commercial Submarine Revenue million Forecast, by Types 2020 & 2033
- Table 3: Global Commercial Submarine Revenue million Forecast, by Region 2020 & 2033
- Table 4: Global Commercial Submarine Revenue million Forecast, by Application 2020 & 2033
- Table 5: Global Commercial Submarine Revenue million Forecast, by Types 2020 & 2033
- Table 6: Global Commercial Submarine Revenue million Forecast, by Country 2020 & 2033
- Table 7: United States Commercial Submarine Revenue (million) Forecast, by Application 2020 & 2033
- Table 8: Canada Commercial Submarine Revenue (million) Forecast, by Application 2020 & 2033
- Table 9: Mexico Commercial Submarine Revenue (million) Forecast, by Application 2020 & 2033
- Table 10: Global Commercial Submarine Revenue million Forecast, by Application 2020 & 2033
- Table 11: Global Commercial Submarine Revenue million Forecast, by Types 2020 & 2033
- Table 12: Global Commercial Submarine Revenue million Forecast, by Country 2020 & 2033
- Table 13: Brazil Commercial Submarine Revenue (million) Forecast, by Application 2020 & 2033
- Table 14: Argentina Commercial Submarine Revenue (million) Forecast, by Application 2020 & 2033
- Table 15: Rest of South America Commercial Submarine Revenue (million) Forecast, by Application 2020 & 2033
- Table 16: Global Commercial Submarine Revenue million Forecast, by Application 2020 & 2033
- Table 17: Global Commercial Submarine Revenue million Forecast, by Types 2020 & 2033
- Table 18: Global Commercial Submarine Revenue million Forecast, by Country 2020 & 2033
- Table 19: United Kingdom Commercial Submarine Revenue (million) Forecast, by Application 2020 & 2033
- Table 20: Germany Commercial Submarine Revenue (million) Forecast, by Application 2020 & 2033
- Table 21: France Commercial Submarine Revenue (million) Forecast, by Application 2020 & 2033
- Table 22: Italy Commercial Submarine Revenue (million) Forecast, by Application 2020 & 2033
- Table 23: Spain Commercial Submarine Revenue (million) Forecast, by Application 2020 & 2033
- Table 24: Russia Commercial Submarine Revenue (million) Forecast, by Application 2020 & 2033
- Table 25: Benelux Commercial Submarine Revenue (million) Forecast, by Application 2020 & 2033
- Table 26: Nordics Commercial Submarine Revenue (million) Forecast, by Application 2020 & 2033
- Table 27: Rest of Europe Commercial Submarine Revenue (million) Forecast, by Application 2020 & 2033
- Table 28: Global Commercial Submarine Revenue million Forecast, by Application 2020 & 2033
- Table 29: Global Commercial Submarine Revenue million Forecast, by Types 2020 & 2033
- Table 30: Global Commercial Submarine Revenue million Forecast, by Country 2020 & 2033
- Table 31: Turkey Commercial Submarine Revenue (million) Forecast, by Application 2020 & 2033
- Table 32: Israel Commercial Submarine Revenue (million) Forecast, by Application 2020 & 2033
- Table 33: GCC Commercial Submarine Revenue (million) Forecast, by Application 2020 & 2033
- Table 34: North Africa Commercial Submarine Revenue (million) Forecast, by Application 2020 & 2033
- Table 35: South Africa Commercial Submarine Revenue (million) Forecast, by Application 2020 & 2033
- Table 36: Rest of Middle East & Africa Commercial Submarine Revenue (million) Forecast, by Application 2020 & 2033
- Table 37: Global Commercial Submarine Revenue million Forecast, by Application 2020 & 2033
- Table 38: Global Commercial Submarine Revenue million Forecast, by Types 2020 & 2033
- Table 39: Global Commercial Submarine Revenue million Forecast, by Country 2020 & 2033
- Table 40: China Commercial Submarine Revenue (million) Forecast, by Application 2020 & 2033
- Table 41: India Commercial Submarine Revenue (million) Forecast, by Application 2020 & 2033
- Table 42: Japan Commercial Submarine Revenue (million) Forecast, by Application 2020 & 2033
- Table 43: South Korea Commercial Submarine Revenue (million) Forecast, by Application 2020 & 2033
- Table 44: ASEAN Commercial Submarine Revenue (million) Forecast, by Application 2020 & 2033
- Table 45: Oceania Commercial Submarine Revenue (million) Forecast, by Application 2020 & 2033
- Table 46: Rest of Asia Pacific Commercial Submarine Revenue (million) Forecast, by Application 2020 & 2033
Frequently Asked Questions
1. What is the projected Compound Annual Growth Rate (CAGR) of the Commercial Submarine?
The projected CAGR is approximately XX%.
2. Which companies are prominent players in the Commercial Submarine?
Key companies in the market include Triton, U-Boat Worx, SEAmagine, Y.CO, Go Friday.
3. What are the main segments of the Commercial Submarine?
The market segments include Application, Types.
4. Can you provide details about the market size?
The market size is estimated to be USD XXX million as of 2022.
5. What are some drivers contributing to market growth?
N/A
6. What are the notable trends driving market growth?
N/A
7. Are there any restraints impacting market growth?
N/A
8. Can you provide examples of recent developments in the market?
N/A
9. What pricing options are available for accessing the report?
Pricing options include single-user, multi-user, and enterprise licenses priced at USD 2900.00, USD 4350.00, and USD 5800.00 respectively.
10. Is the market size provided in terms of value or volume?
The market size is provided in terms of value, measured in million.
11. Are there any specific market keywords associated with the report?
Yes, the market keyword associated with the report is "Commercial Submarine," which aids in identifying and referencing the specific market segment covered.
12. How do I determine which pricing option suits my needs best?
The pricing options vary based on user requirements and access needs. Individual users may opt for single-user licenses, while businesses requiring broader access may choose multi-user or enterprise licenses for cost-effective access to the report.
13. Are there any additional resources or data provided in the Commercial Submarine report?
While the report offers comprehensive insights, it's advisable to review the specific contents or supplementary materials provided to ascertain if additional resources or data are available.
14. How can I stay updated on further developments or reports in the Commercial Submarine?
To stay informed about further developments, trends, and reports in the Commercial Submarine, consider subscribing to industry newsletters, following relevant companies and organizations, or regularly checking reputable industry news sources and publications.
Methodology
Step 1 - Identification of Relevant Samples Size from Population Database


Step 2 - Approaches for Defining Global Market Size (Value, Volume* & Price*)

Note*: In applicable scenarios
Step 3 - Data Sources
Primary Research
- Web Analytics
- Survey Reports
- Research Institute
- Latest Research Reports
- Opinion Leaders
Secondary Research
- Annual Reports
- White Paper
- Latest Press Release
- Industry Association
- Paid Database
- Investor Presentations

Step 4 - Data Triangulation
Involves using different sources of information in order to increase the validity of a study
These sources are likely to be stakeholders in a program - participants, other researchers, program staff, other community members, and so on.
Then we put all data in single framework & apply various statistical tools to find out the dynamic on the market.
During the analysis stage, feedback from the stakeholder groups would be compared to determine areas of agreement as well as areas of divergence