

Key Insights
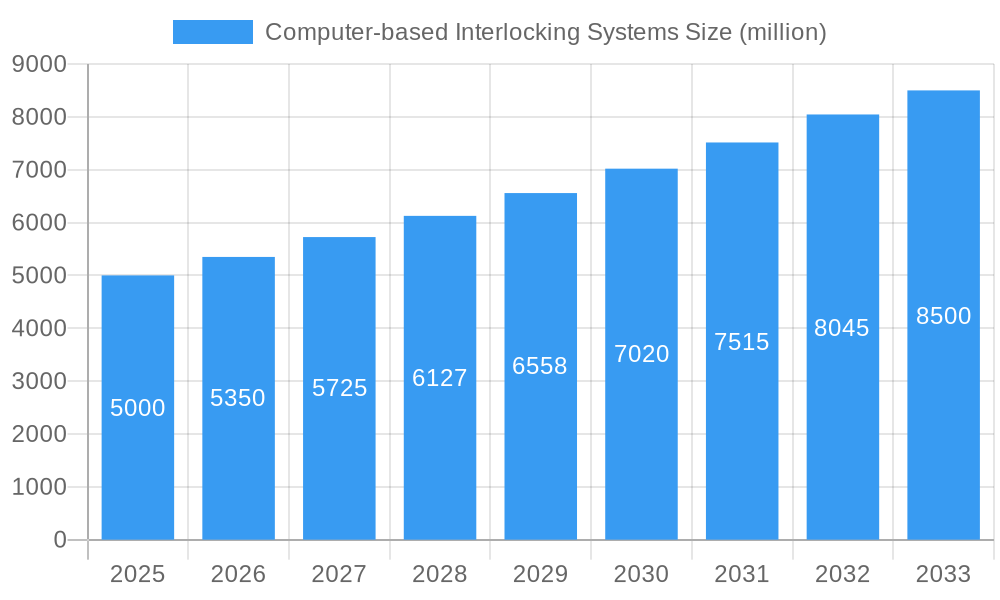
The global Computer-based Interlocking Systems (CBIS) market is poised for significant expansion, driven by the imperative for enhanced railway safety and operational efficiency. The market, valued at $2.93 billion in the base year 2025, is projected to achieve a Compound Annual Growth Rate (CAGR) of 6.4%, reaching an estimated $7.85 billion by 2033. This growth is underpinned by several pivotal factors. The global modernization of railway infrastructure, particularly the replacement of outdated electromechanical systems, is a primary catalyst. This trend is especially pronounced in emerging economies undertaking extensive infrastructure development and high-speed rail network expansion. Concurrently, the increasing emphasis on railway safety and accident reduction fuels demand for CBIS. These systems offer superior reliability and precision, minimizing human error and bolstering safety protocols. Furthermore, the integration of CBIS with advanced railway technologies, including Automatic Train Protection (ATP) and centralized traffic management systems, is instrumental in optimizing operational efficiency and increasing throughput.
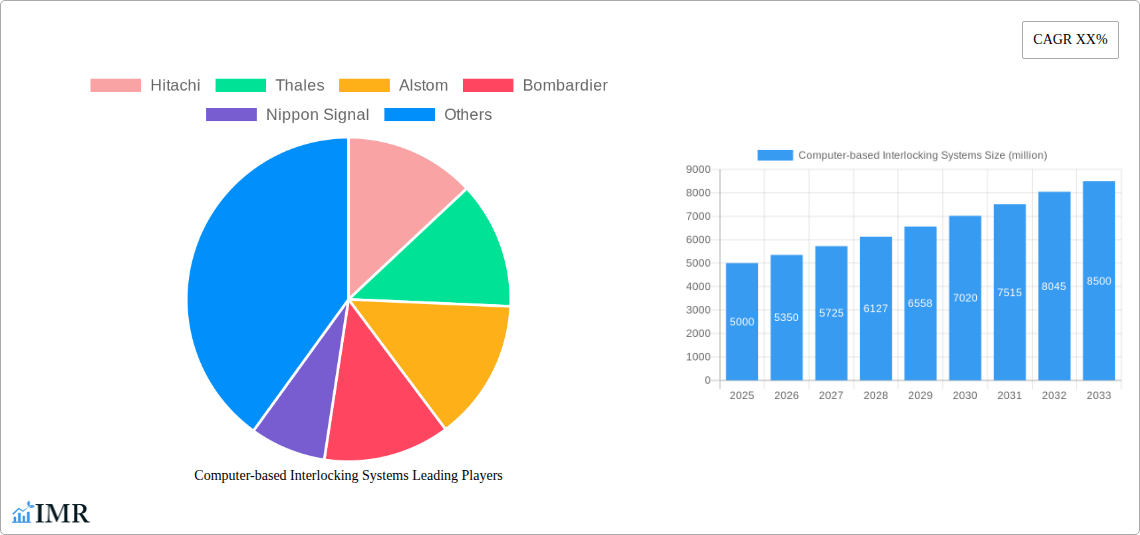
Computer-based Interlocking Systems Market Size (In Billion)
Despite this positive outlook, the market confronts challenges, notably the substantial initial investment and maintenance costs, which can be prohibitive for smaller operators. Integration complexities with existing infrastructure also present logistical hurdles. However, continuous technological advancements, leading to more cost-effective and user-friendly CBIS solutions, are progressively addressing these constraints. The market exhibits segmentation by system type, application, and region. Leading industry players such as Hitachi, Thales, Alstom, Bombardier, and Siemens are engaged in intense competition, prioritizing innovation and strategic alliances to fortify their market positions. The Asia-Pacific region is expected to lead growth due to large-scale infrastructure initiatives, while North America and Europe represent mature markets with sustained expansion.
Computer-based Interlocking Systems Company Market Share
Computer-based Interlocking Systems Market Report: 2019-2033
This comprehensive report provides an in-depth analysis of the global Computer-based Interlocking Systems market, offering invaluable insights for industry professionals, investors, and strategic decision-makers. The report covers the period 2019-2033, with a focus on the forecast period 2025-2033, using 2025 as the base year. The market is segmented by various factors, providing a granular understanding of its dynamics and growth potential. The total market size is projected to reach xx million units by 2033.
Computer-based Interlocking Systems Market Dynamics & Structure
This section delves into the intricate structure of the Computer-based Interlocking Systems market, examining market concentration, technological advancements, regulatory landscapes, and competitive dynamics within the parent market of Railway Signaling Systems and the child market of Railway Automation.
Market Concentration & Competition: The market exhibits a moderately concentrated structure, with key players like Hitachi, Thales, Alstom, and Siemens holding significant market share. The estimated market concentration ratio (CR4) for 2025 is xx%. However, emerging players are increasingly challenging the established players, leading to a more dynamic competitive landscape.
Technological Innovation: Continuous innovation in areas like software-defined networking, artificial intelligence (AI), and cloud computing is driving market growth. These advancements are enhancing system efficiency, reliability, and safety.
- AI-powered predictive maintenance: Reducing downtime and operational costs.
- Integration with IoT technologies: Enabling real-time monitoring and control.
- Cybersecurity enhancements: Addressing the growing threat of cyberattacks.
Regulatory Frameworks: Stringent safety regulations and interoperability standards are shaping market development. Compliance with international standards like EN 50128 and IEC 62271 is crucial for market access. Changes in these regulations directly impact the adoption and technological innovations within the market.
Competitive Product Substitutes: While Computer-based Interlocking Systems are the prevalent technology, the emergence of alternative solutions like advanced communication-based train control (CBTC) systems presents competitive pressure. The relative advantages and disadvantages of these technologies are fully examined in the report.
End-User Demographics: The primary end-users are national and regional railway operators, transit agencies, and infrastructure developers. Growing investments in railway infrastructure, particularly in developing economies, are fueling market expansion.
M&A Trends: The past five years have witnessed a moderate number of mergers and acquisitions (M&A) in this sector. For instance, xx M&A deals were recorded between 2019 and 2024, primarily driven by consolidation efforts and expansion strategies.
Computer-based Interlocking Systems Growth Trends & Insights
The Computer-based Interlocking Systems market is experiencing robust growth, driven by increasing railway modernization initiatives and investments in high-speed rail networks globally. The market size witnessed significant expansion during the historical period (2019-2024) and is projected to maintain a healthy Compound Annual Growth Rate (CAGR) of xx% during the forecast period (2025-2033).
The adoption rate of Computer-based Interlocking Systems is increasing steadily, particularly in regions with well-developed rail infrastructure and strong government support for railway modernization. Technological disruptions, like the integration of AI and IoT, are further accelerating adoption. Shifts in consumer behavior, particularly favoring enhanced safety and operational efficiency, are also playing a significant role in driving market growth. This segment of the report provides a deep dive into the factors influencing market penetration and growth trajectory, supported by detailed quantitative data.
Dominant Regions, Countries, or Segments in Computer-based Interlocking Systems
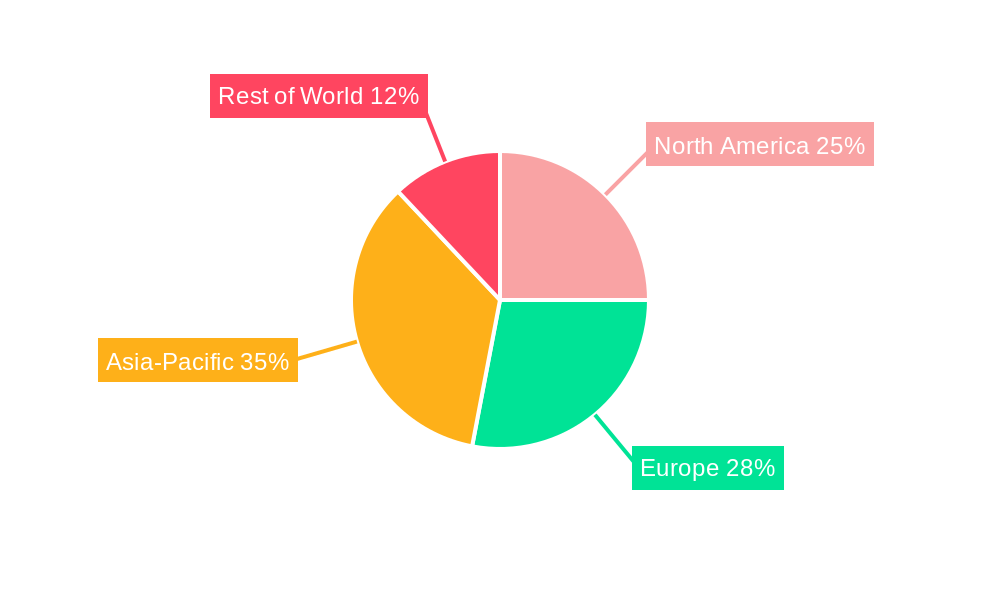
The Asia-Pacific region is expected to dominate the Computer-based Interlocking Systems market during the forecast period. This is primarily due to substantial investments in railway infrastructure development and modernization across countries like China, India, and Japan.
- High-speed rail projects: Driving significant demand for advanced interlocking systems.
- Government initiatives: Promoting railway modernization and technological upgrades.
- Expanding urban transit networks: Fueling the need for efficient traffic management solutions.
Europe and North America also represent significant market segments, driven by upgrades to existing infrastructure and investments in high-speed rail lines. However, the Asia-Pacific region's rapid infrastructure expansion gives it a leading edge in terms of market share and future growth potential. The report provides a detailed regional breakdown, analyzing market dynamics and growth drivers in each region.
Computer-based Interlocking Systems Product Landscape
Computer-based interlocking systems encompass a range of products, including electronic interlocking systems, solid-state interlocking systems, and route relay interlocking systems. These systems offer improved safety, reliability, and efficiency compared to conventional mechanical systems. Recent innovations focus on enhancing system interoperability, scalability, and cybersecurity features, along with reducing installation and maintenance costs. These advancements provide significant competitive advantages, and the report details each aspect.
Key Drivers, Barriers & Challenges in Computer-based Interlocking Systems
Key Drivers:
- Growing demand for improved railway safety and efficiency.
- Increased investments in railway infrastructure modernization.
- Technological advancements, such as AI and IoT integration.
- Government regulations promoting the adoption of advanced rail technologies.
Key Challenges:
- High initial investment costs associated with system implementation.
- Complexity of system integration and interoperability.
- Concerns regarding cybersecurity vulnerabilities.
- Shortage of skilled professionals for system maintenance and operation. This is estimated to impact market growth by xx% by 2033.
Emerging Opportunities in Computer-based Interlocking Systems
Emerging opportunities exist in areas such as:
- Expanding applications in light rail and metro systems.
- Integration with advanced train control systems (e.g., CBTC).
- Development of predictive maintenance solutions leveraging AI and machine learning.
- Growth in developing economies with expanding railway networks.
Growth Accelerators in the Computer-based Interlocking Systems Industry
Long-term growth will be fueled by strategic partnerships between technology providers and railway operators, fostering innovation and faster deployment of advanced solutions. Furthermore, advancements in communication technologies and the broader adoption of digitalization within the railway sector will further accelerate market expansion.
Key Players Shaping the Computer-based Interlocking Systems Market
- Hitachi
- Thales
- Alstom
- Bombardier
- Nippon Signal
- CRSC
- Traffic Control Technology
- Siemens
- Kyosan
- Glarun Technology
- Unittec
- Mermec
Notable Milestones in Computer-based Interlocking Systems Sector
- 2020: Introduction of AI-powered predictive maintenance solutions by Thales.
- 2022: Siemens launches a new generation of electronic interlocking systems with enhanced cybersecurity features.
- 2023: Alstom and Hitachi form a strategic partnership to develop next-generation interlocking solutions for high-speed rail.
In-Depth Computer-based Interlocking Systems Market Outlook
The future of the Computer-based Interlocking Systems market looks promising, with continued growth driven by technological innovation and increasing investments in railway infrastructure globally. Strategic partnerships, the adoption of advanced technologies, and expansion into untapped markets will significantly contribute to long-term market expansion and the creation of significant opportunities for market players. The overall market outlook is positive, indicating a substantial growth potential in the coming years.
Computer-based Interlocking Systems Segmentation
-
1. Application
- 1.1. Urban Rail
- 1.2. Mainline
-
2. Types
- 2.1. Hardware
- 2.2. Software
Computer-based Interlocking Systems Segmentation By Geography
-
1. North America
- 1.1. United States
- 1.2. Canada
- 1.3. Mexico
-
2. South America
- 2.1. Brazil
- 2.2. Argentina
- 2.3. Rest of South America
-
3. Europe
- 3.1. United Kingdom
- 3.2. Germany
- 3.3. France
- 3.4. Italy
- 3.5. Spain
- 3.6. Russia
- 3.7. Benelux
- 3.8. Nordics
- 3.9. Rest of Europe
-
4. Middle East & Africa
- 4.1. Turkey
- 4.2. Israel
- 4.3. GCC
- 4.4. North Africa
- 4.5. South Africa
- 4.6. Rest of Middle East & Africa
-
5. Asia Pacific
- 5.1. China
- 5.2. India
- 5.3. Japan
- 5.4. South Korea
- 5.5. ASEAN
- 5.6. Oceania
- 5.7. Rest of Asia Pacific
Computer-based Interlocking Systems Regional Market Share
Geographic Coverage of Computer-based Interlocking Systems
Computer-based Interlocking Systems REPORT HIGHLIGHTS
| Aspects | Details |
|---|---|
| Study Period | 2020-2034 |
| Base Year | 2025 |
| Estimated Year | 2026 |
| Forecast Period | 2026-2034 |
| Historical Period | 2020-2025 |
| Growth Rate | CAGR of 6.4% from 2020-2034 |
| Segmentation |
|
Table of Contents
- 1. Introduction
- 1.1. Research Scope
- 1.2. Market Segmentation
- 1.3. Research Objective
- 1.4. Definitions and Assumptions
- 2. Executive Summary
- 2.1. Market Snapshot
- 3. Market Dynamics
- 3.1. Market Drivers
- 3.2. Market Restrains
- 3.3. Market Trends
- 3.4. Market Opportunities
- 4. Market Factor Analysis
- 4.1. Porters Five Forces
- 4.1.1. Bargaining Power of Suppliers
- 4.1.2. Bargaining Power of Buyers
- 4.1.3. Threat of New Entrants
- 4.1.4. Threat of Substitutes
- 4.1.5. Competitive Rivalry
- 4.2. PESTEL analysis
- 4.3. BCG Analysis
- 4.3.1. Stars (High Growth, High Market Share)
- 4.3.2. Cash Cows (Low Growth, High Market Share)
- 4.3.3. Question Mark (High Growth, Low Market Share)
- 4.3.4. Dogs (Low Growth, Low Market Share)
- 4.4. Ansoff Matrix Analysis
- 4.5. Supply Chain Analysis
- 4.6. Regulatory Landscape
- 4.7. Current Market Potential and Opportunity Assessment (TAM–SAM–SOM Framework)
- 4.8. IMR Analyst Note
- 4.1. Porters Five Forces
- 5. Market Analysis, Insights and Forecast 2021-2033
- 5.1. Market Analysis, Insights and Forecast - by Application
- 5.1.1. Urban Rail
- 5.1.2. Mainline
- 5.2. Market Analysis, Insights and Forecast - by Types
- 5.2.1. Hardware
- 5.2.2. Software
- 5.3. Market Analysis, Insights and Forecast - by Region
- 5.3.1. North America
- 5.3.2. South America
- 5.3.3. Europe
- 5.3.4. Middle East & Africa
- 5.3.5. Asia Pacific
- 5.1. Market Analysis, Insights and Forecast - by Application
- 6. Global Computer-based Interlocking Systems Analysis, Insights and Forecast, 2021-2033
- 6.1. Market Analysis, Insights and Forecast - by Application
- 6.1.1. Urban Rail
- 6.1.2. Mainline
- 6.2. Market Analysis, Insights and Forecast - by Types
- 6.2.1. Hardware
- 6.2.2. Software
- 6.1. Market Analysis, Insights and Forecast - by Application
- 7. North America Computer-based Interlocking Systems Analysis, Insights and Forecast, 2020-2032
- 7.1. Market Analysis, Insights and Forecast - by Application
- 7.1.1. Urban Rail
- 7.1.2. Mainline
- 7.2. Market Analysis, Insights and Forecast - by Types
- 7.2.1. Hardware
- 7.2.2. Software
- 7.1. Market Analysis, Insights and Forecast - by Application
- 8. South America Computer-based Interlocking Systems Analysis, Insights and Forecast, 2020-2032
- 8.1. Market Analysis, Insights and Forecast - by Application
- 8.1.1. Urban Rail
- 8.1.2. Mainline
- 8.2. Market Analysis, Insights and Forecast - by Types
- 8.2.1. Hardware
- 8.2.2. Software
- 8.1. Market Analysis, Insights and Forecast - by Application
- 9. Europe Computer-based Interlocking Systems Analysis, Insights and Forecast, 2020-2032
- 9.1. Market Analysis, Insights and Forecast - by Application
- 9.1.1. Urban Rail
- 9.1.2. Mainline
- 9.2. Market Analysis, Insights and Forecast - by Types
- 9.2.1. Hardware
- 9.2.2. Software
- 9.1. Market Analysis, Insights and Forecast - by Application
- 10. Middle East & Africa Computer-based Interlocking Systems Analysis, Insights and Forecast, 2020-2032
- 10.1. Market Analysis, Insights and Forecast - by Application
- 10.1.1. Urban Rail
- 10.1.2. Mainline
- 10.2. Market Analysis, Insights and Forecast - by Types
- 10.2.1. Hardware
- 10.2.2. Software
- 10.1. Market Analysis, Insights and Forecast - by Application
- 11. Asia Pacific Computer-based Interlocking Systems Analysis, Insights and Forecast, 2020-2032
- 11.1. Market Analysis, Insights and Forecast - by Application
- 11.1.1. Urban Rail
- 11.1.2. Mainline
- 11.2. Market Analysis, Insights and Forecast - by Types
- 11.2.1. Hardware
- 11.2.2. Software
- 11.1. Market Analysis, Insights and Forecast - by Application
- 12. Competitive Analysis
- 12.1. Company Profiles
- 12.1.1 Hitachi
- 12.1.1.1. Company Overview
- 12.1.1.2. Products
- 12.1.1.3. Company Financials
- 12.1.1.4. SWOT Analysis
- 12.1.2 Thales
- 12.1.2.1. Company Overview
- 12.1.2.2. Products
- 12.1.2.3. Company Financials
- 12.1.2.4. SWOT Analysis
- 12.1.3 Alstom
- 12.1.3.1. Company Overview
- 12.1.3.2. Products
- 12.1.3.3. Company Financials
- 12.1.3.4. SWOT Analysis
- 12.1.4 Bombardier
- 12.1.4.1. Company Overview
- 12.1.4.2. Products
- 12.1.4.3. Company Financials
- 12.1.4.4. SWOT Analysis
- 12.1.5 Nippon Signal
- 12.1.5.1. Company Overview
- 12.1.5.2. Products
- 12.1.5.3. Company Financials
- 12.1.5.4. SWOT Analysis
- 12.1.6 CRSC
- 12.1.6.1. Company Overview
- 12.1.6.2. Products
- 12.1.6.3. Company Financials
- 12.1.6.4. SWOT Analysis
- 12.1.7 Traffic Control Technology
- 12.1.7.1. Company Overview
- 12.1.7.2. Products
- 12.1.7.3. Company Financials
- 12.1.7.4. SWOT Analysis
- 12.1.8 Siemens
- 12.1.8.1. Company Overview
- 12.1.8.2. Products
- 12.1.8.3. Company Financials
- 12.1.8.4. SWOT Analysis
- 12.1.9 Kyosan
- 12.1.9.1. Company Overview
- 12.1.9.2. Products
- 12.1.9.3. Company Financials
- 12.1.9.4. SWOT Analysis
- 12.1.10 Glarun Technology
- 12.1.10.1. Company Overview
- 12.1.10.2. Products
- 12.1.10.3. Company Financials
- 12.1.10.4. SWOT Analysis
- 12.1.11 Unittec
- 12.1.11.1. Company Overview
- 12.1.11.2. Products
- 12.1.11.3. Company Financials
- 12.1.11.4. SWOT Analysis
- 12.1.12 Mermec
- 12.1.12.1. Company Overview
- 12.1.12.2. Products
- 12.1.12.3. Company Financials
- 12.1.12.4. SWOT Analysis
- 12.1.1 Hitachi
- 12.2. Market Entropy
- 12.2.1 Company's Key Areas Served
- 12.2.2 Recent Developments
- 12.3. Company Market Share Analysis 2025
- 12.3.1 Top 5 Companies Market Share Analysis
- 12.3.2 Top 3 Companies Market Share Analysis
- 12.4. List of Potential Customers
- 13. Research Methodology
List of Figures
- Figure 1: Global Computer-based Interlocking Systems Revenue Breakdown (billion, %) by Region 2025 & 2033
- Figure 2: North America Computer-based Interlocking Systems Revenue (billion), by Application 2025 & 2033
- Figure 3: North America Computer-based Interlocking Systems Revenue Share (%), by Application 2025 & 2033
- Figure 4: North America Computer-based Interlocking Systems Revenue (billion), by Types 2025 & 2033
- Figure 5: North America Computer-based Interlocking Systems Revenue Share (%), by Types 2025 & 2033
- Figure 6: North America Computer-based Interlocking Systems Revenue (billion), by Country 2025 & 2033
- Figure 7: North America Computer-based Interlocking Systems Revenue Share (%), by Country 2025 & 2033
- Figure 8: South America Computer-based Interlocking Systems Revenue (billion), by Application 2025 & 2033
- Figure 9: South America Computer-based Interlocking Systems Revenue Share (%), by Application 2025 & 2033
- Figure 10: South America Computer-based Interlocking Systems Revenue (billion), by Types 2025 & 2033
- Figure 11: South America Computer-based Interlocking Systems Revenue Share (%), by Types 2025 & 2033
- Figure 12: South America Computer-based Interlocking Systems Revenue (billion), by Country 2025 & 2033
- Figure 13: South America Computer-based Interlocking Systems Revenue Share (%), by Country 2025 & 2033
- Figure 14: Europe Computer-based Interlocking Systems Revenue (billion), by Application 2025 & 2033
- Figure 15: Europe Computer-based Interlocking Systems Revenue Share (%), by Application 2025 & 2033
- Figure 16: Europe Computer-based Interlocking Systems Revenue (billion), by Types 2025 & 2033
- Figure 17: Europe Computer-based Interlocking Systems Revenue Share (%), by Types 2025 & 2033
- Figure 18: Europe Computer-based Interlocking Systems Revenue (billion), by Country 2025 & 2033
- Figure 19: Europe Computer-based Interlocking Systems Revenue Share (%), by Country 2025 & 2033
- Figure 20: Middle East & Africa Computer-based Interlocking Systems Revenue (billion), by Application 2025 & 2033
- Figure 21: Middle East & Africa Computer-based Interlocking Systems Revenue Share (%), by Application 2025 & 2033
- Figure 22: Middle East & Africa Computer-based Interlocking Systems Revenue (billion), by Types 2025 & 2033
- Figure 23: Middle East & Africa Computer-based Interlocking Systems Revenue Share (%), by Types 2025 & 2033
- Figure 24: Middle East & Africa Computer-based Interlocking Systems Revenue (billion), by Country 2025 & 2033
- Figure 25: Middle East & Africa Computer-based Interlocking Systems Revenue Share (%), by Country 2025 & 2033
- Figure 26: Asia Pacific Computer-based Interlocking Systems Revenue (billion), by Application 2025 & 2033
- Figure 27: Asia Pacific Computer-based Interlocking Systems Revenue Share (%), by Application 2025 & 2033
- Figure 28: Asia Pacific Computer-based Interlocking Systems Revenue (billion), by Types 2025 & 2033
- Figure 29: Asia Pacific Computer-based Interlocking Systems Revenue Share (%), by Types 2025 & 2033
- Figure 30: Asia Pacific Computer-based Interlocking Systems Revenue (billion), by Country 2025 & 2033
- Figure 31: Asia Pacific Computer-based Interlocking Systems Revenue Share (%), by Country 2025 & 2033
List of Tables
- Table 1: Global Computer-based Interlocking Systems Revenue billion Forecast, by Application 2020 & 2033
- Table 2: Global Computer-based Interlocking Systems Revenue billion Forecast, by Types 2020 & 2033
- Table 3: Global Computer-based Interlocking Systems Revenue billion Forecast, by Region 2020 & 2033
- Table 4: Global Computer-based Interlocking Systems Revenue billion Forecast, by Application 2020 & 2033
- Table 5: Global Computer-based Interlocking Systems Revenue billion Forecast, by Types 2020 & 2033
- Table 6: Global Computer-based Interlocking Systems Revenue billion Forecast, by Country 2020 & 2033
- Table 7: United States Computer-based Interlocking Systems Revenue (billion) Forecast, by Application 2020 & 2033
- Table 8: Canada Computer-based Interlocking Systems Revenue (billion) Forecast, by Application 2020 & 2033
- Table 9: Mexico Computer-based Interlocking Systems Revenue (billion) Forecast, by Application 2020 & 2033
- Table 10: Global Computer-based Interlocking Systems Revenue billion Forecast, by Application 2020 & 2033
- Table 11: Global Computer-based Interlocking Systems Revenue billion Forecast, by Types 2020 & 2033
- Table 12: Global Computer-based Interlocking Systems Revenue billion Forecast, by Country 2020 & 2033
- Table 13: Brazil Computer-based Interlocking Systems Revenue (billion) Forecast, by Application 2020 & 2033
- Table 14: Argentina Computer-based Interlocking Systems Revenue (billion) Forecast, by Application 2020 & 2033
- Table 15: Rest of South America Computer-based Interlocking Systems Revenue (billion) Forecast, by Application 2020 & 2033
- Table 16: Global Computer-based Interlocking Systems Revenue billion Forecast, by Application 2020 & 2033
- Table 17: Global Computer-based Interlocking Systems Revenue billion Forecast, by Types 2020 & 2033
- Table 18: Global Computer-based Interlocking Systems Revenue billion Forecast, by Country 2020 & 2033
- Table 19: United Kingdom Computer-based Interlocking Systems Revenue (billion) Forecast, by Application 2020 & 2033
- Table 20: Germany Computer-based Interlocking Systems Revenue (billion) Forecast, by Application 2020 & 2033
- Table 21: France Computer-based Interlocking Systems Revenue (billion) Forecast, by Application 2020 & 2033
- Table 22: Italy Computer-based Interlocking Systems Revenue (billion) Forecast, by Application 2020 & 2033
- Table 23: Spain Computer-based Interlocking Systems Revenue (billion) Forecast, by Application 2020 & 2033
- Table 24: Russia Computer-based Interlocking Systems Revenue (billion) Forecast, by Application 2020 & 2033
- Table 25: Benelux Computer-based Interlocking Systems Revenue (billion) Forecast, by Application 2020 & 2033
- Table 26: Nordics Computer-based Interlocking Systems Revenue (billion) Forecast, by Application 2020 & 2033
- Table 27: Rest of Europe Computer-based Interlocking Systems Revenue (billion) Forecast, by Application 2020 & 2033
- Table 28: Global Computer-based Interlocking Systems Revenue billion Forecast, by Application 2020 & 2033
- Table 29: Global Computer-based Interlocking Systems Revenue billion Forecast, by Types 2020 & 2033
- Table 30: Global Computer-based Interlocking Systems Revenue billion Forecast, by Country 2020 & 2033
- Table 31: Turkey Computer-based Interlocking Systems Revenue (billion) Forecast, by Application 2020 & 2033
- Table 32: Israel Computer-based Interlocking Systems Revenue (billion) Forecast, by Application 2020 & 2033
- Table 33: GCC Computer-based Interlocking Systems Revenue (billion) Forecast, by Application 2020 & 2033
- Table 34: North Africa Computer-based Interlocking Systems Revenue (billion) Forecast, by Application 2020 & 2033
- Table 35: South Africa Computer-based Interlocking Systems Revenue (billion) Forecast, by Application 2020 & 2033
- Table 36: Rest of Middle East & Africa Computer-based Interlocking Systems Revenue (billion) Forecast, by Application 2020 & 2033
- Table 37: Global Computer-based Interlocking Systems Revenue billion Forecast, by Application 2020 & 2033
- Table 38: Global Computer-based Interlocking Systems Revenue billion Forecast, by Types 2020 & 2033
- Table 39: Global Computer-based Interlocking Systems Revenue billion Forecast, by Country 2020 & 2033
- Table 40: China Computer-based Interlocking Systems Revenue (billion) Forecast, by Application 2020 & 2033
- Table 41: India Computer-based Interlocking Systems Revenue (billion) Forecast, by Application 2020 & 2033
- Table 42: Japan Computer-based Interlocking Systems Revenue (billion) Forecast, by Application 2020 & 2033
- Table 43: South Korea Computer-based Interlocking Systems Revenue (billion) Forecast, by Application 2020 & 2033
- Table 44: ASEAN Computer-based Interlocking Systems Revenue (billion) Forecast, by Application 2020 & 2033
- Table 45: Oceania Computer-based Interlocking Systems Revenue (billion) Forecast, by Application 2020 & 2033
- Table 46: Rest of Asia Pacific Computer-based Interlocking Systems Revenue (billion) Forecast, by Application 2020 & 2033
Frequently Asked Questions
1. What is the projected Compound Annual Growth Rate (CAGR) of the Computer-based Interlocking Systems?
The projected CAGR is approximately 6.4%.
2. Which companies are prominent players in the Computer-based Interlocking Systems?
Key companies in the market include Hitachi, Thales, Alstom, Bombardier, Nippon Signal, CRSC, Traffic Control Technology, Siemens, Kyosan, Glarun Technology, Unittec, Mermec.
3. What are the main segments of the Computer-based Interlocking Systems?
The market segments include Application, Types.
4. Can you provide details about the market size?
The market size is estimated to be USD 2.93 billion as of 2022.
5. What are some drivers contributing to market growth?
N/A
6. What are the notable trends driving market growth?
N/A
7. Are there any restraints impacting market growth?
N/A
8. Can you provide examples of recent developments in the market?
N/A
9. What pricing options are available for accessing the report?
Pricing options include single-user, multi-user, and enterprise licenses priced at USD 2900.00, USD 4350.00, and USD 5800.00 respectively.
10. Is the market size provided in terms of value or volume?
The market size is provided in terms of value, measured in billion.
11. Are there any specific market keywords associated with the report?
Yes, the market keyword associated with the report is "Computer-based Interlocking Systems," which aids in identifying and referencing the specific market segment covered.
12. How do I determine which pricing option suits my needs best?
The pricing options vary based on user requirements and access needs. Individual users may opt for single-user licenses, while businesses requiring broader access may choose multi-user or enterprise licenses for cost-effective access to the report.
13. Are there any additional resources or data provided in the Computer-based Interlocking Systems report?
While the report offers comprehensive insights, it's advisable to review the specific contents or supplementary materials provided to ascertain if additional resources or data are available.
14. How can I stay updated on further developments or reports in the Computer-based Interlocking Systems?
To stay informed about further developments, trends, and reports in the Computer-based Interlocking Systems, consider subscribing to industry newsletters, following relevant companies and organizations, or regularly checking reputable industry news sources and publications.
Methodology
Step 1 - Identification of Relevant Samples Size from Population Database


Step 2 - Approaches for Defining Global Market Size (Value, Volume* & Price*)

Note*: In applicable scenarios
Step 3 - Data Sources
Primary Research
- Web Analytics
- Survey Reports
- Research Institute
- Latest Research Reports
- Opinion Leaders
Secondary Research
- Annual Reports
- White Paper
- Latest Press Release
- Industry Association
- Paid Database
- Investor Presentations

Step 4 - Data Triangulation
Involves using different sources of information in order to increase the validity of a study
These sources are likely to be stakeholders in a program - participants, other researchers, program staff, other community members, and so on.
Then we put all data in single framework & apply various statistical tools to find out the dynamic on the market.
During the analysis stage, feedback from the stakeholder groups would be compared to determine areas of agreement as well as areas of divergence