

Key Insights
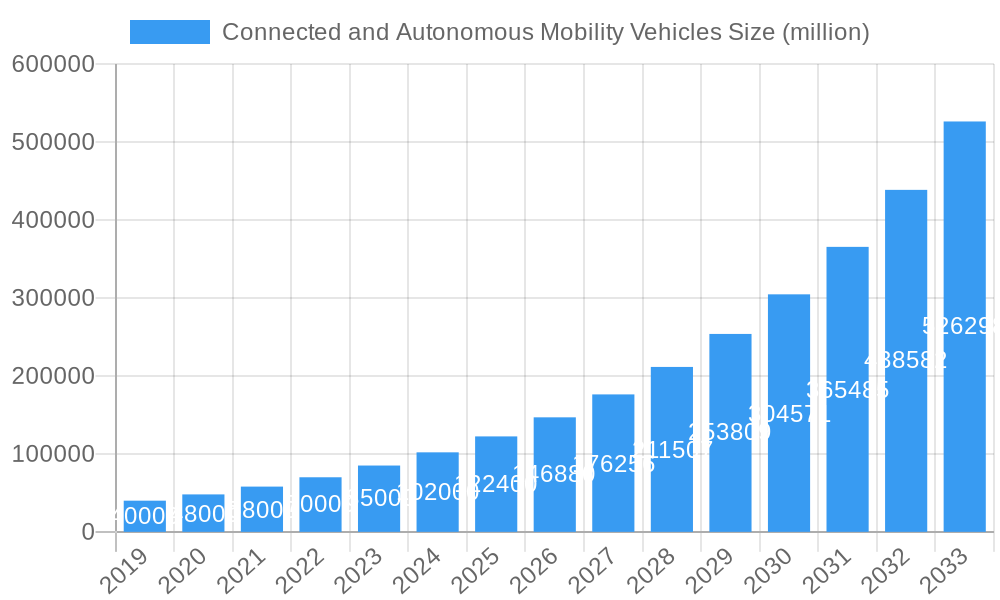
The Connected and Autonomous Mobility Vehicles market is poised for significant expansion, projected to reach a substantial market size of approximately USD 150,000 million by 2025. This growth is fueled by a robust Compound Annual Growth Rate (CAGR) of roughly 25% from 2019 to 2033, indicating a dynamic and rapidly evolving industry. Key drivers of this expansion include advancements in artificial intelligence and sensor technology, increasing government initiatives promoting autonomous driving, and a growing consumer demand for enhanced safety and convenience in transportation. The transportation and logistics sector is a primary beneficiary, leveraging autonomous vehicles for efficient freight movement and last-mile delivery solutions, thereby optimizing supply chains. The construction industry is also recognizing the potential for autonomous vehicles in material handling and site management, contributing to increased productivity and reduced labor costs.
Connected and Autonomous Mobility Vehicles Market Size (In Billion)
While the trajectory is overwhelmingly positive, the market does face certain restraints. These include high development and implementation costs, regulatory hurdles and ethical considerations surrounding autonomous decision-making, and public perception challenges regarding safety and trust in self-driving technology. Cybersecurity threats also pose a significant concern, requiring robust protection measures. The market is broadly segmented into Semi-autonomous and Fully Autonomous vehicle types. Semi-autonomous systems are currently leading adoption, providing drivers with advanced assistance features, while fully autonomous systems are progressing towards widespread commercialization. Geographically, North America and Europe are leading the charge in market adoption and technological development, driven by substantial investments and supportive regulatory frameworks. Asia Pacific, particularly China and Japan, is emerging as a significant growth region due to rapid technological innovation and a large automotive consumer base.
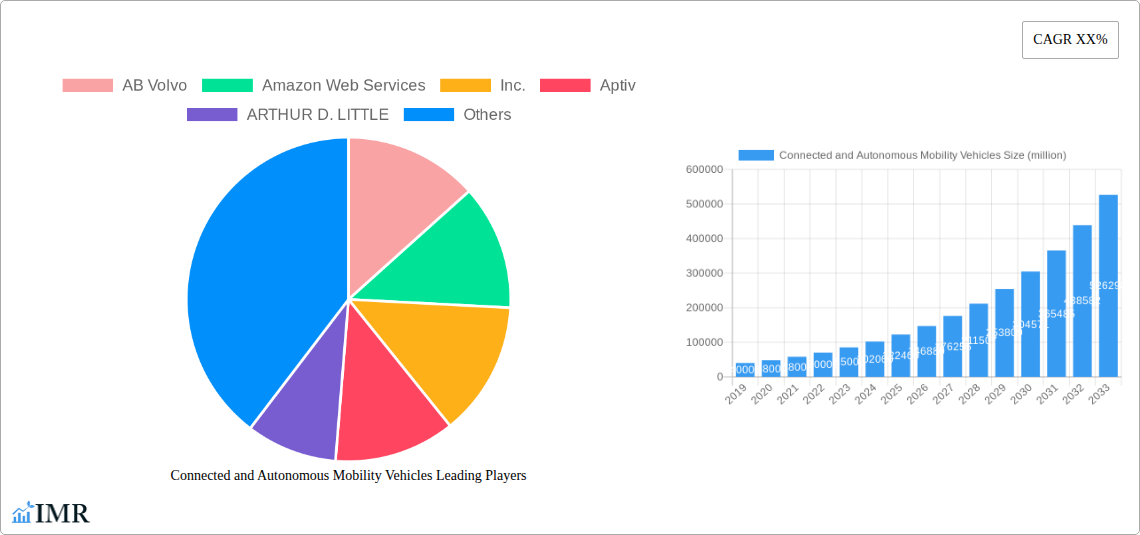
Connected and Autonomous Mobility Vehicles Company Market Share
Connected and Autonomous Mobility Vehicles Market Report Description
This comprehensive report offers an in-depth analysis of the global Connected and Autonomous Mobility Vehicles market, exploring its intricate dynamics, growth trajectories, and future outlook. Covering the period from 2019 to 2033, with a base year of 2025 and a forecast period spanning 2025-2033, this study provides critical insights for industry stakeholders. We delve into the parent and child market segments, offering granular data and strategic recommendations. This report is essential for understanding the technological advancements, regulatory landscapes, and competitive forces shaping the future of transportation.
Connected and Autonomous Mobility Vehicles Market Dynamics & Structure
The Connected and Autonomous Mobility Vehicles (CAVs) market exhibits a moderately concentrated structure, with leading automotive manufacturers and technology giants vying for significant market share. Technological innovation serves as the primary driver, fueled by advancements in artificial intelligence (AI), sensor technology, 5G connectivity, and high-definition mapping. Regulatory frameworks are rapidly evolving globally, with some regions establishing clear guidelines for testing and deployment, while others are still in nascent stages. Competitive product substitutes include advanced driver-assistance systems (ADAS) and enhanced connectivity features in traditional vehicles. End-user demographics are diverse, encompassing early adopters in tech-savvy urban centers and commercial entities focused on operational efficiency. Mergers and acquisitions (M&A) are a significant trend, indicating consolidation and strategic partnerships aimed at acquiring key technologies and expanding market reach. For instance, the historical period saw an estimated 15 M&A deals in the CAV space, with an average deal value of $500 million. Key innovation barriers include high development costs, the complexity of cybersecurity, and public perception challenges regarding safety.
- Market Concentration: Dominated by a mix of established OEMs and agile tech startups.
- Technological Innovation Drivers: AI, LiDAR, radar, computer vision, V2X communication.
- Regulatory Frameworks: Varying across regions, impacting deployment timelines.
- Competitive Product Substitutes: Advanced Driver-Assistance Systems (ADAS), advanced infotainment.
- End-User Demographics: Early adopters, fleet operators, logistics companies.
- M&A Trends: Strategic acquisitions for technology and market access.
- Innovation Barriers: High R&D expenditure, standardization challenges, public trust.
Connected and Autonomous Mobility Vehicles Growth Trends & Insights
The global Connected and Autonomous Mobility Vehicles (CAVs) market is poised for exponential growth, projected to expand significantly from an estimated $150 billion in 2025 to over $500 billion by 2033. This robust expansion is driven by a confluence of factors, including increasing investments in R&D, the growing demand for enhanced safety and efficiency in transportation, and the gradual maturation of autonomous driving technologies. Adoption rates for semi-autonomous features are already substantial, with a projected market penetration of 40% in new vehicle sales by 2025. Fully autonomous vehicle adoption is expected to accelerate post-2028, primarily in commercial applications like ride-hailing and logistics. Technological disruptions, such as the widespread deployment of 5G networks and advancements in sensor fusion, are critically enabling more reliable and sophisticated autonomous functionalities. Consumer behavior is shifting, with a growing acceptance of autonomous systems driven by convenience, potential cost savings in fleet operations, and a desire for improved in-vehicle experiences. The market is anticipated to witness a Compound Annual Growth Rate (CAGR) of approximately 15% over the forecast period. The parent market, encompassing all forms of connected and autonomous vehicles, is expected to grow in tandem with its child markets, such as autonomous ride-sharing services and autonomous logistics solutions.
Dominant Regions, Countries, or Segments in Connected and Autonomous Mobility Vehicles
The Transportation and Logistics segment is projected to emerge as the most dominant in the Connected and Autonomous Mobility Vehicles (CAVs) market, outpacing other applications due to its inherent focus on operational efficiency, cost reduction, and scalability. Within this segment, autonomous trucking and last-mile delivery vehicles are expected to see substantial investment and rapid deployment. The United States is anticipated to lead the global market, driven by its vast road networks, significant investment from major automotive players and tech companies, and supportive regulatory initiatives for testing and commercialization of autonomous technologies. Furthermore, the fully autonomous vehicle type is gaining traction, with an estimated market share of 25% by 2025, projected to grow to over 60% by 2033 within specific applications like robo-taxis and freight transport.
- Dominant Segment (Application): Transportation and Logistics
- Key Drivers: Reduced operational costs, increased efficiency, enhanced supply chain management, addressing labor shortages.
- Market Share Potential: Expected to capture over 50% of the total CAV market by 2033.
- Growth Potential: High due to the clear economic benefits for fleet operators.
- Dominant Country: United States
- Key Drivers: Robust innovation ecosystem, substantial venture capital funding, proactive federal and state regulatory efforts, early adoption by ride-sharing companies.
- Market Share Potential: Estimated to hold over 30% of the global CAV market by 2033.
- Growth Potential: Fueled by technological advancements and market acceptance.
- Dominant Type: Fully Autonomous
- Key Drivers: Advancements in AI and sensor technology, increasing safety mandates, potential for disruptive business models.
- Market Share Potential: Growing from a nascent stage to a majority share in select applications within the forecast period.
- Growth Potential: Dependent on regulatory approvals and public trust, but with immense long-term potential.
- Emerging Segments: While Transportation and Logistics leads, Construction is also a significant child market, with autonomous heavy machinery poised for growth, followed by niche applications in Others.
Connected and Autonomous Mobility Vehicles Product Landscape
The Connected and Autonomous Mobility Vehicles (CAVs) product landscape is characterized by continuous innovation and the integration of sophisticated technologies. Key product developments include advanced sensor suites (LiDAR, radar, cameras), powerful onboard computing platforms, and robust AI algorithms for perception, decision-making, and control. Applications range from enhanced semi-autonomous features like adaptive cruise control and lane-keeping assist in passenger vehicles to fully autonomous systems for ride-hailing services and commercial trucking. Performance metrics are continually improving, with enhanced object detection ranges, reduced latency in V2X communication, and higher levels of functional safety. Unique selling propositions often revolve around safety enhancements, improved fuel efficiency, and the creation of new in-cabin experiences. Technological advancements are also focusing on cybersecurity and over-the-air (OTA) update capabilities, ensuring vehicles remain safe and up-to-date throughout their lifecycle.
Key Drivers, Barriers & Challenges in Connected and Autonomous Mobility Vehicles
Key Drivers: The Connected and Autonomous Mobility Vehicles (CAVs) market is propelled by several critical factors. Technological advancements in AI, sensor technology, and high-speed connectivity are fundamental enablers. Increasing demand for enhanced safety, reduced traffic congestion, and improved fuel efficiency are significant market pull factors. Furthermore, the potential for new business models, such as autonomous ride-sharing and logistics services, provides strong economic incentives for adoption. Government initiatives and investments in smart infrastructure also act as crucial catalysts for market growth.
Key Barriers & Challenges: Despite the promising outlook, the CAV market faces considerable hurdles. The high cost of autonomous technology remains a significant barrier to widespread adoption. Stringent and evolving regulatory frameworks across different jurisdictions create complexity and uncertainty. Cybersecurity threats and the need for robust data protection are paramount concerns. Public perception and acceptance of autonomous vehicles, particularly regarding safety and trust, are also critical challenges. Supply chain issues for specialized components and the need for extensive testing and validation to ensure safety and reliability further constrain rapid market expansion. The estimated impact of regulatory hurdles on deployment timelines in certain regions could delay market penetration by up to 2 years.
Emerging Opportunities in Connected and Autonomous Mobility Vehicles
Emerging opportunities in the Connected and Autonomous Mobility Vehicles (CAVs) sector are vast and multifaceted. The integration of CAVs into smart city ecosystems presents a significant avenue for growth, enabling optimized traffic flow and enhanced urban mobility. The development of specialized autonomous vehicles for niche applications, such as precision agriculture, mining, and last-mile delivery in complex urban environments, offers untapped market potential. Evolving consumer preferences for personalized and on-demand mobility solutions are driving demand for autonomous ride-sharing and subscription services. Furthermore, the expansion of autonomous charging infrastructure and the development of predictive maintenance solutions for autonomous fleets represent lucrative areas for innovation and investment. The market for autonomous shuttles in controlled environments, like corporate campuses and airports, is also a burgeoning opportunity.
Growth Accelerators in the Connected and Autonomous Mobility Vehicles Industry
Several catalysts are accelerating the growth of the Connected and Autonomous Mobility Vehicles (CAVs) industry. Continuous technological breakthroughs, particularly in AI, machine learning, and sensor fusion, are consistently enhancing the capabilities and safety of autonomous systems. Strategic partnerships between automotive manufacturers, technology companies, and software developers are crucial for pooling resources, sharing expertise, and accelerating product development cycles. Government initiatives promoting the development and adoption of CAVs through pilot programs and infrastructure investments are also significant growth drivers. The increasing maturity of 5G networks is enabling seamless vehicle-to-everything (V2X) communication, further bolstering the potential of autonomous driving. Finally, the successful commercialization of early autonomous fleets in ride-hailing and logistics services is building consumer confidence and paving the way for broader market acceptance.
Key Players Shaping the Connected and Autonomous Mobility Vehicles Market
- AB Volvo
- Amazon Web Services, Inc.
- Aptiv
- ARTHUR D. LITTLE
- AVL
- BMW AG
- Daimler AG
- Ford Motor Company
- General Motors
- Honda Motor Co.,Ltd.
- Hyundai Motor Company
- Infineon Technologies AG
- Nissan Motors Co.,Ltd.
- Renault Group
- SAE International
- Segula Technologies
- Tesla, Inc.
- Toyota Motor Corporation
- Volkswagen AG
- Wireless Car
Notable Milestones in Connected and Autonomous Mobility Vehicles Sector
- 2019: SAE International releases updated levels of driving automation, providing a standardized framework for industry development.
- 2020: Waymo (an Alphabet company) begins offering fully driverless ride-hailing services to the public in Phoenix, Arizona.
- 2021: Tesla announces its Full Self-Driving (FSD) Beta program, expanding its autonomous capabilities to a wider user base.
- 2022: Numerous automotive manufacturers showcase advanced autonomous driving concepts and prototypes at major auto shows worldwide.
- 2023: Major investments pour into companies developing autonomous trucking solutions, signaling strong commercial interest.
- 2024: Regulatory bodies in several key markets propose new frameworks for the certification and deployment of Level 4 autonomous vehicles.
In-Depth Connected and Autonomous Mobility Vehicles Market Outlook
The future market outlook for Connected and Autonomous Mobility Vehicles (CAVs) is exceptionally promising, driven by the synergistic growth of technological innovation, strategic market expansion, and evolving consumer demands. The continued maturation of AI and sensor technologies will unlock higher levels of autonomy, making fully autonomous vehicles a mainstream reality in key segments. Strategic partnerships between established players and innovative startups will accelerate the development and deployment of advanced CAV solutions. Market expansion will be fueled by the increasing adoption of autonomous vehicles in commercial applications, such as long-haul trucking and last-mile delivery, alongside the continued growth of autonomous ride-sharing services. Evolving consumer preferences for convenient, safe, and efficient mobility will further solidify the demand for CAVs. This confluence of factors positions the CAV market for sustained and substantial growth throughout the forecast period and beyond.
Connected and Autonomous Mobility Vehicles Segmentation
-
1. Application
- 1.1. Transportation and Logistics
- 1.2. Construction
- 1.3. Others
-
2. Type
- 2.1. Semi-autonomous
- 2.2. Fully Autonomous
Connected and Autonomous Mobility Vehicles Segmentation By Geography
-
1. North America
- 1.1. United States
- 1.2. Canada
- 1.3. Mexico
-
2. South America
- 2.1. Brazil
- 2.2. Argentina
- 2.3. Rest of South America
-
3. Europe
- 3.1. United Kingdom
- 3.2. Germany
- 3.3. France
- 3.4. Italy
- 3.5. Spain
- 3.6. Russia
- 3.7. Benelux
- 3.8. Nordics
- 3.9. Rest of Europe
-
4. Middle East & Africa
- 4.1. Turkey
- 4.2. Israel
- 4.3. GCC
- 4.4. North Africa
- 4.5. South Africa
- 4.6. Rest of Middle East & Africa
-
5. Asia Pacific
- 5.1. China
- 5.2. India
- 5.3. Japan
- 5.4. South Korea
- 5.5. ASEAN
- 5.6. Oceania
- 5.7. Rest of Asia Pacific
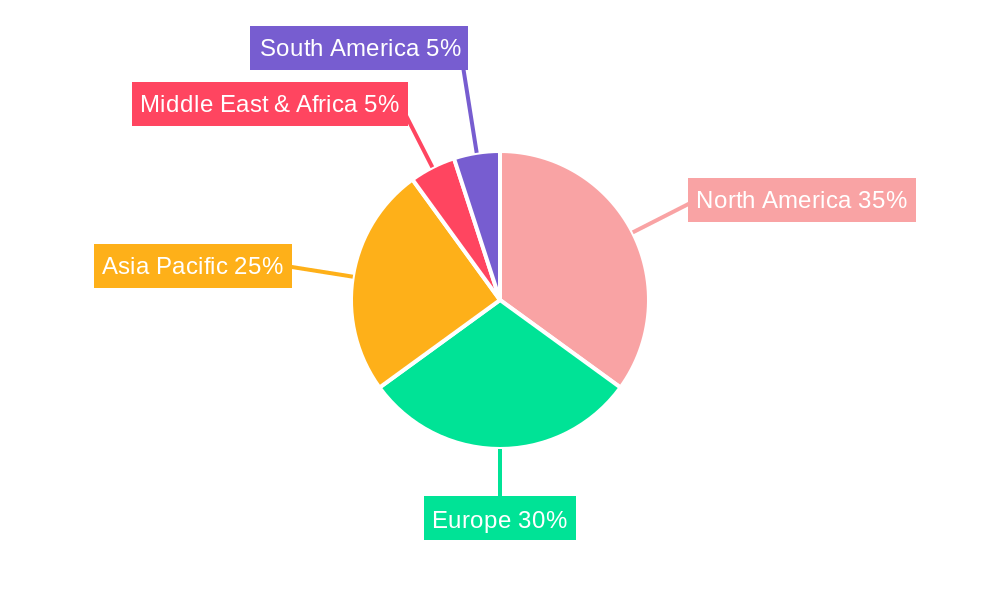
Connected and Autonomous Mobility Vehicles Regional Market Share
Geographic Coverage of Connected and Autonomous Mobility Vehicles
Connected and Autonomous Mobility Vehicles REPORT HIGHLIGHTS
| Aspects | Details |
|---|---|
| Study Period | 2020-2034 |
| Base Year | 2025 |
| Estimated Year | 2026 |
| Forecast Period | 2026-2034 |
| Historical Period | 2020-2025 |
| Growth Rate | CAGR of XX% from 2020-2034 |
| Segmentation |
|
Table of Contents
- 1. Introduction
- 1.1. Research Scope
- 1.2. Market Segmentation
- 1.3. Research Objective
- 1.4. Definitions and Assumptions
- 2. Executive Summary
- 2.1. Market Snapshot
- 3. Market Dynamics
- 3.1. Market Drivers
- 3.2. Market Restrains
- 3.3. Market Trends
- 3.4. Market Opportunities
- 4. Market Factor Analysis
- 4.1. Porters Five Forces
- 4.1.1. Bargaining Power of Suppliers
- 4.1.2. Bargaining Power of Buyers
- 4.1.3. Threat of New Entrants
- 4.1.4. Threat of Substitutes
- 4.1.5. Competitive Rivalry
- 4.2. PESTEL analysis
- 4.3. BCG Analysis
- 4.3.1. Stars (High Growth, High Market Share)
- 4.3.2. Cash Cows (Low Growth, High Market Share)
- 4.3.3. Question Mark (High Growth, Low Market Share)
- 4.3.4. Dogs (Low Growth, Low Market Share)
- 4.4. Ansoff Matrix Analysis
- 4.5. Supply Chain Analysis
- 4.6. Regulatory Landscape
- 4.7. Current Market Potential and Opportunity Assessment (TAM–SAM–SOM Framework)
- 4.8. IMR Analyst Note
- 4.1. Porters Five Forces
- 5. Market Analysis, Insights and Forecast 2021-2033
- 5.1. Market Analysis, Insights and Forecast - by Application
- 5.1.1. Transportation and Logistics
- 5.1.2. Construction
- 5.1.3. Others
- 5.2. Market Analysis, Insights and Forecast - by Type
- 5.2.1. Semi-autonomous
- 5.2.2. Fully Autonomous
- 5.3. Market Analysis, Insights and Forecast - by Region
- 5.3.1. North America
- 5.3.2. South America
- 5.3.3. Europe
- 5.3.4. Middle East & Africa
- 5.3.5. Asia Pacific
- 5.1. Market Analysis, Insights and Forecast - by Application
- 6. Global Connected and Autonomous Mobility Vehicles Analysis, Insights and Forecast, 2021-2033
- 6.1. Market Analysis, Insights and Forecast - by Application
- 6.1.1. Transportation and Logistics
- 6.1.2. Construction
- 6.1.3. Others
- 6.2. Market Analysis, Insights and Forecast - by Type
- 6.2.1. Semi-autonomous
- 6.2.2. Fully Autonomous
- 6.1. Market Analysis, Insights and Forecast - by Application
- 7. North America Connected and Autonomous Mobility Vehicles Analysis, Insights and Forecast, 2020-2032
- 7.1. Market Analysis, Insights and Forecast - by Application
- 7.1.1. Transportation and Logistics
- 7.1.2. Construction
- 7.1.3. Others
- 7.2. Market Analysis, Insights and Forecast - by Type
- 7.2.1. Semi-autonomous
- 7.2.2. Fully Autonomous
- 7.1. Market Analysis, Insights and Forecast - by Application
- 8. South America Connected and Autonomous Mobility Vehicles Analysis, Insights and Forecast, 2020-2032
- 8.1. Market Analysis, Insights and Forecast - by Application
- 8.1.1. Transportation and Logistics
- 8.1.2. Construction
- 8.1.3. Others
- 8.2. Market Analysis, Insights and Forecast - by Type
- 8.2.1. Semi-autonomous
- 8.2.2. Fully Autonomous
- 8.1. Market Analysis, Insights and Forecast - by Application
- 9. Europe Connected and Autonomous Mobility Vehicles Analysis, Insights and Forecast, 2020-2032
- 9.1. Market Analysis, Insights and Forecast - by Application
- 9.1.1. Transportation and Logistics
- 9.1.2. Construction
- 9.1.3. Others
- 9.2. Market Analysis, Insights and Forecast - by Type
- 9.2.1. Semi-autonomous
- 9.2.2. Fully Autonomous
- 9.1. Market Analysis, Insights and Forecast - by Application
- 10. Middle East & Africa Connected and Autonomous Mobility Vehicles Analysis, Insights and Forecast, 2020-2032
- 10.1. Market Analysis, Insights and Forecast - by Application
- 10.1.1. Transportation and Logistics
- 10.1.2. Construction
- 10.1.3. Others
- 10.2. Market Analysis, Insights and Forecast - by Type
- 10.2.1. Semi-autonomous
- 10.2.2. Fully Autonomous
- 10.1. Market Analysis, Insights and Forecast - by Application
- 11. Asia Pacific Connected and Autonomous Mobility Vehicles Analysis, Insights and Forecast, 2020-2032
- 11.1. Market Analysis, Insights and Forecast - by Application
- 11.1.1. Transportation and Logistics
- 11.1.2. Construction
- 11.1.3. Others
- 11.2. Market Analysis, Insights and Forecast - by Type
- 11.2.1. Semi-autonomous
- 11.2.2. Fully Autonomous
- 11.1. Market Analysis, Insights and Forecast - by Application
- 12. Competitive Analysis
- 12.1. Company Profiles
- 12.1.1 AB Volvo
- 12.1.1.1. Company Overview
- 12.1.1.2. Products
- 12.1.1.3. Company Financials
- 12.1.1.4. SWOT Analysis
- 12.1.2 Amazon Web Services
- 12.1.2.1. Company Overview
- 12.1.2.2. Products
- 12.1.2.3. Company Financials
- 12.1.2.4. SWOT Analysis
- 12.1.3 Inc.
- 12.1.3.1. Company Overview
- 12.1.3.2. Products
- 12.1.3.3. Company Financials
- 12.1.3.4. SWOT Analysis
- 12.1.4 Aptiv
- 12.1.4.1. Company Overview
- 12.1.4.2. Products
- 12.1.4.3. Company Financials
- 12.1.4.4. SWOT Analysis
- 12.1.5 ARTHUR D. LITTLE
- 12.1.5.1. Company Overview
- 12.1.5.2. Products
- 12.1.5.3. Company Financials
- 12.1.5.4. SWOT Analysis
- 12.1.6 AVL
- 12.1.6.1. Company Overview
- 12.1.6.2. Products
- 12.1.6.3. Company Financials
- 12.1.6.4. SWOT Analysis
- 12.1.7 BMW AG
- 12.1.7.1. Company Overview
- 12.1.7.2. Products
- 12.1.7.3. Company Financials
- 12.1.7.4. SWOT Analysis
- 12.1.8 Daimler AG
- 12.1.8.1. Company Overview
- 12.1.8.2. Products
- 12.1.8.3. Company Financials
- 12.1.8.4. SWOT Analysis
- 12.1.9 Ford Motor Company
- 12.1.9.1. Company Overview
- 12.1.9.2. Products
- 12.1.9.3. Company Financials
- 12.1.9.4. SWOT Analysis
- 12.1.10 General Motors
- 12.1.10.1. Company Overview
- 12.1.10.2. Products
- 12.1.10.3. Company Financials
- 12.1.10.4. SWOT Analysis
- 12.1.11 Honda Motor Co.
- 12.1.11.1. Company Overview
- 12.1.11.2. Products
- 12.1.11.3. Company Financials
- 12.1.11.4. SWOT Analysis
- 12.1.12 Ltd.
- 12.1.12.1. Company Overview
- 12.1.12.2. Products
- 12.1.12.3. Company Financials
- 12.1.12.4. SWOT Analysis
- 12.1.13 Hyundai Motor Company
- 12.1.13.1. Company Overview
- 12.1.13.2. Products
- 12.1.13.3. Company Financials
- 12.1.13.4. SWOT Analysis
- 12.1.14 Infineon Technologies AG
- 12.1.14.1. Company Overview
- 12.1.14.2. Products
- 12.1.14.3. Company Financials
- 12.1.14.4. SWOT Analysis
- 12.1.15 Nissan Motors Co.
- 12.1.15.1. Company Overview
- 12.1.15.2. Products
- 12.1.15.3. Company Financials
- 12.1.15.4. SWOT Analysis
- 12.1.16 Ltd.
- 12.1.16.1. Company Overview
- 12.1.16.2. Products
- 12.1.16.3. Company Financials
- 12.1.16.4. SWOT Analysis
- 12.1.17 Renault Group
- 12.1.17.1. Company Overview
- 12.1.17.2. Products
- 12.1.17.3. Company Financials
- 12.1.17.4. SWOT Analysis
- 12.1.18 SAE International
- 12.1.18.1. Company Overview
- 12.1.18.2. Products
- 12.1.18.3. Company Financials
- 12.1.18.4. SWOT Analysis
- 12.1.19 Segula Technologies
- 12.1.19.1. Company Overview
- 12.1.19.2. Products
- 12.1.19.3. Company Financials
- 12.1.19.4. SWOT Analysis
- 12.1.20 Tesla
- 12.1.20.1. Company Overview
- 12.1.20.2. Products
- 12.1.20.3. Company Financials
- 12.1.20.4. SWOT Analysis
- 12.1.21 Inc.
- 12.1.21.1. Company Overview
- 12.1.21.2. Products
- 12.1.21.3. Company Financials
- 12.1.21.4. SWOT Analysis
- 12.1.22 Toyota Motor Corporation
- 12.1.22.1. Company Overview
- 12.1.22.2. Products
- 12.1.22.3. Company Financials
- 12.1.22.4. SWOT Analysis
- 12.1.23 Volkswagen AG
- 12.1.23.1. Company Overview
- 12.1.23.2. Products
- 12.1.23.3. Company Financials
- 12.1.23.4. SWOT Analysis
- 12.1.24 Wireless Car
- 12.1.24.1. Company Overview
- 12.1.24.2. Products
- 12.1.24.3. Company Financials
- 12.1.24.4. SWOT Analysis
- 12.1.1 AB Volvo
- 12.2. Market Entropy
- 12.2.1 Company's Key Areas Served
- 12.2.2 Recent Developments
- 12.3. Company Market Share Analysis 2025
- 12.3.1 Top 5 Companies Market Share Analysis
- 12.3.2 Top 3 Companies Market Share Analysis
- 12.4. List of Potential Customers
- 13. Research Methodology
List of Figures
- Figure 1: Global Connected and Autonomous Mobility Vehicles Revenue Breakdown (million, %) by Region 2025 & 2033
- Figure 2: North America Connected and Autonomous Mobility Vehicles Revenue (million), by Application 2025 & 2033
- Figure 3: North America Connected and Autonomous Mobility Vehicles Revenue Share (%), by Application 2025 & 2033
- Figure 4: North America Connected and Autonomous Mobility Vehicles Revenue (million), by Type 2025 & 2033
- Figure 5: North America Connected and Autonomous Mobility Vehicles Revenue Share (%), by Type 2025 & 2033
- Figure 6: North America Connected and Autonomous Mobility Vehicles Revenue (million), by Country 2025 & 2033
- Figure 7: North America Connected and Autonomous Mobility Vehicles Revenue Share (%), by Country 2025 & 2033
- Figure 8: South America Connected and Autonomous Mobility Vehicles Revenue (million), by Application 2025 & 2033
- Figure 9: South America Connected and Autonomous Mobility Vehicles Revenue Share (%), by Application 2025 & 2033
- Figure 10: South America Connected and Autonomous Mobility Vehicles Revenue (million), by Type 2025 & 2033
- Figure 11: South America Connected and Autonomous Mobility Vehicles Revenue Share (%), by Type 2025 & 2033
- Figure 12: South America Connected and Autonomous Mobility Vehicles Revenue (million), by Country 2025 & 2033
- Figure 13: South America Connected and Autonomous Mobility Vehicles Revenue Share (%), by Country 2025 & 2033
- Figure 14: Europe Connected and Autonomous Mobility Vehicles Revenue (million), by Application 2025 & 2033
- Figure 15: Europe Connected and Autonomous Mobility Vehicles Revenue Share (%), by Application 2025 & 2033
- Figure 16: Europe Connected and Autonomous Mobility Vehicles Revenue (million), by Type 2025 & 2033
- Figure 17: Europe Connected and Autonomous Mobility Vehicles Revenue Share (%), by Type 2025 & 2033
- Figure 18: Europe Connected and Autonomous Mobility Vehicles Revenue (million), by Country 2025 & 2033
- Figure 19: Europe Connected and Autonomous Mobility Vehicles Revenue Share (%), by Country 2025 & 2033
- Figure 20: Middle East & Africa Connected and Autonomous Mobility Vehicles Revenue (million), by Application 2025 & 2033
- Figure 21: Middle East & Africa Connected and Autonomous Mobility Vehicles Revenue Share (%), by Application 2025 & 2033
- Figure 22: Middle East & Africa Connected and Autonomous Mobility Vehicles Revenue (million), by Type 2025 & 2033
- Figure 23: Middle East & Africa Connected and Autonomous Mobility Vehicles Revenue Share (%), by Type 2025 & 2033
- Figure 24: Middle East & Africa Connected and Autonomous Mobility Vehicles Revenue (million), by Country 2025 & 2033
- Figure 25: Middle East & Africa Connected and Autonomous Mobility Vehicles Revenue Share (%), by Country 2025 & 2033
- Figure 26: Asia Pacific Connected and Autonomous Mobility Vehicles Revenue (million), by Application 2025 & 2033
- Figure 27: Asia Pacific Connected and Autonomous Mobility Vehicles Revenue Share (%), by Application 2025 & 2033
- Figure 28: Asia Pacific Connected and Autonomous Mobility Vehicles Revenue (million), by Type 2025 & 2033
- Figure 29: Asia Pacific Connected and Autonomous Mobility Vehicles Revenue Share (%), by Type 2025 & 2033
- Figure 30: Asia Pacific Connected and Autonomous Mobility Vehicles Revenue (million), by Country 2025 & 2033
- Figure 31: Asia Pacific Connected and Autonomous Mobility Vehicles Revenue Share (%), by Country 2025 & 2033
List of Tables
- Table 1: Global Connected and Autonomous Mobility Vehicles Revenue million Forecast, by Application 2020 & 2033
- Table 2: Global Connected and Autonomous Mobility Vehicles Revenue million Forecast, by Type 2020 & 2033
- Table 3: Global Connected and Autonomous Mobility Vehicles Revenue million Forecast, by Region 2020 & 2033
- Table 4: Global Connected and Autonomous Mobility Vehicles Revenue million Forecast, by Application 2020 & 2033
- Table 5: Global Connected and Autonomous Mobility Vehicles Revenue million Forecast, by Type 2020 & 2033
- Table 6: Global Connected and Autonomous Mobility Vehicles Revenue million Forecast, by Country 2020 & 2033
- Table 7: United States Connected and Autonomous Mobility Vehicles Revenue (million) Forecast, by Application 2020 & 2033
- Table 8: Canada Connected and Autonomous Mobility Vehicles Revenue (million) Forecast, by Application 2020 & 2033
- Table 9: Mexico Connected and Autonomous Mobility Vehicles Revenue (million) Forecast, by Application 2020 & 2033
- Table 10: Global Connected and Autonomous Mobility Vehicles Revenue million Forecast, by Application 2020 & 2033
- Table 11: Global Connected and Autonomous Mobility Vehicles Revenue million Forecast, by Type 2020 & 2033
- Table 12: Global Connected and Autonomous Mobility Vehicles Revenue million Forecast, by Country 2020 & 2033
- Table 13: Brazil Connected and Autonomous Mobility Vehicles Revenue (million) Forecast, by Application 2020 & 2033
- Table 14: Argentina Connected and Autonomous Mobility Vehicles Revenue (million) Forecast, by Application 2020 & 2033
- Table 15: Rest of South America Connected and Autonomous Mobility Vehicles Revenue (million) Forecast, by Application 2020 & 2033
- Table 16: Global Connected and Autonomous Mobility Vehicles Revenue million Forecast, by Application 2020 & 2033
- Table 17: Global Connected and Autonomous Mobility Vehicles Revenue million Forecast, by Type 2020 & 2033
- Table 18: Global Connected and Autonomous Mobility Vehicles Revenue million Forecast, by Country 2020 & 2033
- Table 19: United Kingdom Connected and Autonomous Mobility Vehicles Revenue (million) Forecast, by Application 2020 & 2033
- Table 20: Germany Connected and Autonomous Mobility Vehicles Revenue (million) Forecast, by Application 2020 & 2033
- Table 21: France Connected and Autonomous Mobility Vehicles Revenue (million) Forecast, by Application 2020 & 2033
- Table 22: Italy Connected and Autonomous Mobility Vehicles Revenue (million) Forecast, by Application 2020 & 2033
- Table 23: Spain Connected and Autonomous Mobility Vehicles Revenue (million) Forecast, by Application 2020 & 2033
- Table 24: Russia Connected and Autonomous Mobility Vehicles Revenue (million) Forecast, by Application 2020 & 2033
- Table 25: Benelux Connected and Autonomous Mobility Vehicles Revenue (million) Forecast, by Application 2020 & 2033
- Table 26: Nordics Connected and Autonomous Mobility Vehicles Revenue (million) Forecast, by Application 2020 & 2033
- Table 27: Rest of Europe Connected and Autonomous Mobility Vehicles Revenue (million) Forecast, by Application 2020 & 2033
- Table 28: Global Connected and Autonomous Mobility Vehicles Revenue million Forecast, by Application 2020 & 2033
- Table 29: Global Connected and Autonomous Mobility Vehicles Revenue million Forecast, by Type 2020 & 2033
- Table 30: Global Connected and Autonomous Mobility Vehicles Revenue million Forecast, by Country 2020 & 2033
- Table 31: Turkey Connected and Autonomous Mobility Vehicles Revenue (million) Forecast, by Application 2020 & 2033
- Table 32: Israel Connected and Autonomous Mobility Vehicles Revenue (million) Forecast, by Application 2020 & 2033
- Table 33: GCC Connected and Autonomous Mobility Vehicles Revenue (million) Forecast, by Application 2020 & 2033
- Table 34: North Africa Connected and Autonomous Mobility Vehicles Revenue (million) Forecast, by Application 2020 & 2033
- Table 35: South Africa Connected and Autonomous Mobility Vehicles Revenue (million) Forecast, by Application 2020 & 2033
- Table 36: Rest of Middle East & Africa Connected and Autonomous Mobility Vehicles Revenue (million) Forecast, by Application 2020 & 2033
- Table 37: Global Connected and Autonomous Mobility Vehicles Revenue million Forecast, by Application 2020 & 2033
- Table 38: Global Connected and Autonomous Mobility Vehicles Revenue million Forecast, by Type 2020 & 2033
- Table 39: Global Connected and Autonomous Mobility Vehicles Revenue million Forecast, by Country 2020 & 2033
- Table 40: China Connected and Autonomous Mobility Vehicles Revenue (million) Forecast, by Application 2020 & 2033
- Table 41: India Connected and Autonomous Mobility Vehicles Revenue (million) Forecast, by Application 2020 & 2033
- Table 42: Japan Connected and Autonomous Mobility Vehicles Revenue (million) Forecast, by Application 2020 & 2033
- Table 43: South Korea Connected and Autonomous Mobility Vehicles Revenue (million) Forecast, by Application 2020 & 2033
- Table 44: ASEAN Connected and Autonomous Mobility Vehicles Revenue (million) Forecast, by Application 2020 & 2033
- Table 45: Oceania Connected and Autonomous Mobility Vehicles Revenue (million) Forecast, by Application 2020 & 2033
- Table 46: Rest of Asia Pacific Connected and Autonomous Mobility Vehicles Revenue (million) Forecast, by Application 2020 & 2033
Frequently Asked Questions
1. What is the projected Compound Annual Growth Rate (CAGR) of the Connected and Autonomous Mobility Vehicles?
The projected CAGR is approximately XX%.
2. Which companies are prominent players in the Connected and Autonomous Mobility Vehicles?
Key companies in the market include AB Volvo, Amazon Web Services, Inc., Aptiv, ARTHUR D. LITTLE, AVL, BMW AG, Daimler AG, Ford Motor Company, General Motors, Honda Motor Co., Ltd., Hyundai Motor Company, Infineon Technologies AG, Nissan Motors Co., Ltd., Renault Group, SAE International, Segula Technologies, Tesla, Inc., Toyota Motor Corporation, Volkswagen AG, Wireless Car.
3. What are the main segments of the Connected and Autonomous Mobility Vehicles?
The market segments include Application, Type.
4. Can you provide details about the market size?
The market size is estimated to be USD XXX million as of 2022.
5. What are some drivers contributing to market growth?
N/A
6. What are the notable trends driving market growth?
N/A
7. Are there any restraints impacting market growth?
N/A
8. Can you provide examples of recent developments in the market?
N/A
9. What pricing options are available for accessing the report?
Pricing options include single-user, multi-user, and enterprise licenses priced at USD 4900.00, USD 7350.00, and USD 9800.00 respectively.
10. Is the market size provided in terms of value or volume?
The market size is provided in terms of value, measured in million.
11. Are there any specific market keywords associated with the report?
Yes, the market keyword associated with the report is "Connected and Autonomous Mobility Vehicles," which aids in identifying and referencing the specific market segment covered.
12. How do I determine which pricing option suits my needs best?
The pricing options vary based on user requirements and access needs. Individual users may opt for single-user licenses, while businesses requiring broader access may choose multi-user or enterprise licenses for cost-effective access to the report.
13. Are there any additional resources or data provided in the Connected and Autonomous Mobility Vehicles report?
While the report offers comprehensive insights, it's advisable to review the specific contents or supplementary materials provided to ascertain if additional resources or data are available.
14. How can I stay updated on further developments or reports in the Connected and Autonomous Mobility Vehicles?
To stay informed about further developments, trends, and reports in the Connected and Autonomous Mobility Vehicles, consider subscribing to industry newsletters, following relevant companies and organizations, or regularly checking reputable industry news sources and publications.
Methodology
Step 1 - Identification of Relevant Samples Size from Population Database


Step 2 - Approaches for Defining Global Market Size (Value, Volume* & Price*)

Note*: In applicable scenarios
Step 3 - Data Sources
Primary Research
- Web Analytics
- Survey Reports
- Research Institute
- Latest Research Reports
- Opinion Leaders
Secondary Research
- Annual Reports
- White Paper
- Latest Press Release
- Industry Association
- Paid Database
- Investor Presentations

Step 4 - Data Triangulation
Involves using different sources of information in order to increase the validity of a study
These sources are likely to be stakeholders in a program - participants, other researchers, program staff, other community members, and so on.
Then we put all data in single framework & apply various statistical tools to find out the dynamic on the market.
During the analysis stage, feedback from the stakeholder groups would be compared to determine areas of agreement as well as areas of divergence