

Key Insights
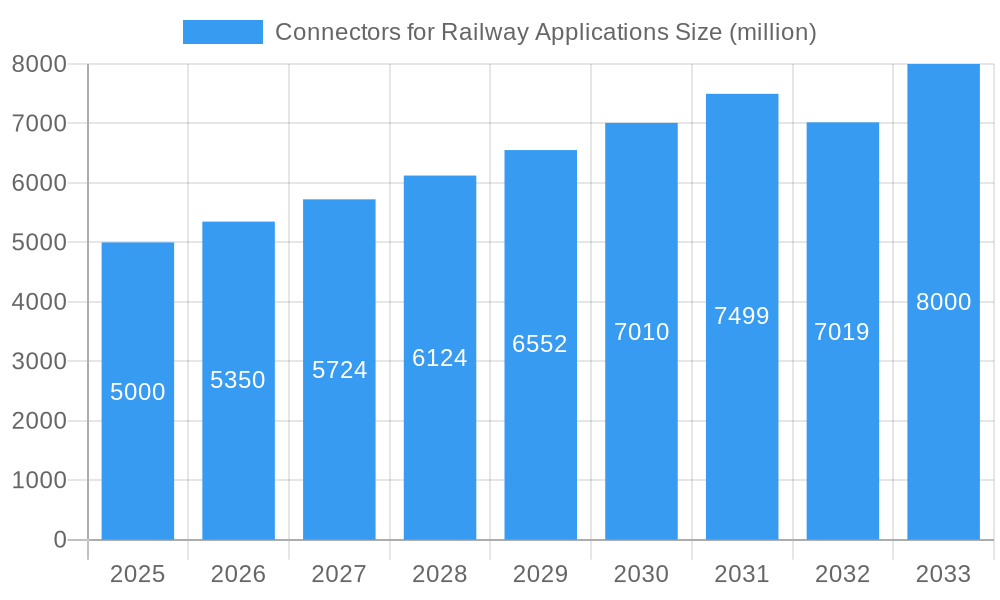
The global market for connectors for railway applications is experiencing robust growth, driven by the increasing demand for high-speed rail networks, modernization of existing infrastructure, and the adoption of advanced train control systems. The market, estimated at $5 billion in 2025, is projected to exhibit a Compound Annual Growth Rate (CAGR) of around 7% from 2025 to 2033, reaching approximately $8 billion by 2033. This growth is fueled by several key factors, including the rising adoption of automation and digitalization in railway operations, stringent safety regulations necessitating reliable and high-performance connectors, and the expanding global railway network. Furthermore, the increasing electrification of railway systems is contributing significantly to market expansion, as these systems require a higher density of robust and reliable connectors. Major players such as TE Connectivity, Amphenol, and others are investing heavily in research and development to cater to the growing demand for specialized connectors that meet the specific requirements of the railway industry.
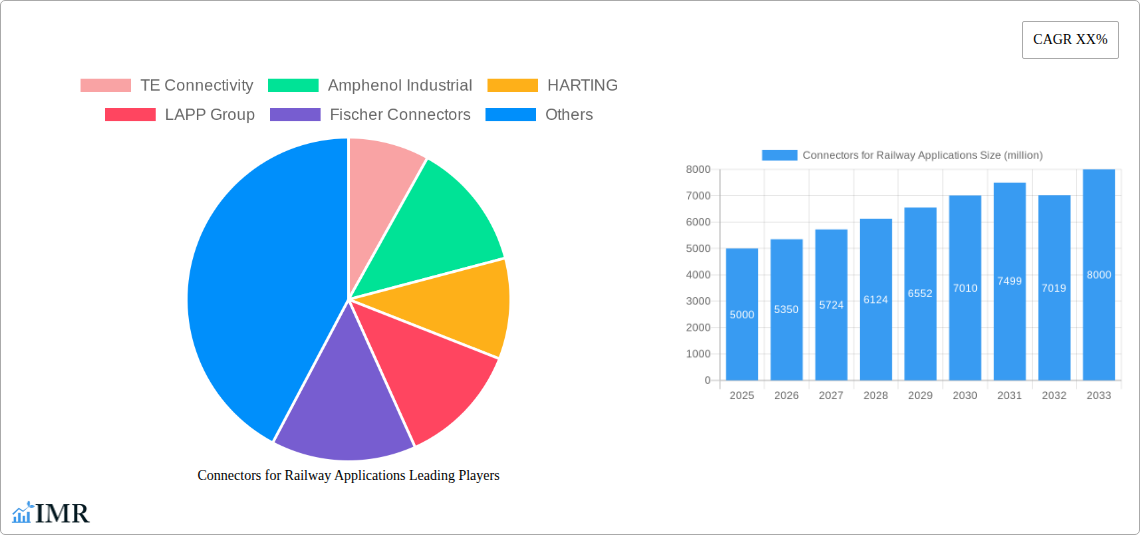
Connectors for Railway Applications Market Size (In Billion)
Several trends are shaping the future of this market. The shift towards lightweight and compact designs is driving innovation in connector technology, allowing for improved energy efficiency and reduced weight in trains. The increasing adoption of high-speed data transmission technologies is also fueling demand for high-bandwidth connectors that can support advanced communication and control systems. Despite these positive trends, the market faces some challenges including high initial investment costs associated with upgrading existing railway infrastructure and the need for stringent quality control and testing to ensure the reliability and safety of connectors in demanding railway environments. The ongoing supply chain disruptions and global economic uncertainties could also influence the market's growth trajectory in the coming years. However, long-term prospects remain positive due to sustained investment in railway infrastructure globally.
Connectors for Railway Applications Company Market Share
Connectors for Railway Applications Market Report: 2019-2033
This comprehensive report provides an in-depth analysis of the Connectors for Railway Applications market, encompassing the parent market of Industrial Connectors and the child market of Railway Transportation. It offers a detailed examination of market dynamics, growth trends, regional dominance, product landscapes, key players, and future opportunities from 2019 to 2033. The report is invaluable for industry professionals, investors, and strategic decision-makers seeking a clear understanding of this crucial sector. The base year for this report is 2025, with estimations provided for 2025 and forecasts extending to 2033. The historical period covered is 2019-2024. The market size is presented in million units.
Connectors for Railway Applications Market Dynamics & Structure
This section analyzes the competitive landscape of the railway connector market, exploring market concentration, technological advancements, regulatory influences, and market dynamics. The report delves into the impact of mergers and acquisitions (M&A) activity, examining both quantitative (market share, M&A deal volumes) and qualitative aspects (innovation barriers).
- Market Concentration: The market is moderately concentrated, with a few dominant players holding significant market share. TE Connectivity and Amphenol Industrial collectively hold an estimated xx% market share in 2025.
- Technological Innovation: Continuous innovation in materials, miniaturization, and connectivity protocols (e.g., Ethernet, high-speed data transmission) is driving market growth. The adoption of advanced technologies like high-speed data transmission and fiber optics is particularly noteworthy.
- Regulatory Frameworks: Stringent safety and reliability standards governing railway systems influence connector design, testing, and certification. Compliance costs present a challenge but ensure market quality.
- Competitive Product Substitutes: Limited direct substitutes exist; however, advancements in wireless technologies could present long-term competitive pressure, impacting certain segments.
- End-User Demographics: The growth of high-speed rail networks and the increasing demand for reliable railway infrastructure globally are major factors driving market expansion.
- M&A Trends: Consolidation through mergers and acquisitions is expected to continue, driven by the need for technological advancement, economies of scale, and expansion into new markets. The number of M&A deals in the historical period (2019-2024) is estimated at xx.
Connectors for Railway Applications Growth Trends & Insights
This section provides a comprehensive analysis of market size evolution, adoption rates, technological disruptions, and shifts in consumer behavior within the railway connector industry. The analysis leverages a combination of primary and secondary research, including industry reports, expert interviews, and market data analyses.
The global market for railway connectors experienced a Compound Annual Growth Rate (CAGR) of xx% during the historical period (2019-2024). This growth is projected to continue, with a forecast CAGR of xx% during the forecast period (2025-2033). Factors like increased investment in railway infrastructure, the global expansion of high-speed rail networks, and rising demand for enhanced safety and reliability are key drivers. Market penetration is expected to increase further, reaching an estimated xx% by 2033. The adoption of new technologies, such as high-speed data transmission and advanced materials, is accelerating market growth and driving the demand for more sophisticated connector solutions.
Dominant Regions, Countries, or Segments in Connectors for Railway Applications
This section identifies leading regions, countries, and segments driving market growth. The analysis highlights key economic policies, infrastructure developments, and other factors contributing to regional dominance. The report uses market share data and growth potential to assess the influence of various factors.
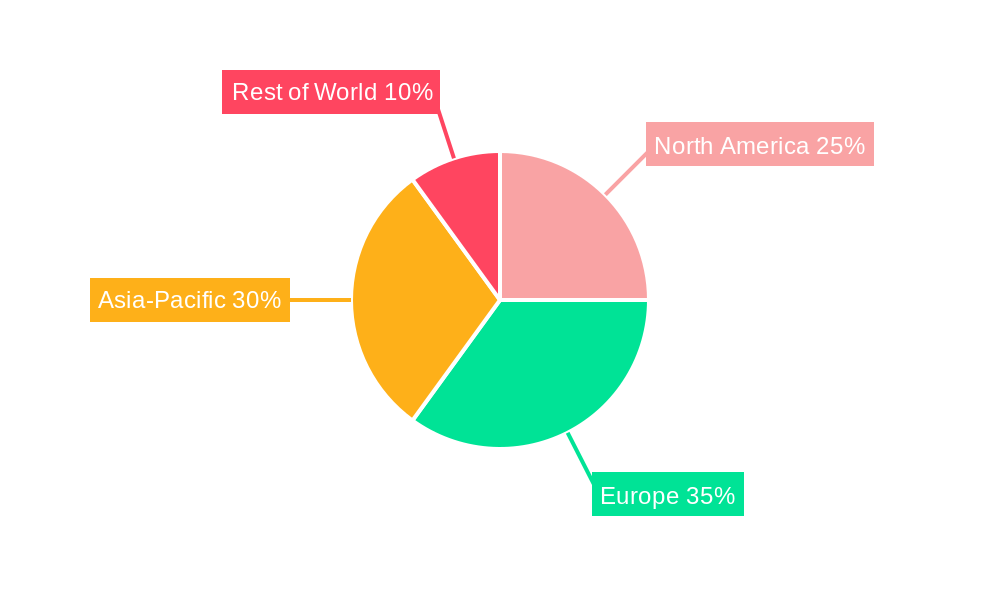
- Dominant Regions: Asia-Pacific is expected to be the leading region in the forecast period, driven by significant investments in high-speed rail projects in countries like China, India, and Japan. Europe and North America also contribute significantly, albeit with a slower growth rate compared to Asia-Pacific.
- Key Drivers: Government initiatives promoting railway modernization, the expansion of freight transportation networks, and rising passenger traffic are key growth drivers.
- Market Share: Asia-Pacific holds an estimated xx% market share in 2025, while Europe and North America hold xx% and xx%, respectively.
- Growth Potential: Untapped markets in developing economies, including regions in Africa and Latin America, present significant growth opportunities in the long term.
Connectors for Railway Applications Product Landscape
This section details product innovations, applications, and performance metrics in the connectors sector for railway applications.
The market offers a range of connectors, including high-speed data connectors, power connectors, and fiber optic connectors, designed to meet specific railway application requirements, such as high vibration resistance, shock resistance, and electromagnetic compatibility (EMC). Recent innovations focus on miniaturization, improved reliability, and increased data transmission speeds. Key selling propositions include enhanced durability, improved signal integrity, and reduced weight and size. Technological advancements include the integration of sensors and advanced materials for improved performance and monitoring capabilities.
Key Drivers, Barriers & Challenges in Connectors for Railway Applications
This section outlines the key drivers and challenges influencing market growth.
Key Drivers:
- Increasing demand for high-speed rail networks globally.
- Growing investments in railway infrastructure modernization.
- Stringent safety regulations promoting the use of reliable connectors.
- Technological advancements leading to higher data transmission speeds and improved connectivity.
Challenges & Restraints:
- High initial investment costs for implementing new connector technologies.
- Supply chain disruptions and material shortages impacting production and delivery times. This has resulted in an estimated xx% increase in costs in 2024.
- Stringent regulatory compliance requirements adding to the development and certification costs.
- Intense competition from established players and emerging market entrants.
Emerging Opportunities in Connectors for Railway Applications
This section highlights emerging opportunities for growth in the railway connector market.
- The integration of advanced technologies like IoT and 5G in railway systems presents opportunities for new connector applications.
- The development of high-voltage and high-power connectors for electrified railways is gaining momentum.
- Untapped markets in developing economies offer significant growth potential. Africa, for example, presents an underserved market with considerable potential for future investment.
Growth Accelerators in the Connectors for Railway Applications Industry
Technological breakthroughs such as the development of more robust, miniaturized connectors capable of higher speeds and increased data capacity will fuel long-term growth. Strategic partnerships between connector manufacturers and railway system integrators are also playing a vital role in market expansion. Furthermore, ongoing infrastructure development and investments globally will drive significant demand for these crucial components.
Key Players Shaping the Connectors for Railway Applications Market
Notable Milestones in Connectors for Railway Applications Sector
- 2021: TE Connectivity launched a new series of high-speed data connectors for railway applications.
- 2022: Amphenol Industrial and a major railway system manufacturer formed a strategic partnership to develop custom connector solutions.
- 2023: New industry standards for railway connectors were implemented, driving further innovation and improved safety.
- 2024: Significant investments in railway infrastructure in several developing countries lead to a surge in demand for railway connectors.
In-Depth Connectors for Railway Applications Market Outlook
The future of the railway connector market is bright, driven by continued investment in railway infrastructure modernization, the growth of high-speed rail networks, and technological advancements. Strategic opportunities lie in developing innovative solutions to address the increasing demand for high-speed data transmission, enhanced safety, and improved reliability. The market is expected to continue its expansion, with significant growth potential in emerging markets. Focus on sustainable manufacturing practices and developing connectors from eco-friendly materials will play a key role in shaping the future of the industry.
Connectors for Railway Applications Segmentation
-
1. Application
- 1.1. Railway
- 1.2. City Track
-
2. Types
- 2.1. Fiber Optic Connectors
- 2.2. Coaxial Connectors
- 2.3. Power Connectors
- 2.4. Signal Connectors
- 2.5. Others
Connectors for Railway Applications Segmentation By Geography
-
1. North America
- 1.1. United States
- 1.2. Canada
- 1.3. Mexico
-
2. South America
- 2.1. Brazil
- 2.2. Argentina
- 2.3. Rest of South America
-
3. Europe
- 3.1. United Kingdom
- 3.2. Germany
- 3.3. France
- 3.4. Italy
- 3.5. Spain
- 3.6. Russia
- 3.7. Benelux
- 3.8. Nordics
- 3.9. Rest of Europe
-
4. Middle East & Africa
- 4.1. Turkey
- 4.2. Israel
- 4.3. GCC
- 4.4. North Africa
- 4.5. South Africa
- 4.6. Rest of Middle East & Africa
-
5. Asia Pacific
- 5.1. China
- 5.2. India
- 5.3. Japan
- 5.4. South Korea
- 5.5. ASEAN
- 5.6. Oceania
- 5.7. Rest of Asia Pacific
Connectors for Railway Applications Regional Market Share
Geographic Coverage of Connectors for Railway Applications
Connectors for Railway Applications REPORT HIGHLIGHTS
| Aspects | Details |
|---|---|
| Study Period | 2020-2034 |
| Base Year | 2025 |
| Estimated Year | 2026 |
| Forecast Period | 2026-2034 |
| Historical Period | 2020-2025 |
| Growth Rate | CAGR of 3.7% from 2020-2034 |
| Segmentation |
|
Table of Contents
- 1. Introduction
- 1.1. Research Scope
- 1.2. Market Segmentation
- 1.3. Research Objective
- 1.4. Definitions and Assumptions
- 2. Executive Summary
- 2.1. Market Snapshot
- 3. Market Dynamics
- 3.1. Market Drivers
- 3.2. Market Restrains
- 3.3. Market Trends
- 3.4. Market Opportunities
- 4. Market Factor Analysis
- 4.1. Porters Five Forces
- 4.1.1. Bargaining Power of Suppliers
- 4.1.2. Bargaining Power of Buyers
- 4.1.3. Threat of New Entrants
- 4.1.4. Threat of Substitutes
- 4.1.5. Competitive Rivalry
- 4.2. PESTEL analysis
- 4.3. BCG Analysis
- 4.3.1. Stars (High Growth, High Market Share)
- 4.3.2. Cash Cows (Low Growth, High Market Share)
- 4.3.3. Question Mark (High Growth, Low Market Share)
- 4.3.4. Dogs (Low Growth, Low Market Share)
- 4.4. Ansoff Matrix Analysis
- 4.5. Supply Chain Analysis
- 4.6. Regulatory Landscape
- 4.7. Current Market Potential and Opportunity Assessment (TAM–SAM–SOM Framework)
- 4.8. IMR Analyst Note
- 4.1. Porters Five Forces
- 5. Market Analysis, Insights and Forecast 2021-2033
- 5.1. Market Analysis, Insights and Forecast - by Application
- 5.1.1. Railway
- 5.1.2. City Track
- 5.2. Market Analysis, Insights and Forecast - by Types
- 5.2.1. Fiber Optic Connectors
- 5.2.2. Coaxial Connectors
- 5.2.3. Power Connectors
- 5.2.4. Signal Connectors
- 5.2.5. Others
- 5.3. Market Analysis, Insights and Forecast - by Region
- 5.3.1. North America
- 5.3.2. South America
- 5.3.3. Europe
- 5.3.4. Middle East & Africa
- 5.3.5. Asia Pacific
- 5.1. Market Analysis, Insights and Forecast - by Application
- 6. Global Connectors for Railway Applications Analysis, Insights and Forecast, 2021-2033
- 6.1. Market Analysis, Insights and Forecast - by Application
- 6.1.1. Railway
- 6.1.2. City Track
- 6.2. Market Analysis, Insights and Forecast - by Types
- 6.2.1. Fiber Optic Connectors
- 6.2.2. Coaxial Connectors
- 6.2.3. Power Connectors
- 6.2.4. Signal Connectors
- 6.2.5. Others
- 6.1. Market Analysis, Insights and Forecast - by Application
- 7. North America Connectors for Railway Applications Analysis, Insights and Forecast, 2020-2032
- 7.1. Market Analysis, Insights and Forecast - by Application
- 7.1.1. Railway
- 7.1.2. City Track
- 7.2. Market Analysis, Insights and Forecast - by Types
- 7.2.1. Fiber Optic Connectors
- 7.2.2. Coaxial Connectors
- 7.2.3. Power Connectors
- 7.2.4. Signal Connectors
- 7.2.5. Others
- 7.1. Market Analysis, Insights and Forecast - by Application
- 8. South America Connectors for Railway Applications Analysis, Insights and Forecast, 2020-2032
- 8.1. Market Analysis, Insights and Forecast - by Application
- 8.1.1. Railway
- 8.1.2. City Track
- 8.2. Market Analysis, Insights and Forecast - by Types
- 8.2.1. Fiber Optic Connectors
- 8.2.2. Coaxial Connectors
- 8.2.3. Power Connectors
- 8.2.4. Signal Connectors
- 8.2.5. Others
- 8.1. Market Analysis, Insights and Forecast - by Application
- 9. Europe Connectors for Railway Applications Analysis, Insights and Forecast, 2020-2032
- 9.1. Market Analysis, Insights and Forecast - by Application
- 9.1.1. Railway
- 9.1.2. City Track
- 9.2. Market Analysis, Insights and Forecast - by Types
- 9.2.1. Fiber Optic Connectors
- 9.2.2. Coaxial Connectors
- 9.2.3. Power Connectors
- 9.2.4. Signal Connectors
- 9.2.5. Others
- 9.1. Market Analysis, Insights and Forecast - by Application
- 10. Middle East & Africa Connectors for Railway Applications Analysis, Insights and Forecast, 2020-2032
- 10.1. Market Analysis, Insights and Forecast - by Application
- 10.1.1. Railway
- 10.1.2. City Track
- 10.2. Market Analysis, Insights and Forecast - by Types
- 10.2.1. Fiber Optic Connectors
- 10.2.2. Coaxial Connectors
- 10.2.3. Power Connectors
- 10.2.4. Signal Connectors
- 10.2.5. Others
- 10.1. Market Analysis, Insights and Forecast - by Application
- 11. Asia Pacific Connectors for Railway Applications Analysis, Insights and Forecast, 2020-2032
- 11.1. Market Analysis, Insights and Forecast - by Application
- 11.1.1. Railway
- 11.1.2. City Track
- 11.2. Market Analysis, Insights and Forecast - by Types
- 11.2.1. Fiber Optic Connectors
- 11.2.2. Coaxial Connectors
- 11.2.3. Power Connectors
- 11.2.4. Signal Connectors
- 11.2.5. Others
- 11.1. Market Analysis, Insights and Forecast - by Application
- 12. Competitive Analysis
- 12.1. Company Profiles
- 12.1.1 TE Connectivity
- 12.1.1.1. Company Overview
- 12.1.1.2. Products
- 12.1.1.3. Company Financials
- 12.1.1.4. SWOT Analysis
- 12.1.2 Amphenol Industrial
- 12.1.2.1. Company Overview
- 12.1.2.2. Products
- 12.1.2.3. Company Financials
- 12.1.2.4. SWOT Analysis
- 12.1.3 HARTING
- 12.1.3.1. Company Overview
- 12.1.3.2. Products
- 12.1.3.3. Company Financials
- 12.1.3.4. SWOT Analysis
- 12.1.4 LAPP Group
- 12.1.4.1. Company Overview
- 12.1.4.2. Products
- 12.1.4.3. Company Financials
- 12.1.4.4. SWOT Analysis
- 12.1.5 Fischer Connectors
- 12.1.5.1. Company Overview
- 12.1.5.2. Products
- 12.1.5.3. Company Financials
- 12.1.5.4. SWOT Analysis
- 12.1.6 Souriau
- 12.1.6.1. Company Overview
- 12.1.6.2. Products
- 12.1.6.3. Company Financials
- 12.1.6.4. SWOT Analysis
- 12.1.7 Radiall
- 12.1.7.1. Company Overview
- 12.1.7.2. Products
- 12.1.7.3. Company Financials
- 12.1.7.4. SWOT Analysis
- 12.1.8 Smiths Interconnect
- 12.1.8.1. Company Overview
- 12.1.8.2. Products
- 12.1.8.3. Company Financials
- 12.1.8.4. SWOT Analysis
- 12.1.9 ITT Cannon
- 12.1.9.1. Company Overview
- 12.1.9.2. Products
- 12.1.9.3. Company Financials
- 12.1.9.4. SWOT Analysis
- 12.1.10 Hirose Electric
- 12.1.10.1. Company Overview
- 12.1.10.2. Products
- 12.1.10.3. Company Financials
- 12.1.10.4. SWOT Analysis
- 12.1.11 Phoenix Contact
- 12.1.11.1. Company Overview
- 12.1.11.2. Products
- 12.1.11.3. Company Financials
- 12.1.11.4. SWOT Analysis
- 12.1.12 Odu
- 12.1.12.1. Company Overview
- 12.1.12.2. Products
- 12.1.12.3. Company Financials
- 12.1.12.4. SWOT Analysis
- 12.1.13 Rosenberger
- 12.1.13.1. Company Overview
- 12.1.13.2. Products
- 12.1.13.3. Company Financials
- 12.1.13.4. SWOT Analysis
- 12.1.14 Weidmüller
- 12.1.14.1. Company Overview
- 12.1.14.2. Products
- 12.1.14.3. Company Financials
- 12.1.14.4. SWOT Analysis
- 12.1.15 Stäubli Electrical Connectors
- 12.1.15.1. Company Overview
- 12.1.15.2. Products
- 12.1.15.3. Company Financials
- 12.1.15.4. SWOT Analysis
- 12.1.16 Leoni
- 12.1.16.1. Company Overview
- 12.1.16.2. Products
- 12.1.16.3. Company Financials
- 12.1.16.4. SWOT Analysis
- 12.1.1 TE Connectivity
- 12.2. Market Entropy
- 12.2.1 Company's Key Areas Served
- 12.2.2 Recent Developments
- 12.3. Company Market Share Analysis 2025
- 12.3.1 Top 5 Companies Market Share Analysis
- 12.3.2 Top 3 Companies Market Share Analysis
- 12.4. List of Potential Customers
- 13. Research Methodology
List of Figures
- Figure 1: Global Connectors for Railway Applications Revenue Breakdown (undefined, %) by Region 2025 & 2033
- Figure 2: Global Connectors for Railway Applications Volume Breakdown (K, %) by Region 2025 & 2033
- Figure 3: North America Connectors for Railway Applications Revenue (undefined), by Application 2025 & 2033
- Figure 4: North America Connectors for Railway Applications Volume (K), by Application 2025 & 2033
- Figure 5: North America Connectors for Railway Applications Revenue Share (%), by Application 2025 & 2033
- Figure 6: North America Connectors for Railway Applications Volume Share (%), by Application 2025 & 2033
- Figure 7: North America Connectors for Railway Applications Revenue (undefined), by Types 2025 & 2033
- Figure 8: North America Connectors for Railway Applications Volume (K), by Types 2025 & 2033
- Figure 9: North America Connectors for Railway Applications Revenue Share (%), by Types 2025 & 2033
- Figure 10: North America Connectors for Railway Applications Volume Share (%), by Types 2025 & 2033
- Figure 11: North America Connectors for Railway Applications Revenue (undefined), by Country 2025 & 2033
- Figure 12: North America Connectors for Railway Applications Volume (K), by Country 2025 & 2033
- Figure 13: North America Connectors for Railway Applications Revenue Share (%), by Country 2025 & 2033
- Figure 14: North America Connectors for Railway Applications Volume Share (%), by Country 2025 & 2033
- Figure 15: South America Connectors for Railway Applications Revenue (undefined), by Application 2025 & 2033
- Figure 16: South America Connectors for Railway Applications Volume (K), by Application 2025 & 2033
- Figure 17: South America Connectors for Railway Applications Revenue Share (%), by Application 2025 & 2033
- Figure 18: South America Connectors for Railway Applications Volume Share (%), by Application 2025 & 2033
- Figure 19: South America Connectors for Railway Applications Revenue (undefined), by Types 2025 & 2033
- Figure 20: South America Connectors for Railway Applications Volume (K), by Types 2025 & 2033
- Figure 21: South America Connectors for Railway Applications Revenue Share (%), by Types 2025 & 2033
- Figure 22: South America Connectors for Railway Applications Volume Share (%), by Types 2025 & 2033
- Figure 23: South America Connectors for Railway Applications Revenue (undefined), by Country 2025 & 2033
- Figure 24: South America Connectors for Railway Applications Volume (K), by Country 2025 & 2033
- Figure 25: South America Connectors for Railway Applications Revenue Share (%), by Country 2025 & 2033
- Figure 26: South America Connectors for Railway Applications Volume Share (%), by Country 2025 & 2033
- Figure 27: Europe Connectors for Railway Applications Revenue (undefined), by Application 2025 & 2033
- Figure 28: Europe Connectors for Railway Applications Volume (K), by Application 2025 & 2033
- Figure 29: Europe Connectors for Railway Applications Revenue Share (%), by Application 2025 & 2033
- Figure 30: Europe Connectors for Railway Applications Volume Share (%), by Application 2025 & 2033
- Figure 31: Europe Connectors for Railway Applications Revenue (undefined), by Types 2025 & 2033
- Figure 32: Europe Connectors for Railway Applications Volume (K), by Types 2025 & 2033
- Figure 33: Europe Connectors for Railway Applications Revenue Share (%), by Types 2025 & 2033
- Figure 34: Europe Connectors for Railway Applications Volume Share (%), by Types 2025 & 2033
- Figure 35: Europe Connectors for Railway Applications Revenue (undefined), by Country 2025 & 2033
- Figure 36: Europe Connectors for Railway Applications Volume (K), by Country 2025 & 2033
- Figure 37: Europe Connectors for Railway Applications Revenue Share (%), by Country 2025 & 2033
- Figure 38: Europe Connectors for Railway Applications Volume Share (%), by Country 2025 & 2033
- Figure 39: Middle East & Africa Connectors for Railway Applications Revenue (undefined), by Application 2025 & 2033
- Figure 40: Middle East & Africa Connectors for Railway Applications Volume (K), by Application 2025 & 2033
- Figure 41: Middle East & Africa Connectors for Railway Applications Revenue Share (%), by Application 2025 & 2033
- Figure 42: Middle East & Africa Connectors for Railway Applications Volume Share (%), by Application 2025 & 2033
- Figure 43: Middle East & Africa Connectors for Railway Applications Revenue (undefined), by Types 2025 & 2033
- Figure 44: Middle East & Africa Connectors for Railway Applications Volume (K), by Types 2025 & 2033
- Figure 45: Middle East & Africa Connectors for Railway Applications Revenue Share (%), by Types 2025 & 2033
- Figure 46: Middle East & Africa Connectors for Railway Applications Volume Share (%), by Types 2025 & 2033
- Figure 47: Middle East & Africa Connectors for Railway Applications Revenue (undefined), by Country 2025 & 2033
- Figure 48: Middle East & Africa Connectors for Railway Applications Volume (K), by Country 2025 & 2033
- Figure 49: Middle East & Africa Connectors for Railway Applications Revenue Share (%), by Country 2025 & 2033
- Figure 50: Middle East & Africa Connectors for Railway Applications Volume Share (%), by Country 2025 & 2033
- Figure 51: Asia Pacific Connectors for Railway Applications Revenue (undefined), by Application 2025 & 2033
- Figure 52: Asia Pacific Connectors for Railway Applications Volume (K), by Application 2025 & 2033
- Figure 53: Asia Pacific Connectors for Railway Applications Revenue Share (%), by Application 2025 & 2033
- Figure 54: Asia Pacific Connectors for Railway Applications Volume Share (%), by Application 2025 & 2033
- Figure 55: Asia Pacific Connectors for Railway Applications Revenue (undefined), by Types 2025 & 2033
- Figure 56: Asia Pacific Connectors for Railway Applications Volume (K), by Types 2025 & 2033
- Figure 57: Asia Pacific Connectors for Railway Applications Revenue Share (%), by Types 2025 & 2033
- Figure 58: Asia Pacific Connectors for Railway Applications Volume Share (%), by Types 2025 & 2033
- Figure 59: Asia Pacific Connectors for Railway Applications Revenue (undefined), by Country 2025 & 2033
- Figure 60: Asia Pacific Connectors for Railway Applications Volume (K), by Country 2025 & 2033
- Figure 61: Asia Pacific Connectors for Railway Applications Revenue Share (%), by Country 2025 & 2033
- Figure 62: Asia Pacific Connectors for Railway Applications Volume Share (%), by Country 2025 & 2033
List of Tables
- Table 1: Global Connectors for Railway Applications Revenue undefined Forecast, by Application 2020 & 2033
- Table 2: Global Connectors for Railway Applications Volume K Forecast, by Application 2020 & 2033
- Table 3: Global Connectors for Railway Applications Revenue undefined Forecast, by Types 2020 & 2033
- Table 4: Global Connectors for Railway Applications Volume K Forecast, by Types 2020 & 2033
- Table 5: Global Connectors for Railway Applications Revenue undefined Forecast, by Region 2020 & 2033
- Table 6: Global Connectors for Railway Applications Volume K Forecast, by Region 2020 & 2033
- Table 7: Global Connectors for Railway Applications Revenue undefined Forecast, by Application 2020 & 2033
- Table 8: Global Connectors for Railway Applications Volume K Forecast, by Application 2020 & 2033
- Table 9: Global Connectors for Railway Applications Revenue undefined Forecast, by Types 2020 & 2033
- Table 10: Global Connectors for Railway Applications Volume K Forecast, by Types 2020 & 2033
- Table 11: Global Connectors for Railway Applications Revenue undefined Forecast, by Country 2020 & 2033
- Table 12: Global Connectors for Railway Applications Volume K Forecast, by Country 2020 & 2033
- Table 13: United States Connectors for Railway Applications Revenue (undefined) Forecast, by Application 2020 & 2033
- Table 14: United States Connectors for Railway Applications Volume (K) Forecast, by Application 2020 & 2033
- Table 15: Canada Connectors for Railway Applications Revenue (undefined) Forecast, by Application 2020 & 2033
- Table 16: Canada Connectors for Railway Applications Volume (K) Forecast, by Application 2020 & 2033
- Table 17: Mexico Connectors for Railway Applications Revenue (undefined) Forecast, by Application 2020 & 2033
- Table 18: Mexico Connectors for Railway Applications Volume (K) Forecast, by Application 2020 & 2033
- Table 19: Global Connectors for Railway Applications Revenue undefined Forecast, by Application 2020 & 2033
- Table 20: Global Connectors for Railway Applications Volume K Forecast, by Application 2020 & 2033
- Table 21: Global Connectors for Railway Applications Revenue undefined Forecast, by Types 2020 & 2033
- Table 22: Global Connectors for Railway Applications Volume K Forecast, by Types 2020 & 2033
- Table 23: Global Connectors for Railway Applications Revenue undefined Forecast, by Country 2020 & 2033
- Table 24: Global Connectors for Railway Applications Volume K Forecast, by Country 2020 & 2033
- Table 25: Brazil Connectors for Railway Applications Revenue (undefined) Forecast, by Application 2020 & 2033
- Table 26: Brazil Connectors for Railway Applications Volume (K) Forecast, by Application 2020 & 2033
- Table 27: Argentina Connectors for Railway Applications Revenue (undefined) Forecast, by Application 2020 & 2033
- Table 28: Argentina Connectors for Railway Applications Volume (K) Forecast, by Application 2020 & 2033
- Table 29: Rest of South America Connectors for Railway Applications Revenue (undefined) Forecast, by Application 2020 & 2033
- Table 30: Rest of South America Connectors for Railway Applications Volume (K) Forecast, by Application 2020 & 2033
- Table 31: Global Connectors for Railway Applications Revenue undefined Forecast, by Application 2020 & 2033
- Table 32: Global Connectors for Railway Applications Volume K Forecast, by Application 2020 & 2033
- Table 33: Global Connectors for Railway Applications Revenue undefined Forecast, by Types 2020 & 2033
- Table 34: Global Connectors for Railway Applications Volume K Forecast, by Types 2020 & 2033
- Table 35: Global Connectors for Railway Applications Revenue undefined Forecast, by Country 2020 & 2033
- Table 36: Global Connectors for Railway Applications Volume K Forecast, by Country 2020 & 2033
- Table 37: United Kingdom Connectors for Railway Applications Revenue (undefined) Forecast, by Application 2020 & 2033
- Table 38: United Kingdom Connectors for Railway Applications Volume (K) Forecast, by Application 2020 & 2033
- Table 39: Germany Connectors for Railway Applications Revenue (undefined) Forecast, by Application 2020 & 2033
- Table 40: Germany Connectors for Railway Applications Volume (K) Forecast, by Application 2020 & 2033
- Table 41: France Connectors for Railway Applications Revenue (undefined) Forecast, by Application 2020 & 2033
- Table 42: France Connectors for Railway Applications Volume (K) Forecast, by Application 2020 & 2033
- Table 43: Italy Connectors for Railway Applications Revenue (undefined) Forecast, by Application 2020 & 2033
- Table 44: Italy Connectors for Railway Applications Volume (K) Forecast, by Application 2020 & 2033
- Table 45: Spain Connectors for Railway Applications Revenue (undefined) Forecast, by Application 2020 & 2033
- Table 46: Spain Connectors for Railway Applications Volume (K) Forecast, by Application 2020 & 2033
- Table 47: Russia Connectors for Railway Applications Revenue (undefined) Forecast, by Application 2020 & 2033
- Table 48: Russia Connectors for Railway Applications Volume (K) Forecast, by Application 2020 & 2033
- Table 49: Benelux Connectors for Railway Applications Revenue (undefined) Forecast, by Application 2020 & 2033
- Table 50: Benelux Connectors for Railway Applications Volume (K) Forecast, by Application 2020 & 2033
- Table 51: Nordics Connectors for Railway Applications Revenue (undefined) Forecast, by Application 2020 & 2033
- Table 52: Nordics Connectors for Railway Applications Volume (K) Forecast, by Application 2020 & 2033
- Table 53: Rest of Europe Connectors for Railway Applications Revenue (undefined) Forecast, by Application 2020 & 2033
- Table 54: Rest of Europe Connectors for Railway Applications Volume (K) Forecast, by Application 2020 & 2033
- Table 55: Global Connectors for Railway Applications Revenue undefined Forecast, by Application 2020 & 2033
- Table 56: Global Connectors for Railway Applications Volume K Forecast, by Application 2020 & 2033
- Table 57: Global Connectors for Railway Applications Revenue undefined Forecast, by Types 2020 & 2033
- Table 58: Global Connectors for Railway Applications Volume K Forecast, by Types 2020 & 2033
- Table 59: Global Connectors for Railway Applications Revenue undefined Forecast, by Country 2020 & 2033
- Table 60: Global Connectors for Railway Applications Volume K Forecast, by Country 2020 & 2033
- Table 61: Turkey Connectors for Railway Applications Revenue (undefined) Forecast, by Application 2020 & 2033
- Table 62: Turkey Connectors for Railway Applications Volume (K) Forecast, by Application 2020 & 2033
- Table 63: Israel Connectors for Railway Applications Revenue (undefined) Forecast, by Application 2020 & 2033
- Table 64: Israel Connectors for Railway Applications Volume (K) Forecast, by Application 2020 & 2033
- Table 65: GCC Connectors for Railway Applications Revenue (undefined) Forecast, by Application 2020 & 2033
- Table 66: GCC Connectors for Railway Applications Volume (K) Forecast, by Application 2020 & 2033
- Table 67: North Africa Connectors for Railway Applications Revenue (undefined) Forecast, by Application 2020 & 2033
- Table 68: North Africa Connectors for Railway Applications Volume (K) Forecast, by Application 2020 & 2033
- Table 69: South Africa Connectors for Railway Applications Revenue (undefined) Forecast, by Application 2020 & 2033
- Table 70: South Africa Connectors for Railway Applications Volume (K) Forecast, by Application 2020 & 2033
- Table 71: Rest of Middle East & Africa Connectors for Railway Applications Revenue (undefined) Forecast, by Application 2020 & 2033
- Table 72: Rest of Middle East & Africa Connectors for Railway Applications Volume (K) Forecast, by Application 2020 & 2033
- Table 73: Global Connectors for Railway Applications Revenue undefined Forecast, by Application 2020 & 2033
- Table 74: Global Connectors for Railway Applications Volume K Forecast, by Application 2020 & 2033
- Table 75: Global Connectors for Railway Applications Revenue undefined Forecast, by Types 2020 & 2033
- Table 76: Global Connectors for Railway Applications Volume K Forecast, by Types 2020 & 2033
- Table 77: Global Connectors for Railway Applications Revenue undefined Forecast, by Country 2020 & 2033
- Table 78: Global Connectors for Railway Applications Volume K Forecast, by Country 2020 & 2033
- Table 79: China Connectors for Railway Applications Revenue (undefined) Forecast, by Application 2020 & 2033
- Table 80: China Connectors for Railway Applications Volume (K) Forecast, by Application 2020 & 2033
- Table 81: India Connectors for Railway Applications Revenue (undefined) Forecast, by Application 2020 & 2033
- Table 82: India Connectors for Railway Applications Volume (K) Forecast, by Application 2020 & 2033
- Table 83: Japan Connectors for Railway Applications Revenue (undefined) Forecast, by Application 2020 & 2033
- Table 84: Japan Connectors for Railway Applications Volume (K) Forecast, by Application 2020 & 2033
- Table 85: South Korea Connectors for Railway Applications Revenue (undefined) Forecast, by Application 2020 & 2033
- Table 86: South Korea Connectors for Railway Applications Volume (K) Forecast, by Application 2020 & 2033
- Table 87: ASEAN Connectors for Railway Applications Revenue (undefined) Forecast, by Application 2020 & 2033
- Table 88: ASEAN Connectors for Railway Applications Volume (K) Forecast, by Application 2020 & 2033
- Table 89: Oceania Connectors for Railway Applications Revenue (undefined) Forecast, by Application 2020 & 2033
- Table 90: Oceania Connectors for Railway Applications Volume (K) Forecast, by Application 2020 & 2033
- Table 91: Rest of Asia Pacific Connectors for Railway Applications Revenue (undefined) Forecast, by Application 2020 & 2033
- Table 92: Rest of Asia Pacific Connectors for Railway Applications Volume (K) Forecast, by Application 2020 & 2033
Frequently Asked Questions
1. What is the projected Compound Annual Growth Rate (CAGR) of the Connectors for Railway Applications?
The projected CAGR is approximately 3.7%.
2. Which companies are prominent players in the Connectors for Railway Applications?
Key companies in the market include TE Connectivity, Amphenol Industrial, HARTING, LAPP Group, Fischer Connectors, Souriau, Radiall, Smiths Interconnect, ITT Cannon, Hirose Electric, Phoenix Contact, Odu, Rosenberger, Weidmüller, Stäubli Electrical Connectors, Leoni.
3. What are the main segments of the Connectors for Railway Applications?
The market segments include Application, Types.
4. Can you provide details about the market size?
The market size is estimated to be USD XXX N/A as of 2022.
5. What are some drivers contributing to market growth?
N/A
6. What are the notable trends driving market growth?
N/A
7. Are there any restraints impacting market growth?
N/A
8. Can you provide examples of recent developments in the market?
N/A
9. What pricing options are available for accessing the report?
Pricing options include single-user, multi-user, and enterprise licenses priced at USD 4350.00, USD 6525.00, and USD 8700.00 respectively.
10. Is the market size provided in terms of value or volume?
The market size is provided in terms of value, measured in N/A and volume, measured in K.
11. Are there any specific market keywords associated with the report?
Yes, the market keyword associated with the report is "Connectors for Railway Applications," which aids in identifying and referencing the specific market segment covered.
12. How do I determine which pricing option suits my needs best?
The pricing options vary based on user requirements and access needs. Individual users may opt for single-user licenses, while businesses requiring broader access may choose multi-user or enterprise licenses for cost-effective access to the report.
13. Are there any additional resources or data provided in the Connectors for Railway Applications report?
While the report offers comprehensive insights, it's advisable to review the specific contents or supplementary materials provided to ascertain if additional resources or data are available.
14. How can I stay updated on further developments or reports in the Connectors for Railway Applications?
To stay informed about further developments, trends, and reports in the Connectors for Railway Applications, consider subscribing to industry newsletters, following relevant companies and organizations, or regularly checking reputable industry news sources and publications.
Methodology
Step 1 - Identification of Relevant Samples Size from Population Database


Step 2 - Approaches for Defining Global Market Size (Value, Volume* & Price*)

Note*: In applicable scenarios
Step 3 - Data Sources
Primary Research
- Web Analytics
- Survey Reports
- Research Institute
- Latest Research Reports
- Opinion Leaders
Secondary Research
- Annual Reports
- White Paper
- Latest Press Release
- Industry Association
- Paid Database
- Investor Presentations

Step 4 - Data Triangulation
Involves using different sources of information in order to increase the validity of a study
These sources are likely to be stakeholders in a program - participants, other researchers, program staff, other community members, and so on.
Then we put all data in single framework & apply various statistical tools to find out the dynamic on the market.
During the analysis stage, feedback from the stakeholder groups would be compared to determine areas of agreement as well as areas of divergence