

Key Insights
The global Continuous Variable Transmission (CVT) market is experiencing robust growth, driven by increasing demand for fuel-efficient vehicles and advancements in CVT technology. The market's expansion is fueled by the automotive industry's ongoing efforts to meet stringent fuel economy regulations and consumer preference for better fuel efficiency. This demand is particularly strong in regions with high vehicle ownership and a focus on environmentally friendly transportation solutions. Technological improvements, such as the development of more durable and responsive CVTs, are further enhancing their appeal across various vehicle segments, including passenger cars and light commercial vehicles. Furthermore, the integration of hybrid and electric vehicle technologies with CVTs is opening up new growth avenues. While challenges remain, such as the perception of CVT performance limitations and the higher initial production costs compared to traditional automatic transmissions, these are progressively being mitigated through technological advancements and economies of scale.
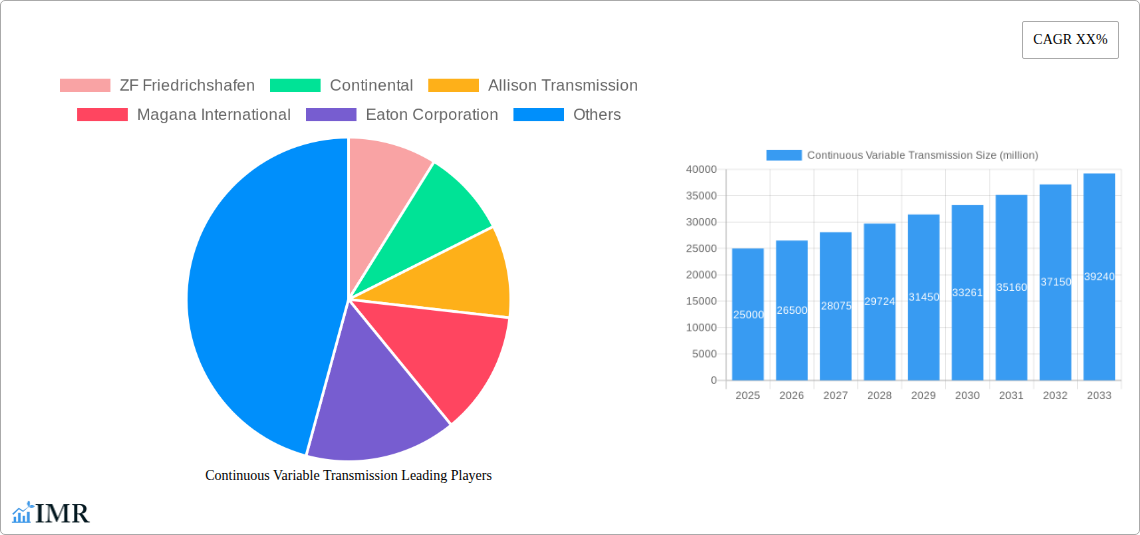
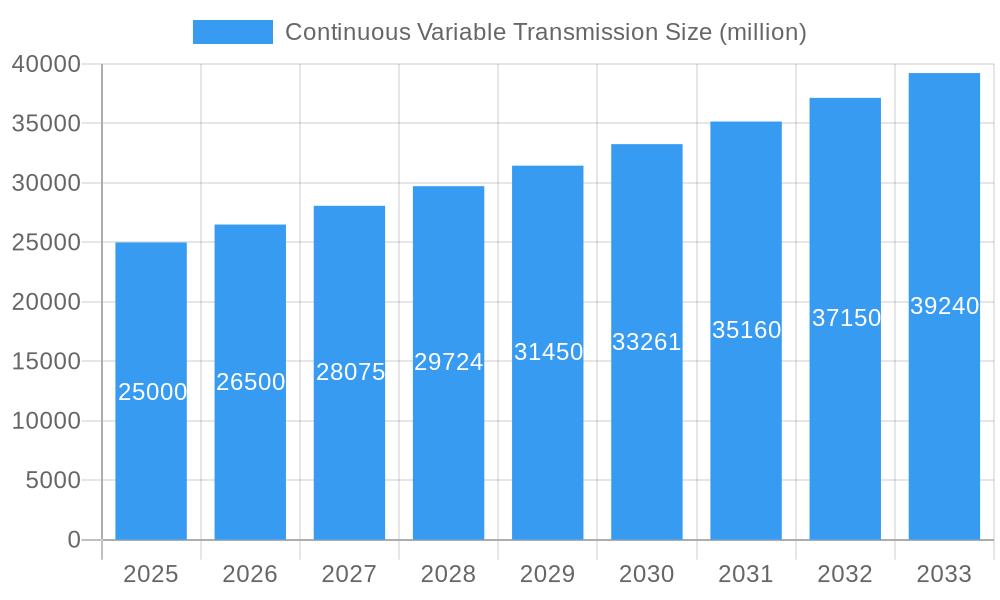
Continuous Variable Transmission Market Size (In Billion)
Looking ahead, the market's growth trajectory is projected to continue its upward trend, driven by sustained demand for fuel-efficient vehicles and the ongoing development of more sophisticated and cost-effective CVT technologies. The market is segmented by vehicle type (passenger cars, light commercial vehicles, etc.), transmission type (belt-type, chain-type, etc.), and geography. Key players in the CVT market, including ZF Friedrichshafen, Continental, Allison Transmission, and others, are actively involved in research and development to enhance performance, durability, and cost-effectiveness. Strategic partnerships, mergers, and acquisitions are likely to shape the competitive landscape in the coming years. The continued adoption of CVTs in hybrid and electric vehicles is also anticipated to significantly contribute to the market's overall expansion.
Continuous Variable Transmission Company Market Share
This comprehensive report provides a detailed analysis of the global Continuous Variable Transmission (CVT) market, offering invaluable insights for industry professionals, investors, and strategists. With a focus on market dynamics, growth trends, and key players, this report covers the period from 2019 to 2033, with a base year of 2025 and a forecast period of 2025-2033. The report analyzes the automotive and industrial machinery (parent market) segments, specifically focusing on passenger vehicles and off-highway vehicles (child markets). The global CVT market size is projected to reach xx million units by 2033.
Continuous Variable Transmission Market Dynamics & Structure
This section analyzes the competitive landscape of the CVT market, encompassing market concentration, technological advancements, regulatory influences, and market trends. The market is moderately concentrated, with key players holding significant market share. Technological innovation is crucial, driven by efficiency improvements and integration with advanced driver-assistance systems (ADAS). Stringent emission regulations are major drivers, pushing adoption of fuel-efficient technologies.
- Market Concentration: The top five players, including ZF Friedrichshafen, Continental, Allison Transmission, and others hold approximately 60% of the global market share in 2025.
- Technological Innovation: Ongoing R&D focuses on improving CVT efficiency, durability, and responsiveness, leading to increased adoption. Innovations include belt material improvements, advanced control systems, and hybrid integrations.
- Regulatory Framework: Government regulations promoting fuel efficiency and reduced emissions are strong drivers of CVT adoption globally, particularly in regions with strict emission standards.
- Competitive Substitutes: Manual transmissions and traditional automatic transmissions remain significant competitors, although CVTs offer advantages in fuel efficiency. Dual-clutch transmissions (DCTs) pose another competitive challenge, especially in performance-oriented applications.
- End-User Demographics: The primary end-user segments are passenger vehicle manufacturers and industrial equipment manufacturers. The growth of the automotive industry particularly in developing economies is driving market demand.
- M&A Trends: The past five years have witnessed approximately xx M&A deals, mainly focused on strengthening technological capabilities and expanding market reach.
Continuous Variable Transmission Growth Trends & Insights
The global CVT market experienced significant growth during the historical period (2019-2024), primarily driven by increasing demand for fuel-efficient vehicles and the rising adoption of CVT technology in various vehicle segments. The market is expected to continue its growth trajectory during the forecast period (2025-2033), with a compound annual growth rate (CAGR) of xx%. This growth is fuelled by several factors:
- Market Size Evolution: The market size increased from xx million units in 2019 to xx million units in 2024, demonstrating robust growth. The forecast anticipates further expansion to xx million units by 2033.
- Adoption Rates: Adoption rates are particularly high in regions with stringent fuel economy regulations and a strong preference for fuel-efficient vehicles. The penetration rate in the passenger vehicle segment is expected to reach xx% by 2033.
- Technological Disruptions: Continuous advancements in CVT technology, such as the integration of hybrid systems and improved control algorithms, are driving market expansion.
- Consumer Behavior Shifts: Growing consumer awareness of fuel efficiency and environmental concerns is a significant factor driving demand for CVT-equipped vehicles.
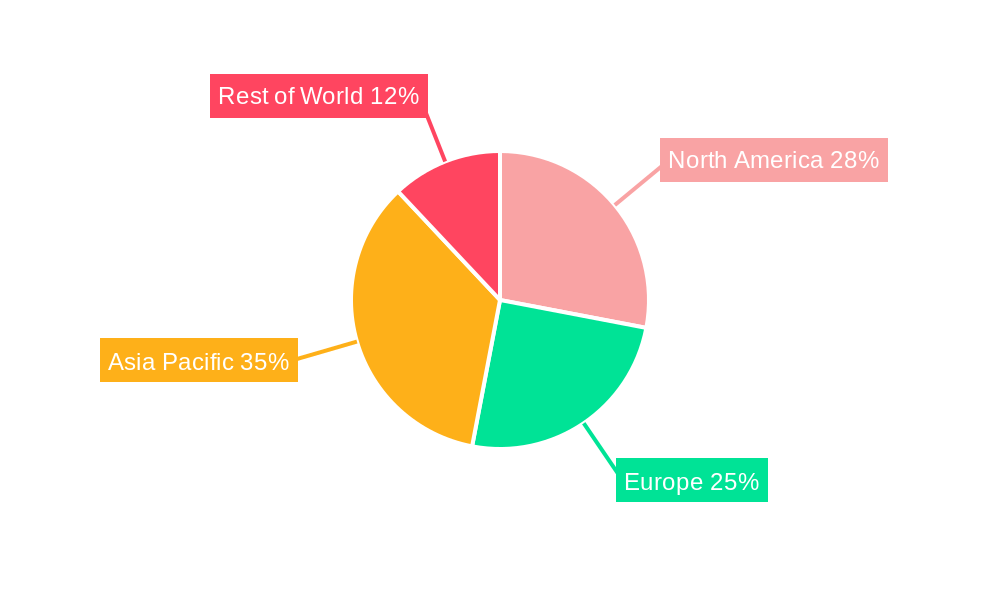
Dominant Regions, Countries, or Segments in Continuous Variable Transmission
The Asia-Pacific region is currently the dominant market for CVTs, primarily driven by the strong growth of the automotive industry in countries such as China, India, and Japan.
- Key Drivers: Rapid economic growth, increasing vehicle ownership, and supportive government policies promoting fuel efficiency and emission reduction are key drivers in the Asia-Pacific region. Government incentives for fuel-efficient vehicles are particularly prominent in this region.
- Dominance Factors: High vehicle production volumes, a large consumer base, and significant investments in automotive manufacturing facilities have established the region's dominance. The region's large market share reflects both high volume and fast growth.
- Growth Potential: Emerging markets within the Asia-Pacific region, along with the increasing demand for electric and hybrid vehicles, present substantial growth opportunities. Countries in Southeast Asia are poised for significant market expansion.
Continuous Variable Transmission Product Landscape
CVTs offer several advantages over traditional automatic transmissions, including superior fuel efficiency, smoother operation, and compact design. Recent innovations include the development of more durable belt materials, enhanced control algorithms for improved responsiveness, and the integration of CVTs with hybrid systems for further fuel savings and reduced emissions. Unique selling propositions include improved fuel efficiency compared to traditional automatic transmissions, and a smaller physical footprint than many other automatic transmission types. Technological advancements focus on improved durability, responsiveness, and efficiency, as well as smoother power delivery.
Key Drivers, Barriers & Challenges in Continuous Variable Transmission
Key Drivers: The primary drivers for CVT market growth include stringent fuel economy regulations, increasing demand for fuel-efficient vehicles, and technological advancements leading to improved CVT performance and reliability. Government incentives for fuel-efficient vehicles in several key markets further stimulate growth.
Key Challenges & Restraints: High initial production costs compared to traditional automatic transmissions represent a major barrier. Concerns regarding CVT durability and potential for premature wear remain. Supply chain disruptions and material costs pose additional challenges. These challenges are estimated to negatively impact growth by approximately xx% during the forecast period.
Emerging Opportunities in Continuous Variable Transmission
Emerging opportunities include the growing demand for CVTs in hybrid and electric vehicles, expansion into new markets such as off-highway vehicles and industrial equipment, and the development of advanced CVT technologies such as electronically controlled continuously variable transmissions (eCVTs). The increasing demand for fuel-efficient vehicles in emerging markets and the shift towards electrification also present growth opportunities.
Growth Accelerators in the Continuous Variable Transmission Industry
Technological breakthroughs in CVT design and materials are key growth accelerators. Strategic partnerships between CVT manufacturers and automotive OEMs are also driving market expansion. Furthermore, expansion into new applications, particularly in the industrial equipment sector, is expected to accelerate market growth in the coming years. This includes applications in agricultural machinery and other off-highway vehicles.
Key Players Shaping the Continuous Variable Transmission Market
- ZF Friedrichshafen
- Continental
- Allison Transmission
- Magana International
- Eaton Corporation
- Borg Warner
- Aisin Seiki
- JATCO
- Schaeffler
- Hyundai Dymos
- Bonfiglioli RIDUTTORI
- Magneti Marelli
Notable Milestones in Continuous Variable Transmission Sector
- 2020: ZF Friedrichshafen launched a new generation of CVTs with improved efficiency and durability.
- 2021: Continental introduced a hybrid CVT system designed for electric vehicles.
- 2022: Aisin Seiki announced a strategic partnership with an automotive OEM to develop advanced CVT technology.
- 2023: xx (Insert a notable milestone if available, otherwise replace with 'Further industry consolidation and technological advancements continued')
In-Depth Continuous Variable Transmission Market Outlook
The CVT market is poised for continued growth, driven by technological advancements, stringent emission regulations, and increasing demand for fuel-efficient vehicles. Strategic partnerships and investments in R&D will play a crucial role in shaping the future of the CVT market. The long-term outlook remains positive, with significant growth potential in emerging markets and new applications. The market is expected to reach xx million units by 2033, driven primarily by advancements in fuel efficiency and continuous product innovation.
Continuous Variable Transmission Segmentation
-
1. Application
- 1.1. Passenger Car
- 1.2. Commercial Vehicle
-
2. Types
- 2.1. Belt Connection
- 2.2. Chain Connection
Continuous Variable Transmission Segmentation By Geography
-
1. North America
- 1.1. United States
- 1.2. Canada
- 1.3. Mexico
-
2. South America
- 2.1. Brazil
- 2.2. Argentina
- 2.3. Rest of South America
-
3. Europe
- 3.1. United Kingdom
- 3.2. Germany
- 3.3. France
- 3.4. Italy
- 3.5. Spain
- 3.6. Russia
- 3.7. Benelux
- 3.8. Nordics
- 3.9. Rest of Europe
-
4. Middle East & Africa
- 4.1. Turkey
- 4.2. Israel
- 4.3. GCC
- 4.4. North Africa
- 4.5. South Africa
- 4.6. Rest of Middle East & Africa
-
5. Asia Pacific
- 5.1. China
- 5.2. India
- 5.3. Japan
- 5.4. South Korea
- 5.5. ASEAN
- 5.6. Oceania
- 5.7. Rest of Asia Pacific
Continuous Variable Transmission Regional Market Share
Geographic Coverage of Continuous Variable Transmission
Continuous Variable Transmission REPORT HIGHLIGHTS
| Aspects | Details |
|---|---|
| Study Period | 2020-2034 |
| Base Year | 2025 |
| Estimated Year | 2026 |
| Forecast Period | 2026-2034 |
| Historical Period | 2020-2025 |
| Growth Rate | CAGR of 3.8% from 2020-2034 |
| Segmentation |
|
Table of Contents
- 1. Introduction
- 1.1. Research Scope
- 1.2. Market Segmentation
- 1.3. Research Objective
- 1.4. Definitions and Assumptions
- 2. Executive Summary
- 2.1. Market Snapshot
- 3. Market Dynamics
- 3.1. Market Drivers
- 3.2. Market Restrains
- 3.3. Market Trends
- 3.4. Market Opportunities
- 4. Market Factor Analysis
- 4.1. Porters Five Forces
- 4.1.1. Bargaining Power of Suppliers
- 4.1.2. Bargaining Power of Buyers
- 4.1.3. Threat of New Entrants
- 4.1.4. Threat of Substitutes
- 4.1.5. Competitive Rivalry
- 4.2. PESTEL analysis
- 4.3. BCG Analysis
- 4.3.1. Stars (High Growth, High Market Share)
- 4.3.2. Cash Cows (Low Growth, High Market Share)
- 4.3.3. Question Mark (High Growth, Low Market Share)
- 4.3.4. Dogs (Low Growth, Low Market Share)
- 4.4. Ansoff Matrix Analysis
- 4.5. Supply Chain Analysis
- 4.6. Regulatory Landscape
- 4.7. Current Market Potential and Opportunity Assessment (TAM–SAM–SOM Framework)
- 4.8. IMR Analyst Note
- 4.1. Porters Five Forces
- 5. Market Analysis, Insights and Forecast 2021-2033
- 5.1. Market Analysis, Insights and Forecast - by Application
- 5.1.1. Passenger Car
- 5.1.2. Commercial Vehicle
- 5.2. Market Analysis, Insights and Forecast - by Types
- 5.2.1. Belt Connection
- 5.2.2. Chain Connection
- 5.3. Market Analysis, Insights and Forecast - by Region
- 5.3.1. North America
- 5.3.2. South America
- 5.3.3. Europe
- 5.3.4. Middle East & Africa
- 5.3.5. Asia Pacific
- 5.1. Market Analysis, Insights and Forecast - by Application
- 6. Global Continuous Variable Transmission Analysis, Insights and Forecast, 2021-2033
- 6.1. Market Analysis, Insights and Forecast - by Application
- 6.1.1. Passenger Car
- 6.1.2. Commercial Vehicle
- 6.2. Market Analysis, Insights and Forecast - by Types
- 6.2.1. Belt Connection
- 6.2.2. Chain Connection
- 6.1. Market Analysis, Insights and Forecast - by Application
- 7. North America Continuous Variable Transmission Analysis, Insights and Forecast, 2020-2032
- 7.1. Market Analysis, Insights and Forecast - by Application
- 7.1.1. Passenger Car
- 7.1.2. Commercial Vehicle
- 7.2. Market Analysis, Insights and Forecast - by Types
- 7.2.1. Belt Connection
- 7.2.2. Chain Connection
- 7.1. Market Analysis, Insights and Forecast - by Application
- 8. South America Continuous Variable Transmission Analysis, Insights and Forecast, 2020-2032
- 8.1. Market Analysis, Insights and Forecast - by Application
- 8.1.1. Passenger Car
- 8.1.2. Commercial Vehicle
- 8.2. Market Analysis, Insights and Forecast - by Types
- 8.2.1. Belt Connection
- 8.2.2. Chain Connection
- 8.1. Market Analysis, Insights and Forecast - by Application
- 9. Europe Continuous Variable Transmission Analysis, Insights and Forecast, 2020-2032
- 9.1. Market Analysis, Insights and Forecast - by Application
- 9.1.1. Passenger Car
- 9.1.2. Commercial Vehicle
- 9.2. Market Analysis, Insights and Forecast - by Types
- 9.2.1. Belt Connection
- 9.2.2. Chain Connection
- 9.1. Market Analysis, Insights and Forecast - by Application
- 10. Middle East & Africa Continuous Variable Transmission Analysis, Insights and Forecast, 2020-2032
- 10.1. Market Analysis, Insights and Forecast - by Application
- 10.1.1. Passenger Car
- 10.1.2. Commercial Vehicle
- 10.2. Market Analysis, Insights and Forecast - by Types
- 10.2.1. Belt Connection
- 10.2.2. Chain Connection
- 10.1. Market Analysis, Insights and Forecast - by Application
- 11. Asia Pacific Continuous Variable Transmission Analysis, Insights and Forecast, 2020-2032
- 11.1. Market Analysis, Insights and Forecast - by Application
- 11.1.1. Passenger Car
- 11.1.2. Commercial Vehicle
- 11.2. Market Analysis, Insights and Forecast - by Types
- 11.2.1. Belt Connection
- 11.2.2. Chain Connection
- 11.1. Market Analysis, Insights and Forecast - by Application
- 12. Competitive Analysis
- 12.1. Company Profiles
- 12.1.1 ZF Friedrichshafen
- 12.1.1.1. Company Overview
- 12.1.1.2. Products
- 12.1.1.3. Company Financials
- 12.1.1.4. SWOT Analysis
- 12.1.2 Continental
- 12.1.2.1. Company Overview
- 12.1.2.2. Products
- 12.1.2.3. Company Financials
- 12.1.2.4. SWOT Analysis
- 12.1.3 Allison Transmission
- 12.1.3.1. Company Overview
- 12.1.3.2. Products
- 12.1.3.3. Company Financials
- 12.1.3.4. SWOT Analysis
- 12.1.4 Magana International
- 12.1.4.1. Company Overview
- 12.1.4.2. Products
- 12.1.4.3. Company Financials
- 12.1.4.4. SWOT Analysis
- 12.1.5 Eaton Corporation
- 12.1.5.1. Company Overview
- 12.1.5.2. Products
- 12.1.5.3. Company Financials
- 12.1.5.4. SWOT Analysis
- 12.1.6 Borg Warner
- 12.1.6.1. Company Overview
- 12.1.6.2. Products
- 12.1.6.3. Company Financials
- 12.1.6.4. SWOT Analysis
- 12.1.7 Aisin Seiki
- 12.1.7.1. Company Overview
- 12.1.7.2. Products
- 12.1.7.3. Company Financials
- 12.1.7.4. SWOT Analysis
- 12.1.8 JATCO
- 12.1.8.1. Company Overview
- 12.1.8.2. Products
- 12.1.8.3. Company Financials
- 12.1.8.4. SWOT Analysis
- 12.1.9 Schaeffler
- 12.1.9.1. Company Overview
- 12.1.9.2. Products
- 12.1.9.3. Company Financials
- 12.1.9.4. SWOT Analysis
- 12.1.10 Hyundai Dymos
- 12.1.10.1. Company Overview
- 12.1.10.2. Products
- 12.1.10.3. Company Financials
- 12.1.10.4. SWOT Analysis
- 12.1.11 Bonfiglioli RIDUTTORI
- 12.1.11.1. Company Overview
- 12.1.11.2. Products
- 12.1.11.3. Company Financials
- 12.1.11.4. SWOT Analysis
- 12.1.12 Magneti Marelli
- 12.1.12.1. Company Overview
- 12.1.12.2. Products
- 12.1.12.3. Company Financials
- 12.1.12.4. SWOT Analysis
- 12.1.1 ZF Friedrichshafen
- 12.2. Market Entropy
- 12.2.1 Company's Key Areas Served
- 12.2.2 Recent Developments
- 12.3. Company Market Share Analysis 2025
- 12.3.1 Top 5 Companies Market Share Analysis
- 12.3.2 Top 3 Companies Market Share Analysis
- 12.4. List of Potential Customers
- 13. Research Methodology
List of Figures
- Figure 1: Global Continuous Variable Transmission Revenue Breakdown (undefined, %) by Region 2025 & 2033
- Figure 2: Global Continuous Variable Transmission Volume Breakdown (K, %) by Region 2025 & 2033
- Figure 3: North America Continuous Variable Transmission Revenue (undefined), by Application 2025 & 2033
- Figure 4: North America Continuous Variable Transmission Volume (K), by Application 2025 & 2033
- Figure 5: North America Continuous Variable Transmission Revenue Share (%), by Application 2025 & 2033
- Figure 6: North America Continuous Variable Transmission Volume Share (%), by Application 2025 & 2033
- Figure 7: North America Continuous Variable Transmission Revenue (undefined), by Types 2025 & 2033
- Figure 8: North America Continuous Variable Transmission Volume (K), by Types 2025 & 2033
- Figure 9: North America Continuous Variable Transmission Revenue Share (%), by Types 2025 & 2033
- Figure 10: North America Continuous Variable Transmission Volume Share (%), by Types 2025 & 2033
- Figure 11: North America Continuous Variable Transmission Revenue (undefined), by Country 2025 & 2033
- Figure 12: North America Continuous Variable Transmission Volume (K), by Country 2025 & 2033
- Figure 13: North America Continuous Variable Transmission Revenue Share (%), by Country 2025 & 2033
- Figure 14: North America Continuous Variable Transmission Volume Share (%), by Country 2025 & 2033
- Figure 15: South America Continuous Variable Transmission Revenue (undefined), by Application 2025 & 2033
- Figure 16: South America Continuous Variable Transmission Volume (K), by Application 2025 & 2033
- Figure 17: South America Continuous Variable Transmission Revenue Share (%), by Application 2025 & 2033
- Figure 18: South America Continuous Variable Transmission Volume Share (%), by Application 2025 & 2033
- Figure 19: South America Continuous Variable Transmission Revenue (undefined), by Types 2025 & 2033
- Figure 20: South America Continuous Variable Transmission Volume (K), by Types 2025 & 2033
- Figure 21: South America Continuous Variable Transmission Revenue Share (%), by Types 2025 & 2033
- Figure 22: South America Continuous Variable Transmission Volume Share (%), by Types 2025 & 2033
- Figure 23: South America Continuous Variable Transmission Revenue (undefined), by Country 2025 & 2033
- Figure 24: South America Continuous Variable Transmission Volume (K), by Country 2025 & 2033
- Figure 25: South America Continuous Variable Transmission Revenue Share (%), by Country 2025 & 2033
- Figure 26: South America Continuous Variable Transmission Volume Share (%), by Country 2025 & 2033
- Figure 27: Europe Continuous Variable Transmission Revenue (undefined), by Application 2025 & 2033
- Figure 28: Europe Continuous Variable Transmission Volume (K), by Application 2025 & 2033
- Figure 29: Europe Continuous Variable Transmission Revenue Share (%), by Application 2025 & 2033
- Figure 30: Europe Continuous Variable Transmission Volume Share (%), by Application 2025 & 2033
- Figure 31: Europe Continuous Variable Transmission Revenue (undefined), by Types 2025 & 2033
- Figure 32: Europe Continuous Variable Transmission Volume (K), by Types 2025 & 2033
- Figure 33: Europe Continuous Variable Transmission Revenue Share (%), by Types 2025 & 2033
- Figure 34: Europe Continuous Variable Transmission Volume Share (%), by Types 2025 & 2033
- Figure 35: Europe Continuous Variable Transmission Revenue (undefined), by Country 2025 & 2033
- Figure 36: Europe Continuous Variable Transmission Volume (K), by Country 2025 & 2033
- Figure 37: Europe Continuous Variable Transmission Revenue Share (%), by Country 2025 & 2033
- Figure 38: Europe Continuous Variable Transmission Volume Share (%), by Country 2025 & 2033
- Figure 39: Middle East & Africa Continuous Variable Transmission Revenue (undefined), by Application 2025 & 2033
- Figure 40: Middle East & Africa Continuous Variable Transmission Volume (K), by Application 2025 & 2033
- Figure 41: Middle East & Africa Continuous Variable Transmission Revenue Share (%), by Application 2025 & 2033
- Figure 42: Middle East & Africa Continuous Variable Transmission Volume Share (%), by Application 2025 & 2033
- Figure 43: Middle East & Africa Continuous Variable Transmission Revenue (undefined), by Types 2025 & 2033
- Figure 44: Middle East & Africa Continuous Variable Transmission Volume (K), by Types 2025 & 2033
- Figure 45: Middle East & Africa Continuous Variable Transmission Revenue Share (%), by Types 2025 & 2033
- Figure 46: Middle East & Africa Continuous Variable Transmission Volume Share (%), by Types 2025 & 2033
- Figure 47: Middle East & Africa Continuous Variable Transmission Revenue (undefined), by Country 2025 & 2033
- Figure 48: Middle East & Africa Continuous Variable Transmission Volume (K), by Country 2025 & 2033
- Figure 49: Middle East & Africa Continuous Variable Transmission Revenue Share (%), by Country 2025 & 2033
- Figure 50: Middle East & Africa Continuous Variable Transmission Volume Share (%), by Country 2025 & 2033
- Figure 51: Asia Pacific Continuous Variable Transmission Revenue (undefined), by Application 2025 & 2033
- Figure 52: Asia Pacific Continuous Variable Transmission Volume (K), by Application 2025 & 2033
- Figure 53: Asia Pacific Continuous Variable Transmission Revenue Share (%), by Application 2025 & 2033
- Figure 54: Asia Pacific Continuous Variable Transmission Volume Share (%), by Application 2025 & 2033
- Figure 55: Asia Pacific Continuous Variable Transmission Revenue (undefined), by Types 2025 & 2033
- Figure 56: Asia Pacific Continuous Variable Transmission Volume (K), by Types 2025 & 2033
- Figure 57: Asia Pacific Continuous Variable Transmission Revenue Share (%), by Types 2025 & 2033
- Figure 58: Asia Pacific Continuous Variable Transmission Volume Share (%), by Types 2025 & 2033
- Figure 59: Asia Pacific Continuous Variable Transmission Revenue (undefined), by Country 2025 & 2033
- Figure 60: Asia Pacific Continuous Variable Transmission Volume (K), by Country 2025 & 2033
- Figure 61: Asia Pacific Continuous Variable Transmission Revenue Share (%), by Country 2025 & 2033
- Figure 62: Asia Pacific Continuous Variable Transmission Volume Share (%), by Country 2025 & 2033
List of Tables
- Table 1: Global Continuous Variable Transmission Revenue undefined Forecast, by Application 2020 & 2033
- Table 2: Global Continuous Variable Transmission Volume K Forecast, by Application 2020 & 2033
- Table 3: Global Continuous Variable Transmission Revenue undefined Forecast, by Types 2020 & 2033
- Table 4: Global Continuous Variable Transmission Volume K Forecast, by Types 2020 & 2033
- Table 5: Global Continuous Variable Transmission Revenue undefined Forecast, by Region 2020 & 2033
- Table 6: Global Continuous Variable Transmission Volume K Forecast, by Region 2020 & 2033
- Table 7: Global Continuous Variable Transmission Revenue undefined Forecast, by Application 2020 & 2033
- Table 8: Global Continuous Variable Transmission Volume K Forecast, by Application 2020 & 2033
- Table 9: Global Continuous Variable Transmission Revenue undefined Forecast, by Types 2020 & 2033
- Table 10: Global Continuous Variable Transmission Volume K Forecast, by Types 2020 & 2033
- Table 11: Global Continuous Variable Transmission Revenue undefined Forecast, by Country 2020 & 2033
- Table 12: Global Continuous Variable Transmission Volume K Forecast, by Country 2020 & 2033
- Table 13: United States Continuous Variable Transmission Revenue (undefined) Forecast, by Application 2020 & 2033
- Table 14: United States Continuous Variable Transmission Volume (K) Forecast, by Application 2020 & 2033
- Table 15: Canada Continuous Variable Transmission Revenue (undefined) Forecast, by Application 2020 & 2033
- Table 16: Canada Continuous Variable Transmission Volume (K) Forecast, by Application 2020 & 2033
- Table 17: Mexico Continuous Variable Transmission Revenue (undefined) Forecast, by Application 2020 & 2033
- Table 18: Mexico Continuous Variable Transmission Volume (K) Forecast, by Application 2020 & 2033
- Table 19: Global Continuous Variable Transmission Revenue undefined Forecast, by Application 2020 & 2033
- Table 20: Global Continuous Variable Transmission Volume K Forecast, by Application 2020 & 2033
- Table 21: Global Continuous Variable Transmission Revenue undefined Forecast, by Types 2020 & 2033
- Table 22: Global Continuous Variable Transmission Volume K Forecast, by Types 2020 & 2033
- Table 23: Global Continuous Variable Transmission Revenue undefined Forecast, by Country 2020 & 2033
- Table 24: Global Continuous Variable Transmission Volume K Forecast, by Country 2020 & 2033
- Table 25: Brazil Continuous Variable Transmission Revenue (undefined) Forecast, by Application 2020 & 2033
- Table 26: Brazil Continuous Variable Transmission Volume (K) Forecast, by Application 2020 & 2033
- Table 27: Argentina Continuous Variable Transmission Revenue (undefined) Forecast, by Application 2020 & 2033
- Table 28: Argentina Continuous Variable Transmission Volume (K) Forecast, by Application 2020 & 2033
- Table 29: Rest of South America Continuous Variable Transmission Revenue (undefined) Forecast, by Application 2020 & 2033
- Table 30: Rest of South America Continuous Variable Transmission Volume (K) Forecast, by Application 2020 & 2033
- Table 31: Global Continuous Variable Transmission Revenue undefined Forecast, by Application 2020 & 2033
- Table 32: Global Continuous Variable Transmission Volume K Forecast, by Application 2020 & 2033
- Table 33: Global Continuous Variable Transmission Revenue undefined Forecast, by Types 2020 & 2033
- Table 34: Global Continuous Variable Transmission Volume K Forecast, by Types 2020 & 2033
- Table 35: Global Continuous Variable Transmission Revenue undefined Forecast, by Country 2020 & 2033
- Table 36: Global Continuous Variable Transmission Volume K Forecast, by Country 2020 & 2033
- Table 37: United Kingdom Continuous Variable Transmission Revenue (undefined) Forecast, by Application 2020 & 2033
- Table 38: United Kingdom Continuous Variable Transmission Volume (K) Forecast, by Application 2020 & 2033
- Table 39: Germany Continuous Variable Transmission Revenue (undefined) Forecast, by Application 2020 & 2033
- Table 40: Germany Continuous Variable Transmission Volume (K) Forecast, by Application 2020 & 2033
- Table 41: France Continuous Variable Transmission Revenue (undefined) Forecast, by Application 2020 & 2033
- Table 42: France Continuous Variable Transmission Volume (K) Forecast, by Application 2020 & 2033
- Table 43: Italy Continuous Variable Transmission Revenue (undefined) Forecast, by Application 2020 & 2033
- Table 44: Italy Continuous Variable Transmission Volume (K) Forecast, by Application 2020 & 2033
- Table 45: Spain Continuous Variable Transmission Revenue (undefined) Forecast, by Application 2020 & 2033
- Table 46: Spain Continuous Variable Transmission Volume (K) Forecast, by Application 2020 & 2033
- Table 47: Russia Continuous Variable Transmission Revenue (undefined) Forecast, by Application 2020 & 2033
- Table 48: Russia Continuous Variable Transmission Volume (K) Forecast, by Application 2020 & 2033
- Table 49: Benelux Continuous Variable Transmission Revenue (undefined) Forecast, by Application 2020 & 2033
- Table 50: Benelux Continuous Variable Transmission Volume (K) Forecast, by Application 2020 & 2033
- Table 51: Nordics Continuous Variable Transmission Revenue (undefined) Forecast, by Application 2020 & 2033
- Table 52: Nordics Continuous Variable Transmission Volume (K) Forecast, by Application 2020 & 2033
- Table 53: Rest of Europe Continuous Variable Transmission Revenue (undefined) Forecast, by Application 2020 & 2033
- Table 54: Rest of Europe Continuous Variable Transmission Volume (K) Forecast, by Application 2020 & 2033
- Table 55: Global Continuous Variable Transmission Revenue undefined Forecast, by Application 2020 & 2033
- Table 56: Global Continuous Variable Transmission Volume K Forecast, by Application 2020 & 2033
- Table 57: Global Continuous Variable Transmission Revenue undefined Forecast, by Types 2020 & 2033
- Table 58: Global Continuous Variable Transmission Volume K Forecast, by Types 2020 & 2033
- Table 59: Global Continuous Variable Transmission Revenue undefined Forecast, by Country 2020 & 2033
- Table 60: Global Continuous Variable Transmission Volume K Forecast, by Country 2020 & 2033
- Table 61: Turkey Continuous Variable Transmission Revenue (undefined) Forecast, by Application 2020 & 2033
- Table 62: Turkey Continuous Variable Transmission Volume (K) Forecast, by Application 2020 & 2033
- Table 63: Israel Continuous Variable Transmission Revenue (undefined) Forecast, by Application 2020 & 2033
- Table 64: Israel Continuous Variable Transmission Volume (K) Forecast, by Application 2020 & 2033
- Table 65: GCC Continuous Variable Transmission Revenue (undefined) Forecast, by Application 2020 & 2033
- Table 66: GCC Continuous Variable Transmission Volume (K) Forecast, by Application 2020 & 2033
- Table 67: North Africa Continuous Variable Transmission Revenue (undefined) Forecast, by Application 2020 & 2033
- Table 68: North Africa Continuous Variable Transmission Volume (K) Forecast, by Application 2020 & 2033
- Table 69: South Africa Continuous Variable Transmission Revenue (undefined) Forecast, by Application 2020 & 2033
- Table 70: South Africa Continuous Variable Transmission Volume (K) Forecast, by Application 2020 & 2033
- Table 71: Rest of Middle East & Africa Continuous Variable Transmission Revenue (undefined) Forecast, by Application 2020 & 2033
- Table 72: Rest of Middle East & Africa Continuous Variable Transmission Volume (K) Forecast, by Application 2020 & 2033
- Table 73: Global Continuous Variable Transmission Revenue undefined Forecast, by Application 2020 & 2033
- Table 74: Global Continuous Variable Transmission Volume K Forecast, by Application 2020 & 2033
- Table 75: Global Continuous Variable Transmission Revenue undefined Forecast, by Types 2020 & 2033
- Table 76: Global Continuous Variable Transmission Volume K Forecast, by Types 2020 & 2033
- Table 77: Global Continuous Variable Transmission Revenue undefined Forecast, by Country 2020 & 2033
- Table 78: Global Continuous Variable Transmission Volume K Forecast, by Country 2020 & 2033
- Table 79: China Continuous Variable Transmission Revenue (undefined) Forecast, by Application 2020 & 2033
- Table 80: China Continuous Variable Transmission Volume (K) Forecast, by Application 2020 & 2033
- Table 81: India Continuous Variable Transmission Revenue (undefined) Forecast, by Application 2020 & 2033
- Table 82: India Continuous Variable Transmission Volume (K) Forecast, by Application 2020 & 2033
- Table 83: Japan Continuous Variable Transmission Revenue (undefined) Forecast, by Application 2020 & 2033
- Table 84: Japan Continuous Variable Transmission Volume (K) Forecast, by Application 2020 & 2033
- Table 85: South Korea Continuous Variable Transmission Revenue (undefined) Forecast, by Application 2020 & 2033
- Table 86: South Korea Continuous Variable Transmission Volume (K) Forecast, by Application 2020 & 2033
- Table 87: ASEAN Continuous Variable Transmission Revenue (undefined) Forecast, by Application 2020 & 2033
- Table 88: ASEAN Continuous Variable Transmission Volume (K) Forecast, by Application 2020 & 2033
- Table 89: Oceania Continuous Variable Transmission Revenue (undefined) Forecast, by Application 2020 & 2033
- Table 90: Oceania Continuous Variable Transmission Volume (K) Forecast, by Application 2020 & 2033
- Table 91: Rest of Asia Pacific Continuous Variable Transmission Revenue (undefined) Forecast, by Application 2020 & 2033
- Table 92: Rest of Asia Pacific Continuous Variable Transmission Volume (K) Forecast, by Application 2020 & 2033
Frequently Asked Questions
1. What is the projected Compound Annual Growth Rate (CAGR) of the Continuous Variable Transmission?
The projected CAGR is approximately 3.8%.
2. Which companies are prominent players in the Continuous Variable Transmission?
Key companies in the market include ZF Friedrichshafen, Continental, Allison Transmission, Magana International, Eaton Corporation, Borg Warner, Aisin Seiki, JATCO, Schaeffler, Hyundai Dymos, Bonfiglioli RIDUTTORI, Magneti Marelli.
3. What are the main segments of the Continuous Variable Transmission?
The market segments include Application, Types.
4. Can you provide details about the market size?
The market size is estimated to be USD XXX N/A as of 2022.
5. What are some drivers contributing to market growth?
N/A
6. What are the notable trends driving market growth?
N/A
7. Are there any restraints impacting market growth?
N/A
8. Can you provide examples of recent developments in the market?
N/A
9. What pricing options are available for accessing the report?
Pricing options include single-user, multi-user, and enterprise licenses priced at USD 3350.00, USD 5025.00, and USD 6700.00 respectively.
10. Is the market size provided in terms of value or volume?
The market size is provided in terms of value, measured in N/A and volume, measured in K.
11. Are there any specific market keywords associated with the report?
Yes, the market keyword associated with the report is "Continuous Variable Transmission," which aids in identifying and referencing the specific market segment covered.
12. How do I determine which pricing option suits my needs best?
The pricing options vary based on user requirements and access needs. Individual users may opt for single-user licenses, while businesses requiring broader access may choose multi-user or enterprise licenses for cost-effective access to the report.
13. Are there any additional resources or data provided in the Continuous Variable Transmission report?
While the report offers comprehensive insights, it's advisable to review the specific contents or supplementary materials provided to ascertain if additional resources or data are available.
14. How can I stay updated on further developments or reports in the Continuous Variable Transmission?
To stay informed about further developments, trends, and reports in the Continuous Variable Transmission, consider subscribing to industry newsletters, following relevant companies and organizations, or regularly checking reputable industry news sources and publications.
Methodology
Step 1 - Identification of Relevant Samples Size from Population Database


Step 2 - Approaches for Defining Global Market Size (Value, Volume* & Price*)

Note*: In applicable scenarios
Step 3 - Data Sources
Primary Research
- Web Analytics
- Survey Reports
- Research Institute
- Latest Research Reports
- Opinion Leaders
Secondary Research
- Annual Reports
- White Paper
- Latest Press Release
- Industry Association
- Paid Database
- Investor Presentations

Step 4 - Data Triangulation
Involves using different sources of information in order to increase the validity of a study
These sources are likely to be stakeholders in a program - participants, other researchers, program staff, other community members, and so on.
Then we put all data in single framework & apply various statistical tools to find out the dynamic on the market.
During the analysis stage, feedback from the stakeholder groups would be compared to determine areas of agreement as well as areas of divergence