

Key Insights
The global Dairy Products Market is forecast to reach $1005.84 billion by 2025, expanding at a Compound Annual Growth Rate (CAGR) of 6.12% from 2019 to 2033. This growth is attributed to increasing global population, rising disposable incomes in emerging economies, and a strong consumer preference for protein-rich foods. Technological advancements in dairy processing, improving product shelf-life and variety, further contribute to market vitality. Evolving consumer lifestyles, with a greater emphasis on health and wellness, position dairy as a key dietary component. Innovations such as lactose-free and fortified dairy products are expanding the consumer base by catering to specific dietary needs.
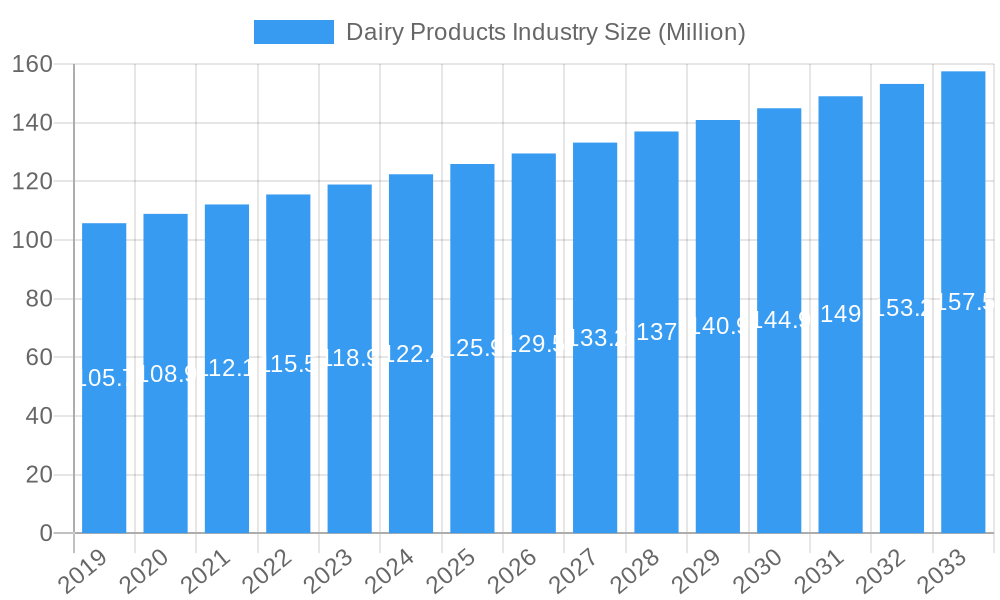
Dairy Products Industry Market Size (In Million)
The distribution of dairy products is shifting, with off-trade channels like online retail and convenience stores gaining traction. Supermarkets and hypermarkets remain dominant, while specialist retailers address niche demands. The on-trade sector, including restaurants and cafes, is vital for consumption, driven by evolving dining habits and demand for premium dairy-based offerings. The Asia Pacific region is projected to lead growth, supported by its large population and developing economies. Mature markets in North America and Europe will continue to contribute through innovation and premiumization. The Middle East & Africa and South America offer significant growth potential due to rising consumer spending and increasing awareness of dairy's nutritional benefits. Key industry players are pursuing strategic expansions, product development, and market penetration to leverage these opportunities.
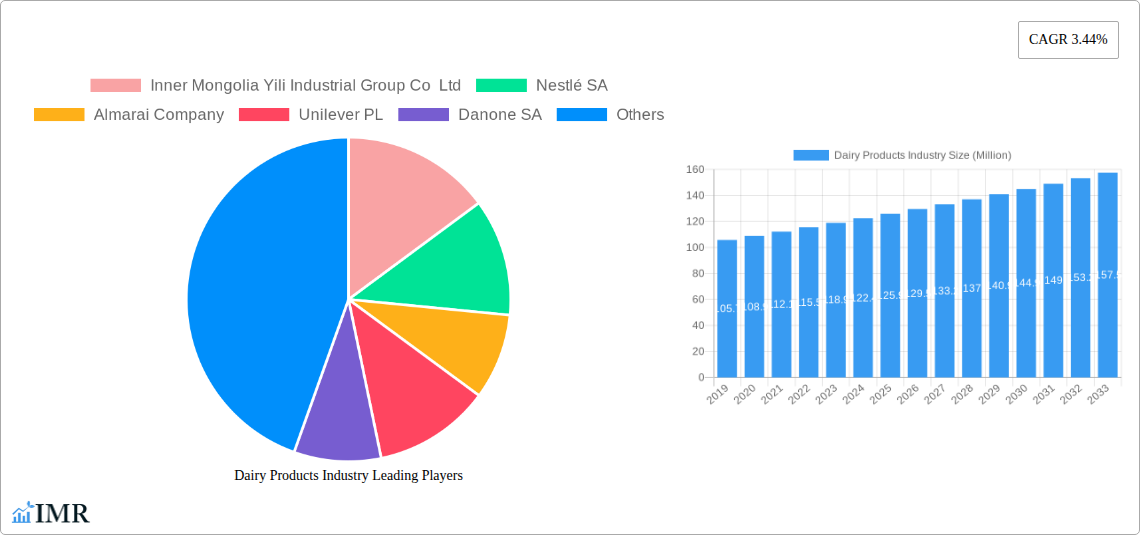
Dairy Products Industry Company Market Share
Dairy Products Industry Report: Comprehensive Market Analysis & Forecast (2019-2033)
This in-depth report provides a definitive analysis of the global Dairy Products Industry, offering critical insights into market dynamics, growth trends, regional dominance, product innovations, and key strategic initiatives. Covering the historical period of 2019-2024 and forecasting through 2033, this research is indispensable for stakeholders seeking to navigate and capitalize on opportunities within this dynamic sector. We meticulously examine market size evolution, adoption rates, technological disruptions, and shifting consumer behaviors, presenting all values in Million units. Leveraging extensive data, this report empowers strategic decision-making for manufacturers, suppliers, investors, and industry professionals worldwide.
Dairy Products Industry Market Dynamics & Structure
The Dairy Products Industry is characterized by a moderate market concentration, with several multinational corporations holding significant market shares, alongside a substantial number of regional and niche players. Key companies like Inner Mongolia Yili Industrial Group Co Ltd, Nestlé SA, Almarai Company, Unilever PL, Danone SA, Arla Foods Amba, Dairy Farmers of America Inc, Fonterra Co-operative Group Limited, Gujarat Co-operative Milk Marketing Federation Ltd, Saputo Inc, Groupe Lactalis, and China Mengniu Dairy Company Ltd are pivotal in shaping market trends. Technological innovation drivers are diverse, ranging from advanced processing techniques that enhance shelf life and nutritional value to sustainable packaging solutions and novel product formulations.
Regulatory frameworks significantly influence market operations, encompassing food safety standards, labeling requirements, and trade policies that impact both domestic and international markets. Competitive product substitutes, such as plant-based dairy alternatives, present an evolving challenge and opportunity for traditional dairy producers. End-user demographics are increasingly focused on health and wellness, leading to a growing demand for low-fat, high-protein, and functional dairy products. Mergers and acquisitions (M&A) trends reveal a strategic drive for market consolidation, product diversification, and vertical integration.
- Market Concentration: Dominated by a mix of global giants and strong regional players.
- Technological Innovation: Focus on shelf-life extension, nutritional enhancement, and sustainable production.
- Regulatory Landscape: Stringent food safety and labeling regulations are key determinants.
- Competitive Landscape: Increasing competition from plant-based alternatives.
- Consumer Demographics: Shift towards healthier, functional, and ethically produced dairy.
- M&A Trends: Consolidation and diversification as key strategic objectives.
Dairy Products Industry Growth Trends & Insights
The global Dairy Products Industry is poised for consistent growth, driven by an expanding global population, rising disposable incomes in emerging economies, and a pervasive consumer shift towards perceived healthier food choices. The market size evolution is marked by steady expansion, with a projected Compound Annual Growth Rate (CAGR) of approximately 4.5% during the forecast period (2025-2033). This growth is fueled by increasing adoption rates of value-added dairy products, such as specialized yogurts, fortified milk beverages, and premium cheeses, reflecting evolving consumer preferences and a heightened awareness of the nutritional benefits of dairy.
Technological disruptions are playing a crucial role, with advancements in ultra-high temperature (UHT) processing and aseptic packaging significantly extending product shelf life and reducing spoilage, thereby broadening market reach and accessibility. Furthermore, innovations in fermentation technologies are enabling the development of novel dairy products with enhanced probiotic content and improved digestibility, catering to specific dietary needs and health aspirations. Consumer behavior shifts are also a significant factor, with a growing demand for organic, sustainably sourced, and ethically produced dairy items. This trend is prompting manufacturers to invest in transparent supply chains and eco-friendly practices. The rise of e-commerce and online retail channels is further accelerating market penetration, providing consumers with greater convenience and access to a wider array of dairy products.
- Market Size: Projected steady expansion with a CAGR of approximately 4.5% (2025-2033).
- Adoption Rates: Increasing demand for value-added and functional dairy products.
- Technological Disruptions: UHT processing, aseptic packaging, and advanced fermentation techniques are key enablers.
- Consumer Behavior: Growing preference for organic, sustainable, and health-focused dairy options.
- Market Penetration: Enhanced by the growth of online retail and e-commerce platforms.
- Key Segments: Milk and yogurt segments are expected to lead in terms of volume and value growth.
Dominant Regions, Countries, or Segments in Dairy Products Industry
The global Dairy Products Industry is experiencing robust growth, with specific regions, countries, and product segments demonstrating remarkable dominance. Asia Pacific, particularly China, is emerging as a powerhouse, driven by a burgeoning middle class, increasing urbanization, and a cultural shift towards incorporating more dairy into daily diets. The sheer scale of the population, coupled with rising disposable incomes, fuels substantial demand across all dairy categories, especially milk and yogurt. India, with its deep-rooted dairy culture and the presence of the Gujarat Co-operative Milk Marketing Federation Ltd, also represents a significant and growing market.
Within product segments, Milk continues to be the cornerstone of the dairy market, encompassing a wide range of sub-categories like Fresh Milk, UHT Milk, and Powdered Milk. The increasing preference for convenience and longer shelf life is propelling the growth of UHT and powdered milk, particularly in developing regions. Yogurt, both flavored and unflavored, is another dominant segment, benefiting from its perception as a healthy and versatile food option. Innovations in probiotic-rich and low-sugar variants are further expanding its appeal. The Cheese segment, encompassing Natural and Processed Cheese, is also experiencing significant expansion, driven by evolving culinary trends and increased consumption in food service and retail.
- Dominant Region: Asia Pacific, led by China and India, due to population size and rising incomes.
- Dominant Country: China, a major consumer and producer of dairy products.
- Dominant Segment (Volume & Value): Milk, encompassing Fresh Milk, UHT Milk, and Powdered Milk.
- High-Growth Segment: Yogurt (Flavored and Unflavored), driven by health consciousness and innovation.
- Key Drivers in Asia Pacific: Economic growth, urbanization, evolving dietary habits, and government support for dairy development.
- Distribution Channel Dominance: Off-Trade channels, particularly Supermarkets and Hypermarkets, dominate global sales, with Online Retail rapidly gaining traction.
Dairy Products Industry Product Landscape
The Dairy Products Industry is characterized by a vibrant and evolving product landscape, driven by continuous innovation and a keen responsiveness to consumer demands. Product development is heavily focused on enhancing nutritional profiles, extending shelf life, and creating convenient, ready-to-consume options. For instance, advancements in milk processing have led to the widespread availability of UHT milk, offering extended shelf life without compromising nutritional value. In the yogurt segment, the introduction of diverse flavor profiles and the incorporation of functional ingredients like probiotics and prebiotics cater to the growing health and wellness trend.
The cheese market is seeing innovation in both natural and processed varieties, with the development of gourmet and specialty cheeses appealing to sophisticated palates, while processed cheese continues to offer convenience and versatility. Dairy desserts, including ice cream and frozen desserts, are witnessing a surge in premiumization, with unique flavor combinations and artisanal production methods. Innovations are not limited to the core product; advancements in packaging, such as sustainable materials and resealable designs, also enhance product appeal and functionality.
Key Drivers, Barriers & Challenges in Dairy Products Industry
The Dairy Products Industry is propelled by several key drivers. Growing global population directly increases demand for staple food products. A significant driver is the increasing consumer awareness of dairy's nutritional benefits, particularly its protein and calcium content, leading to higher consumption of milk, yogurt, and cheese for health and wellness purposes. Technological advancements in processing, preservation, and packaging contribute to improved product quality, extended shelf life, and wider market reach. Furthermore, economic growth in emerging markets translates into higher disposable incomes, enabling greater expenditure on food products, including dairy.
However, the industry faces notable barriers and challenges. Volatility in raw milk prices, influenced by feed costs, weather patterns, and global supply-demand dynamics, poses a significant financial risk to producers. Increasing competition from plant-based alternatives is a major challenge, as these products cater to a growing segment of consumers seeking vegan or dairy-free options. Stringent regulatory requirements related to food safety, hygiene, and labeling can increase operational costs and complexity. Supply chain disruptions, as seen during global events, can impact the availability and cost of raw materials and finished goods.
Emerging Opportunities in Dairy Products Industry
Emerging opportunities in the Dairy Products Industry are diverse and capitalize on evolving consumer preferences and technological advancements. The rising demand for functional dairy products enriched with probiotics, prebiotics, vitamins, and minerals presents a significant avenue for growth, catering to consumers actively seeking health benefits. The market for lactose-free and reduced-lactose dairy products continues to expand, addressing a common dietary intolerance and broadening accessibility.
Furthermore, there's a growing opportunity in sustainable and ethically sourced dairy, with consumers increasingly willing to pay a premium for products that demonstrate environmental responsibility and animal welfare. Innovations in plant-based dairy alternatives that mimic the taste and texture of traditional dairy are also creating a competitive yet opportunity-rich landscape, pushing dairy producers to innovate and differentiate their offerings. The expansion of e-commerce and direct-to-consumer (DTC) models offers a direct channel to reach consumers and build brand loyalty.
Growth Accelerators in the Dairy Products Industry Industry
Several key catalysts are accelerating long-term growth in the Dairy Products Industry. Technological breakthroughs in areas like precision fermentation and cellular agriculture hold the potential to revolutionize dairy production, offering more sustainable and efficient methods. Strategic partnerships and collaborations, such as those between dairy companies and technology providers, are crucial for driving innovation and market expansion.
The continuous development of value-added products that cater to specific health needs and lifestyle trends (e.g., high-protein, low-sugar, fortified options) will sustain consumer interest and drive sales. Furthermore, market expansion strategies, including targeting underserved regions and capitalizing on the growing middle class in developing economies, represent significant growth accelerators. Government initiatives supporting dairy sector development and promoting healthy eating habits also play a vital role.
Key Players Shaping the Dairy Products Industry Market
- Inner Mongolia Yili Industrial Group Co Ltd
- Nestlé SA
- Almarai Company
- Unilever PL
- Danone SA
- Arla Foods Amba
- Dairy Farmers of America Inc
- Fonterra Co-operative Group Limited
- Gujarat Co-operative Milk Marketing Federation Ltd
- Saputo Inc
- Groupe Lactalis
- China Mengniu Dairy Company Ltd
Notable Milestones in Dairy Products Industry Sector
- September 2023: China Mengniu acquired organic infant formula producer Bellamy's Australia for USD 1 billion, strengthening its position in the premium infant nutrition market.
- October 2022: Unilever partnered with ASAP for the distribution of its ice cream goods. This collaboration extended to ASAP delivering ice cream and treats from Unilever's virtual storefront, The Ice Cream Shop, enhancing online convenience.
- August 2022: Dairy Farmers of America acquired two shelf-extended facilities of SmithFoods. This strategic acquisition aimed to capitalize on the market's growing demand for products with extended shelf lives, enhancing operational capacity and market responsiveness.
In-Depth Dairy Products Industry Market Outlook
The Dairy Products Industry market outlook is exceptionally positive, characterized by robust growth fueled by sustained demand for nutritious food products and ongoing innovation. The increasing global population, coupled with rising disposable incomes in developing economies, will continue to drive volume consumption across all dairy categories. Opportunities lie in the expansion of value-added and functional dairy products that cater to specific health and wellness needs, such as probiotic-rich yogurts and protein-fortified milk. Furthermore, the increasing consumer preference for sustainable and ethically produced goods presents a significant avenue for differentiation and premiumization. Strategic investments in advanced processing technologies, efficient supply chain management, and targeted marketing campaigns in emerging markets will be crucial for capitalizing on future growth potential and solidifying market leadership.
Dairy Products Industry Segmentation
-
1. Category
-
1.1. Butter
-
1.1.1. By Product Type
- 1.1.1.1. Cultured Butter
- 1.1.1.2. Uncultured Butter
-
1.1.1. By Product Type
-
1.2. Cheese
- 1.2.1. Natural Cheese
- 1.2.2. Processed Cheese
-
1.3. Cream
- 1.3.1. Double Cream
- 1.3.2. Single Cream
- 1.3.3. Whipping Cream
- 1.3.4. Others
-
1.4. Dairy Desserts
- 1.4.1. Cheesecakes
- 1.4.2. Frozen Desserts
- 1.4.3. Ice Cream
- 1.4.4. Mousses
-
1.5. Milk
- 1.5.1. Condensed milk
- 1.5.2. Flavored Milk
- 1.5.3. Fresh Milk
- 1.5.4. Powdered Milk
- 1.5.5. UHT Milk
- 1.6. Sour Milk Drinks
-
1.7. Yogurt
- 1.7.1. Flavored Yogurt
- 1.7.2. Unflavored Yogurt
-
1.1. Butter
-
2. Distribution Channel
-
2.1. Off-Trade
- 2.1.1. Convenience Stores
- 2.1.2. Online Retail
- 2.1.3. Specialist Retailers
- 2.1.4. Supermarkets and Hypermarkets
- 2.1.5. Others (Warehouse clubs, gas stations, etc.)
- 2.2. On-Trade
-
2.1. Off-Trade
Dairy Products Industry Segmentation By Geography
-
1. North America
- 1.1. United States
- 1.2. Canada
- 1.3. Mexico
-
2. South America
- 2.1. Brazil
- 2.2. Argentina
- 2.3. Rest of South America
-
3. Europe
- 3.1. United Kingdom
- 3.2. Germany
- 3.3. France
- 3.4. Italy
- 3.5. Spain
- 3.6. Russia
- 3.7. Benelux
- 3.8. Nordics
- 3.9. Rest of Europe
-
4. Middle East & Africa
- 4.1. Turkey
- 4.2. Israel
- 4.3. GCC
- 4.4. North Africa
- 4.5. South Africa
- 4.6. Rest of Middle East & Africa
-
5. Asia Pacific
- 5.1. China
- 5.2. India
- 5.3. Japan
- 5.4. South Korea
- 5.5. ASEAN
- 5.6. Oceania
- 5.7. Rest of Asia Pacific
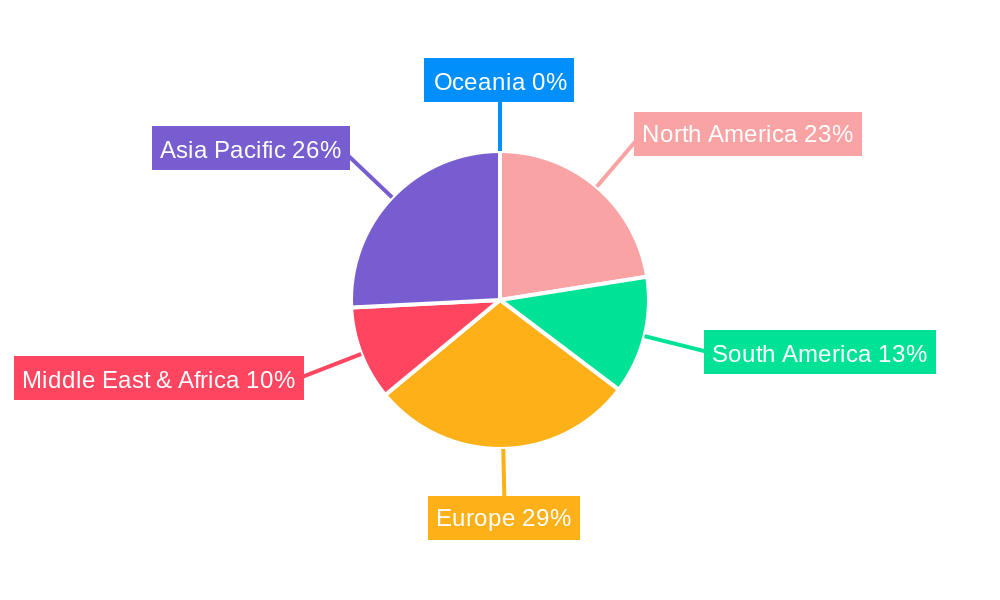
Dairy Products Industry Regional Market Share
Geographic Coverage of Dairy Products Industry
Dairy Products Industry REPORT HIGHLIGHTS
| Aspects | Details |
|---|---|
| Study Period | 2020-2034 |
| Base Year | 2025 |
| Estimated Year | 2026 |
| Forecast Period | 2026-2034 |
| Historical Period | 2020-2025 |
| Growth Rate | CAGR of 6.12% from 2020-2034 |
| Segmentation |
|
Table of Contents
- 1. Introduction
- 1.1. Research Scope
- 1.2. Market Segmentation
- 1.3. Research Objective
- 1.4. Definitions and Assumptions
- 2. Executive Summary
- 2.1. Market Snapshot
- 3. Market Dynamics
- 3.1. Market Drivers
- 3.2. Market Restrains
- 3.3. Market Trends
- 3.4. Market Opportunities
- 4. Market Factor Analysis
- 4.1. Porters Five Forces
- 4.1.1. Bargaining Power of Suppliers
- 4.1.2. Bargaining Power of Buyers
- 4.1.3. Threat of New Entrants
- 4.1.4. Threat of Substitutes
- 4.1.5. Competitive Rivalry
- 4.2. PESTEL analysis
- 4.3. BCG Analysis
- 4.3.1. Stars (High Growth, High Market Share)
- 4.3.2. Cash Cows (Low Growth, High Market Share)
- 4.3.3. Question Mark (High Growth, Low Market Share)
- 4.3.4. Dogs (Low Growth, Low Market Share)
- 4.4. Ansoff Matrix Analysis
- 4.5. Supply Chain Analysis
- 4.6. Regulatory Landscape
- 4.7. Current Market Potential and Opportunity Assessment (TAM–SAM–SOM Framework)
- 4.8. IMR Analyst Note
- 4.1. Porters Five Forces
- 5. Market Analysis, Insights and Forecast 2021-2033
- 5.1. Market Analysis, Insights and Forecast - by Category
- 5.1.1. Butter
- 5.1.1.1. By Product Type
- 5.1.1.1.1. Cultured Butter
- 5.1.1.1.2. Uncultured Butter
- 5.1.1.1. By Product Type
- 5.1.2. Cheese
- 5.1.2.1. Natural Cheese
- 5.1.2.2. Processed Cheese
- 5.1.3. Cream
- 5.1.3.1. Double Cream
- 5.1.3.2. Single Cream
- 5.1.3.3. Whipping Cream
- 5.1.3.4. Others
- 5.1.4. Dairy Desserts
- 5.1.4.1. Cheesecakes
- 5.1.4.2. Frozen Desserts
- 5.1.4.3. Ice Cream
- 5.1.4.4. Mousses
- 5.1.5. Milk
- 5.1.5.1. Condensed milk
- 5.1.5.2. Flavored Milk
- 5.1.5.3. Fresh Milk
- 5.1.5.4. Powdered Milk
- 5.1.5.5. UHT Milk
- 5.1.6. Sour Milk Drinks
- 5.1.7. Yogurt
- 5.1.7.1. Flavored Yogurt
- 5.1.7.2. Unflavored Yogurt
- 5.1.1. Butter
- 5.2. Market Analysis, Insights and Forecast - by Distribution Channel
- 5.2.1. Off-Trade
- 5.2.1.1. Convenience Stores
- 5.2.1.2. Online Retail
- 5.2.1.3. Specialist Retailers
- 5.2.1.4. Supermarkets and Hypermarkets
- 5.2.1.5. Others (Warehouse clubs, gas stations, etc.)
- 5.2.2. On-Trade
- 5.2.1. Off-Trade
- 5.3. Market Analysis, Insights and Forecast - by Region
- 5.3.1. North America
- 5.3.2. South America
- 5.3.3. Europe
- 5.3.4. Middle East & Africa
- 5.3.5. Asia Pacific
- 5.1. Market Analysis, Insights and Forecast - by Category
- 6. Global Dairy Products Industry Analysis, Insights and Forecast, 2021-2033
- 6.1. Market Analysis, Insights and Forecast - by Category
- 6.1.1. Butter
- 6.1.1.1. By Product Type
- 6.1.1.1.1. Cultured Butter
- 6.1.1.1.2. Uncultured Butter
- 6.1.1.1. By Product Type
- 6.1.2. Cheese
- 6.1.2.1. Natural Cheese
- 6.1.2.2. Processed Cheese
- 6.1.3. Cream
- 6.1.3.1. Double Cream
- 6.1.3.2. Single Cream
- 6.1.3.3. Whipping Cream
- 6.1.3.4. Others
- 6.1.4. Dairy Desserts
- 6.1.4.1. Cheesecakes
- 6.1.4.2. Frozen Desserts
- 6.1.4.3. Ice Cream
- 6.1.4.4. Mousses
- 6.1.5. Milk
- 6.1.5.1. Condensed milk
- 6.1.5.2. Flavored Milk
- 6.1.5.3. Fresh Milk
- 6.1.5.4. Powdered Milk
- 6.1.5.5. UHT Milk
- 6.1.6. Sour Milk Drinks
- 6.1.7. Yogurt
- 6.1.7.1. Flavored Yogurt
- 6.1.7.2. Unflavored Yogurt
- 6.1.1. Butter
- 6.2. Market Analysis, Insights and Forecast - by Distribution Channel
- 6.2.1. Off-Trade
- 6.2.1.1. Convenience Stores
- 6.2.1.2. Online Retail
- 6.2.1.3. Specialist Retailers
- 6.2.1.4. Supermarkets and Hypermarkets
- 6.2.1.5. Others (Warehouse clubs, gas stations, etc.)
- 6.2.2. On-Trade
- 6.2.1. Off-Trade
- 6.1. Market Analysis, Insights and Forecast - by Category
- 7. North America Dairy Products Industry Analysis, Insights and Forecast, 2020-2032
- 7.1. Market Analysis, Insights and Forecast - by Category
- 7.1.1. Butter
- 7.1.1.1. By Product Type
- 7.1.1.1.1. Cultured Butter
- 7.1.1.1.2. Uncultured Butter
- 7.1.1.1. By Product Type
- 7.1.2. Cheese
- 7.1.2.1. Natural Cheese
- 7.1.2.2. Processed Cheese
- 7.1.3. Cream
- 7.1.3.1. Double Cream
- 7.1.3.2. Single Cream
- 7.1.3.3. Whipping Cream
- 7.1.3.4. Others
- 7.1.4. Dairy Desserts
- 7.1.4.1. Cheesecakes
- 7.1.4.2. Frozen Desserts
- 7.1.4.3. Ice Cream
- 7.1.4.4. Mousses
- 7.1.5. Milk
- 7.1.5.1. Condensed milk
- 7.1.5.2. Flavored Milk
- 7.1.5.3. Fresh Milk
- 7.1.5.4. Powdered Milk
- 7.1.5.5. UHT Milk
- 7.1.6. Sour Milk Drinks
- 7.1.7. Yogurt
- 7.1.7.1. Flavored Yogurt
- 7.1.7.2. Unflavored Yogurt
- 7.1.1. Butter
- 7.2. Market Analysis, Insights and Forecast - by Distribution Channel
- 7.2.1. Off-Trade
- 7.2.1.1. Convenience Stores
- 7.2.1.2. Online Retail
- 7.2.1.3. Specialist Retailers
- 7.2.1.4. Supermarkets and Hypermarkets
- 7.2.1.5. Others (Warehouse clubs, gas stations, etc.)
- 7.2.2. On-Trade
- 7.2.1. Off-Trade
- 7.1. Market Analysis, Insights and Forecast - by Category
- 8. South America Dairy Products Industry Analysis, Insights and Forecast, 2020-2032
- 8.1. Market Analysis, Insights and Forecast - by Category
- 8.1.1. Butter
- 8.1.1.1. By Product Type
- 8.1.1.1.1. Cultured Butter
- 8.1.1.1.2. Uncultured Butter
- 8.1.1.1. By Product Type
- 8.1.2. Cheese
- 8.1.2.1. Natural Cheese
- 8.1.2.2. Processed Cheese
- 8.1.3. Cream
- 8.1.3.1. Double Cream
- 8.1.3.2. Single Cream
- 8.1.3.3. Whipping Cream
- 8.1.3.4. Others
- 8.1.4. Dairy Desserts
- 8.1.4.1. Cheesecakes
- 8.1.4.2. Frozen Desserts
- 8.1.4.3. Ice Cream
- 8.1.4.4. Mousses
- 8.1.5. Milk
- 8.1.5.1. Condensed milk
- 8.1.5.2. Flavored Milk
- 8.1.5.3. Fresh Milk
- 8.1.5.4. Powdered Milk
- 8.1.5.5. UHT Milk
- 8.1.6. Sour Milk Drinks
- 8.1.7. Yogurt
- 8.1.7.1. Flavored Yogurt
- 8.1.7.2. Unflavored Yogurt
- 8.1.1. Butter
- 8.2. Market Analysis, Insights and Forecast - by Distribution Channel
- 8.2.1. Off-Trade
- 8.2.1.1. Convenience Stores
- 8.2.1.2. Online Retail
- 8.2.1.3. Specialist Retailers
- 8.2.1.4. Supermarkets and Hypermarkets
- 8.2.1.5. Others (Warehouse clubs, gas stations, etc.)
- 8.2.2. On-Trade
- 8.2.1. Off-Trade
- 8.1. Market Analysis, Insights and Forecast - by Category
- 9. Europe Dairy Products Industry Analysis, Insights and Forecast, 2020-2032
- 9.1. Market Analysis, Insights and Forecast - by Category
- 9.1.1. Butter
- 9.1.1.1. By Product Type
- 9.1.1.1.1. Cultured Butter
- 9.1.1.1.2. Uncultured Butter
- 9.1.1.1. By Product Type
- 9.1.2. Cheese
- 9.1.2.1. Natural Cheese
- 9.1.2.2. Processed Cheese
- 9.1.3. Cream
- 9.1.3.1. Double Cream
- 9.1.3.2. Single Cream
- 9.1.3.3. Whipping Cream
- 9.1.3.4. Others
- 9.1.4. Dairy Desserts
- 9.1.4.1. Cheesecakes
- 9.1.4.2. Frozen Desserts
- 9.1.4.3. Ice Cream
- 9.1.4.4. Mousses
- 9.1.5. Milk
- 9.1.5.1. Condensed milk
- 9.1.5.2. Flavored Milk
- 9.1.5.3. Fresh Milk
- 9.1.5.4. Powdered Milk
- 9.1.5.5. UHT Milk
- 9.1.6. Sour Milk Drinks
- 9.1.7. Yogurt
- 9.1.7.1. Flavored Yogurt
- 9.1.7.2. Unflavored Yogurt
- 9.1.1. Butter
- 9.2. Market Analysis, Insights and Forecast - by Distribution Channel
- 9.2.1. Off-Trade
- 9.2.1.1. Convenience Stores
- 9.2.1.2. Online Retail
- 9.2.1.3. Specialist Retailers
- 9.2.1.4. Supermarkets and Hypermarkets
- 9.2.1.5. Others (Warehouse clubs, gas stations, etc.)
- 9.2.2. On-Trade
- 9.2.1. Off-Trade
- 9.1. Market Analysis, Insights and Forecast - by Category
- 10. Middle East & Africa Dairy Products Industry Analysis, Insights and Forecast, 2020-2032
- 10.1. Market Analysis, Insights and Forecast - by Category
- 10.1.1. Butter
- 10.1.1.1. By Product Type
- 10.1.1.1.1. Cultured Butter
- 10.1.1.1.2. Uncultured Butter
- 10.1.1.1. By Product Type
- 10.1.2. Cheese
- 10.1.2.1. Natural Cheese
- 10.1.2.2. Processed Cheese
- 10.1.3. Cream
- 10.1.3.1. Double Cream
- 10.1.3.2. Single Cream
- 10.1.3.3. Whipping Cream
- 10.1.3.4. Others
- 10.1.4. Dairy Desserts
- 10.1.4.1. Cheesecakes
- 10.1.4.2. Frozen Desserts
- 10.1.4.3. Ice Cream
- 10.1.4.4. Mousses
- 10.1.5. Milk
- 10.1.5.1. Condensed milk
- 10.1.5.2. Flavored Milk
- 10.1.5.3. Fresh Milk
- 10.1.5.4. Powdered Milk
- 10.1.5.5. UHT Milk
- 10.1.6. Sour Milk Drinks
- 10.1.7. Yogurt
- 10.1.7.1. Flavored Yogurt
- 10.1.7.2. Unflavored Yogurt
- 10.1.1. Butter
- 10.2. Market Analysis, Insights and Forecast - by Distribution Channel
- 10.2.1. Off-Trade
- 10.2.1.1. Convenience Stores
- 10.2.1.2. Online Retail
- 10.2.1.3. Specialist Retailers
- 10.2.1.4. Supermarkets and Hypermarkets
- 10.2.1.5. Others (Warehouse clubs, gas stations, etc.)
- 10.2.2. On-Trade
- 10.2.1. Off-Trade
- 10.1. Market Analysis, Insights and Forecast - by Category
- 11. Asia Pacific Dairy Products Industry Analysis, Insights and Forecast, 2020-2032
- 11.1. Market Analysis, Insights and Forecast - by Category
- 11.1.1. Butter
- 11.1.1.1. By Product Type
- 11.1.1.1.1. Cultured Butter
- 11.1.1.1.2. Uncultured Butter
- 11.1.1.1. By Product Type
- 11.1.2. Cheese
- 11.1.2.1. Natural Cheese
- 11.1.2.2. Processed Cheese
- 11.1.3. Cream
- 11.1.3.1. Double Cream
- 11.1.3.2. Single Cream
- 11.1.3.3. Whipping Cream
- 11.1.3.4. Others
- 11.1.4. Dairy Desserts
- 11.1.4.1. Cheesecakes
- 11.1.4.2. Frozen Desserts
- 11.1.4.3. Ice Cream
- 11.1.4.4. Mousses
- 11.1.5. Milk
- 11.1.5.1. Condensed milk
- 11.1.5.2. Flavored Milk
- 11.1.5.3. Fresh Milk
- 11.1.5.4. Powdered Milk
- 11.1.5.5. UHT Milk
- 11.1.6. Sour Milk Drinks
- 11.1.7. Yogurt
- 11.1.7.1. Flavored Yogurt
- 11.1.7.2. Unflavored Yogurt
- 11.1.1. Butter
- 11.2. Market Analysis, Insights and Forecast - by Distribution Channel
- 11.2.1. Off-Trade
- 11.2.1.1. Convenience Stores
- 11.2.1.2. Online Retail
- 11.2.1.3. Specialist Retailers
- 11.2.1.4. Supermarkets and Hypermarkets
- 11.2.1.5. Others (Warehouse clubs, gas stations, etc.)
- 11.2.2. On-Trade
- 11.2.1. Off-Trade
- 11.1. Market Analysis, Insights and Forecast - by Category
- 12. Competitive Analysis
- 12.1. Company Profiles
- 12.1.1 Inner Mongolia Yili Industrial Group Co Ltd
- 12.1.1.1. Company Overview
- 12.1.1.2. Products
- 12.1.1.3. Company Financials
- 12.1.1.4. SWOT Analysis
- 12.1.2 Nestlé SA
- 12.1.2.1. Company Overview
- 12.1.2.2. Products
- 12.1.2.3. Company Financials
- 12.1.2.4. SWOT Analysis
- 12.1.3 Almarai Company
- 12.1.3.1. Company Overview
- 12.1.3.2. Products
- 12.1.3.3. Company Financials
- 12.1.3.4. SWOT Analysis
- 12.1.4 Unilever PL
- 12.1.4.1. Company Overview
- 12.1.4.2. Products
- 12.1.4.3. Company Financials
- 12.1.4.4. SWOT Analysis
- 12.1.5 Danone SA
- 12.1.5.1. Company Overview
- 12.1.5.2. Products
- 12.1.5.3. Company Financials
- 12.1.5.4. SWOT Analysis
- 12.1.6 Arla Foods Amba
- 12.1.6.1. Company Overview
- 12.1.6.2. Products
- 12.1.6.3. Company Financials
- 12.1.6.4. SWOT Analysis
- 12.1.7 Dairy Farmers of America Inc
- 12.1.7.1. Company Overview
- 12.1.7.2. Products
- 12.1.7.3. Company Financials
- 12.1.7.4. SWOT Analysis
- 12.1.8 Fonterra Co-operative Group Limited
- 12.1.8.1. Company Overview
- 12.1.8.2. Products
- 12.1.8.3. Company Financials
- 12.1.8.4. SWOT Analysis
- 12.1.9 Gujarat Co-operative Milk Marketing Federation Ltd
- 12.1.9.1. Company Overview
- 12.1.9.2. Products
- 12.1.9.3. Company Financials
- 12.1.9.4. SWOT Analysis
- 12.1.10 Saputo Inc
- 12.1.10.1. Company Overview
- 12.1.10.2. Products
- 12.1.10.3. Company Financials
- 12.1.10.4. SWOT Analysis
- 12.1.11 Groupe Lactalis
- 12.1.11.1. Company Overview
- 12.1.11.2. Products
- 12.1.11.3. Company Financials
- 12.1.11.4. SWOT Analysis
- 12.1.12 China Mengniu Dairy Company Ltd
- 12.1.12.1. Company Overview
- 12.1.12.2. Products
- 12.1.12.3. Company Financials
- 12.1.12.4. SWOT Analysis
- 12.1.1 Inner Mongolia Yili Industrial Group Co Ltd
- 12.2. Market Entropy
- 12.2.1 Company's Key Areas Served
- 12.2.2 Recent Developments
- 12.3. Company Market Share Analysis 2025
- 12.3.1 Top 5 Companies Market Share Analysis
- 12.3.2 Top 3 Companies Market Share Analysis
- 12.4. List of Potential Customers
- 13. Research Methodology
List of Figures
- Figure 1: Global Dairy Products Industry Revenue Breakdown (billion, %) by Region 2025 & 2033
- Figure 2: North America Dairy Products Industry Revenue (billion), by Category 2025 & 2033
- Figure 3: North America Dairy Products Industry Revenue Share (%), by Category 2025 & 2033
- Figure 4: North America Dairy Products Industry Revenue (billion), by Distribution Channel 2025 & 2033
- Figure 5: North America Dairy Products Industry Revenue Share (%), by Distribution Channel 2025 & 2033
- Figure 6: North America Dairy Products Industry Revenue (billion), by Country 2025 & 2033
- Figure 7: North America Dairy Products Industry Revenue Share (%), by Country 2025 & 2033
- Figure 8: South America Dairy Products Industry Revenue (billion), by Category 2025 & 2033
- Figure 9: South America Dairy Products Industry Revenue Share (%), by Category 2025 & 2033
- Figure 10: South America Dairy Products Industry Revenue (billion), by Distribution Channel 2025 & 2033
- Figure 11: South America Dairy Products Industry Revenue Share (%), by Distribution Channel 2025 & 2033
- Figure 12: South America Dairy Products Industry Revenue (billion), by Country 2025 & 2033
- Figure 13: South America Dairy Products Industry Revenue Share (%), by Country 2025 & 2033
- Figure 14: Europe Dairy Products Industry Revenue (billion), by Category 2025 & 2033
- Figure 15: Europe Dairy Products Industry Revenue Share (%), by Category 2025 & 2033
- Figure 16: Europe Dairy Products Industry Revenue (billion), by Distribution Channel 2025 & 2033
- Figure 17: Europe Dairy Products Industry Revenue Share (%), by Distribution Channel 2025 & 2033
- Figure 18: Europe Dairy Products Industry Revenue (billion), by Country 2025 & 2033
- Figure 19: Europe Dairy Products Industry Revenue Share (%), by Country 2025 & 2033
- Figure 20: Middle East & Africa Dairy Products Industry Revenue (billion), by Category 2025 & 2033
- Figure 21: Middle East & Africa Dairy Products Industry Revenue Share (%), by Category 2025 & 2033
- Figure 22: Middle East & Africa Dairy Products Industry Revenue (billion), by Distribution Channel 2025 & 2033
- Figure 23: Middle East & Africa Dairy Products Industry Revenue Share (%), by Distribution Channel 2025 & 2033
- Figure 24: Middle East & Africa Dairy Products Industry Revenue (billion), by Country 2025 & 2033
- Figure 25: Middle East & Africa Dairy Products Industry Revenue Share (%), by Country 2025 & 2033
- Figure 26: Asia Pacific Dairy Products Industry Revenue (billion), by Category 2025 & 2033
- Figure 27: Asia Pacific Dairy Products Industry Revenue Share (%), by Category 2025 & 2033
- Figure 28: Asia Pacific Dairy Products Industry Revenue (billion), by Distribution Channel 2025 & 2033
- Figure 29: Asia Pacific Dairy Products Industry Revenue Share (%), by Distribution Channel 2025 & 2033
- Figure 30: Asia Pacific Dairy Products Industry Revenue (billion), by Country 2025 & 2033
- Figure 31: Asia Pacific Dairy Products Industry Revenue Share (%), by Country 2025 & 2033
List of Tables
- Table 1: Global Dairy Products Industry Revenue billion Forecast, by Category 2020 & 2033
- Table 2: Global Dairy Products Industry Revenue billion Forecast, by Distribution Channel 2020 & 2033
- Table 3: Global Dairy Products Industry Revenue billion Forecast, by Region 2020 & 2033
- Table 4: Global Dairy Products Industry Revenue billion Forecast, by Category 2020 & 2033
- Table 5: Global Dairy Products Industry Revenue billion Forecast, by Distribution Channel 2020 & 2033
- Table 6: Global Dairy Products Industry Revenue billion Forecast, by Country 2020 & 2033
- Table 7: United States Dairy Products Industry Revenue (billion) Forecast, by Application 2020 & 2033
- Table 8: Canada Dairy Products Industry Revenue (billion) Forecast, by Application 2020 & 2033
- Table 9: Mexico Dairy Products Industry Revenue (billion) Forecast, by Application 2020 & 2033
- Table 10: Global Dairy Products Industry Revenue billion Forecast, by Category 2020 & 2033
- Table 11: Global Dairy Products Industry Revenue billion Forecast, by Distribution Channel 2020 & 2033
- Table 12: Global Dairy Products Industry Revenue billion Forecast, by Country 2020 & 2033
- Table 13: Brazil Dairy Products Industry Revenue (billion) Forecast, by Application 2020 & 2033
- Table 14: Argentina Dairy Products Industry Revenue (billion) Forecast, by Application 2020 & 2033
- Table 15: Rest of South America Dairy Products Industry Revenue (billion) Forecast, by Application 2020 & 2033
- Table 16: Global Dairy Products Industry Revenue billion Forecast, by Category 2020 & 2033
- Table 17: Global Dairy Products Industry Revenue billion Forecast, by Distribution Channel 2020 & 2033
- Table 18: Global Dairy Products Industry Revenue billion Forecast, by Country 2020 & 2033
- Table 19: United Kingdom Dairy Products Industry Revenue (billion) Forecast, by Application 2020 & 2033
- Table 20: Germany Dairy Products Industry Revenue (billion) Forecast, by Application 2020 & 2033
- Table 21: France Dairy Products Industry Revenue (billion) Forecast, by Application 2020 & 2033
- Table 22: Italy Dairy Products Industry Revenue (billion) Forecast, by Application 2020 & 2033
- Table 23: Spain Dairy Products Industry Revenue (billion) Forecast, by Application 2020 & 2033
- Table 24: Russia Dairy Products Industry Revenue (billion) Forecast, by Application 2020 & 2033
- Table 25: Benelux Dairy Products Industry Revenue (billion) Forecast, by Application 2020 & 2033
- Table 26: Nordics Dairy Products Industry Revenue (billion) Forecast, by Application 2020 & 2033
- Table 27: Rest of Europe Dairy Products Industry Revenue (billion) Forecast, by Application 2020 & 2033
- Table 28: Global Dairy Products Industry Revenue billion Forecast, by Category 2020 & 2033
- Table 29: Global Dairy Products Industry Revenue billion Forecast, by Distribution Channel 2020 & 2033
- Table 30: Global Dairy Products Industry Revenue billion Forecast, by Country 2020 & 2033
- Table 31: Turkey Dairy Products Industry Revenue (billion) Forecast, by Application 2020 & 2033
- Table 32: Israel Dairy Products Industry Revenue (billion) Forecast, by Application 2020 & 2033
- Table 33: GCC Dairy Products Industry Revenue (billion) Forecast, by Application 2020 & 2033
- Table 34: North Africa Dairy Products Industry Revenue (billion) Forecast, by Application 2020 & 2033
- Table 35: South Africa Dairy Products Industry Revenue (billion) Forecast, by Application 2020 & 2033
- Table 36: Rest of Middle East & Africa Dairy Products Industry Revenue (billion) Forecast, by Application 2020 & 2033
- Table 37: Global Dairy Products Industry Revenue billion Forecast, by Category 2020 & 2033
- Table 38: Global Dairy Products Industry Revenue billion Forecast, by Distribution Channel 2020 & 2033
- Table 39: Global Dairy Products Industry Revenue billion Forecast, by Country 2020 & 2033
- Table 40: China Dairy Products Industry Revenue (billion) Forecast, by Application 2020 & 2033
- Table 41: India Dairy Products Industry Revenue (billion) Forecast, by Application 2020 & 2033
- Table 42: Japan Dairy Products Industry Revenue (billion) Forecast, by Application 2020 & 2033
- Table 43: South Korea Dairy Products Industry Revenue (billion) Forecast, by Application 2020 & 2033
- Table 44: ASEAN Dairy Products Industry Revenue (billion) Forecast, by Application 2020 & 2033
- Table 45: Oceania Dairy Products Industry Revenue (billion) Forecast, by Application 2020 & 2033
- Table 46: Rest of Asia Pacific Dairy Products Industry Revenue (billion) Forecast, by Application 2020 & 2033
Frequently Asked Questions
1. What is the projected Compound Annual Growth Rate (CAGR) of the Dairy Products Industry?
The projected CAGR is approximately 6.12%.
2. Which companies are prominent players in the Dairy Products Industry?
Key companies in the market include Inner Mongolia Yili Industrial Group Co Ltd, Nestlé SA, Almarai Company, Unilever PL, Danone SA, Arla Foods Amba, Dairy Farmers of America Inc, Fonterra Co-operative Group Limited, Gujarat Co-operative Milk Marketing Federation Ltd, Saputo Inc, Groupe Lactalis, China Mengniu Dairy Company Ltd.
3. What are the main segments of the Dairy Products Industry?
The market segments include Category, Distribution Channel.
4. Can you provide details about the market size?
The market size is estimated to be USD 1005.84 billion as of 2022.
5. What are some drivers contributing to market growth?
Rising Demand for Clean Label Food & Beverage Products; Rising Demand for Dairy Products.
6. What are the notable trends driving market growth?
OTHER KEY INDUSTRY TRENDS COVERED IN THE REPORT.
7. Are there any restraints impacting market growth?
Presence of Preservatives in Ready Meals may Hamper the Market Growth.
8. Can you provide examples of recent developments in the market?
September 2023: China Mengniu acquired organic infant formula producer Bellamy's Australia for USD 1 billion.October 2022: Unilever partnered with ASAP for the distribution of its ice cream goods. As per the partnership, ASAP will also deliver ice cream and treats from Unilever's virtual storefront, The Ice Cream Shop.August 2022: Dairy Farmers of America acquired two shelf-extended facilities of SmithFoods. The strategy of this acquisition was to assist the corporation in capitalizing on the market's growing demand for products with extended shelf lives.
9. What pricing options are available for accessing the report?
Pricing options include single-user, multi-user, and enterprise licenses priced at USD 3800, USD 4500, and USD 5800 respectively.
10. Is the market size provided in terms of value or volume?
The market size is provided in terms of value, measured in billion.
11. Are there any specific market keywords associated with the report?
Yes, the market keyword associated with the report is "Dairy Products Industry," which aids in identifying and referencing the specific market segment covered.
12. How do I determine which pricing option suits my needs best?
The pricing options vary based on user requirements and access needs. Individual users may opt for single-user licenses, while businesses requiring broader access may choose multi-user or enterprise licenses for cost-effective access to the report.
13. Are there any additional resources or data provided in the Dairy Products Industry report?
While the report offers comprehensive insights, it's advisable to review the specific contents or supplementary materials provided to ascertain if additional resources or data are available.
14. How can I stay updated on further developments or reports in the Dairy Products Industry?
To stay informed about further developments, trends, and reports in the Dairy Products Industry, consider subscribing to industry newsletters, following relevant companies and organizations, or regularly checking reputable industry news sources and publications.
Methodology
Step 1 - Identification of Relevant Samples Size from Population Database


Step 2 - Approaches for Defining Global Market Size (Value, Volume* & Price*)

Note*: In applicable scenarios
Step 3 - Data Sources
Primary Research
- Web Analytics
- Survey Reports
- Research Institute
- Latest Research Reports
- Opinion Leaders
Secondary Research
- Annual Reports
- White Paper
- Latest Press Release
- Industry Association
- Paid Database
- Investor Presentations

Step 4 - Data Triangulation
Involves using different sources of information in order to increase the validity of a study
These sources are likely to be stakeholders in a program - participants, other researchers, program staff, other community members, and so on.
Then we put all data in single framework & apply various statistical tools to find out the dynamic on the market.
During the analysis stage, feedback from the stakeholder groups would be compared to determine areas of agreement as well as areas of divergence