

Key Insights
The electric campervan market is experiencing significant growth, driven by increasing consumer demand for sustainable and eco-friendly travel options, coupled with advancements in electric vehicle technology and charging infrastructure. The market, while relatively nascent, is projected to expand rapidly over the next decade. Factors such as rising fuel prices, government incentives promoting electric vehicles, and the inherent appeal of campervan travel contribute to this upward trajectory. Key players like Mercedes-Benz, Tesla, and Volkswagen are actively developing and launching electric campervan models, signifying the market's potential and attracting further investment. However, challenges remain, including the relatively high initial cost of electric campervans compared to their gasoline counterparts, limited driving range on a single charge, and the uneven distribution of charging stations, particularly in remote areas popular for campervan travel. Overcoming these restraints will be crucial for sustained market growth.
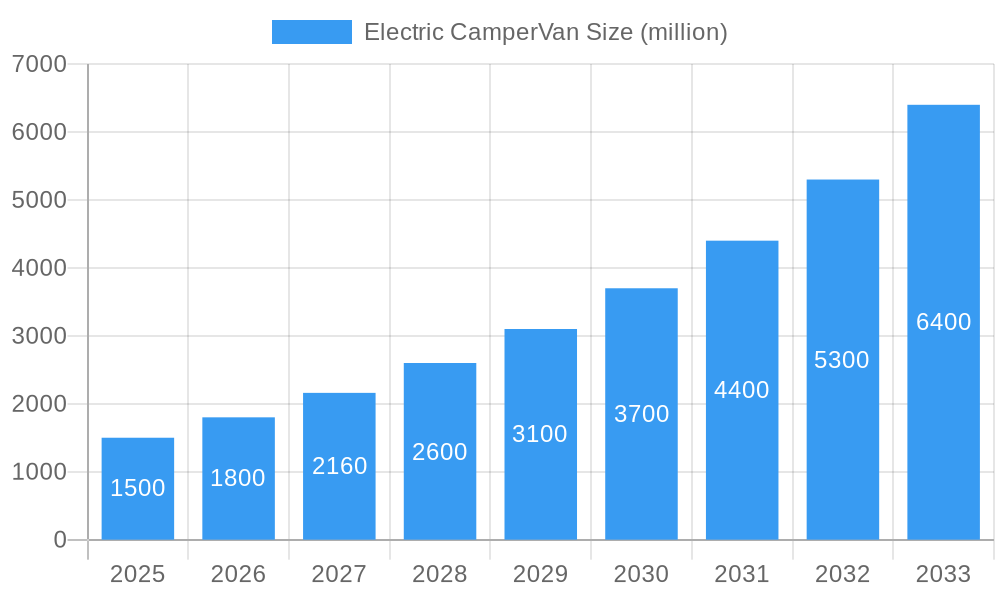
Electric CamperVan Market Size (In Billion)
The segmentation of the electric campervan market reflects diverse consumer needs and preferences. We can anticipate segments based on size (small, medium, large), features (luxury, budget-friendly, off-road capable), and target demographics (families, couples, solo adventurers). Regional variations in market adoption will likely be influenced by factors like government policies, consumer buying power, and the availability of charging infrastructure. For example, regions with robust electric vehicle infrastructure and strong environmental awareness, such as parts of Europe and North America, may see quicker adoption rates compared to others. The competitive landscape features a mix of established automotive manufacturers and emerging specialized campervan builders. This competition should drive innovation and offer consumers a wider range of choices in terms of features, price points, and overall vehicle design. Continued technological advancements, such as improved battery technology and faster charging times, will be key in propelling future market growth and overcoming current limitations.
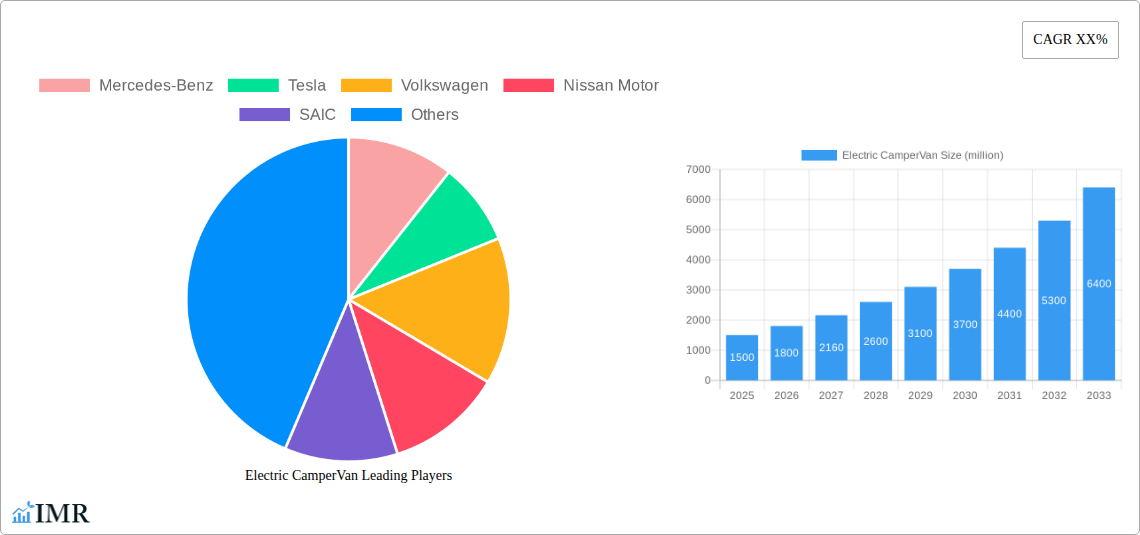
Electric CamperVan Company Market Share
Electric CamperVan Market Report: 2019-2033
This comprehensive report provides an in-depth analysis of the burgeoning Electric CamperVan market, encompassing market dynamics, growth trends, regional dominance, product landscape, and key players shaping its future. The study period covers 2019-2033, with a base year of 2025 and a forecast period of 2025-2033. This report is crucial for industry professionals, investors, and anyone seeking to understand the intricacies of this rapidly evolving sector. The parent market is the broader Electric Vehicle (EV) market, while the child market encompasses specialized recreational vehicles.
Electric CamperVan Market Dynamics & Structure
This section analyzes the competitive landscape, technological advancements, regulatory influences, and market trends within the Electric CamperVan industry. We delve into market concentration, identifying key players and their market share, assessing the impact of M&A activity (estimated at xx million deals in 2024), and examining the role of technological innovation and regulatory frameworks. The analysis considers end-user demographics (e.g., age, income, lifestyle) and the emergence of substitute products.
- Market Concentration: The market is currently fragmented, with xx% market share held by the top 5 players in 2024, showing a shift toward consolidation.
- Technological Innovation: Key drivers include advancements in battery technology, charging infrastructure, and autonomous driving features, while barriers include high initial costs and limited range.
- Regulatory Frameworks: Government incentives and emission regulations are significantly influencing market growth, creating both opportunities and challenges.
- Competitive Substitutes: Traditional gasoline-powered campervans and alternative recreational vehicles present competition.
- M&A Trends: Consolidation is expected to increase as larger automotive companies acquire smaller specialized EV campervan manufacturers.
- End-User Demographics: The target audience is expanding beyond traditional RVers to include younger, environmentally conscious consumers.
Electric CamperVan Growth Trends & Insights
This section provides a comprehensive analysis of the Electric CamperVan market's historical and projected growth, leveraging detailed sales data and industry reports. We examine market size evolution, analyzing year-over-year growth rates (CAGR) from 2019 to 2024 and projecting growth through 2033. The analysis incorporates adoption rates, assessing consumer acceptance and identifying factors driving or hindering market penetration. Technological disruptions, such as advancements in battery technology and charging infrastructure, are also evaluated alongside changing consumer behavior, including the increasing demand for sustainable and eco-friendly travel options. The global Electric Campervan market size is estimated at xx million units in 2025, with a projected CAGR of xx% during the forecast period.
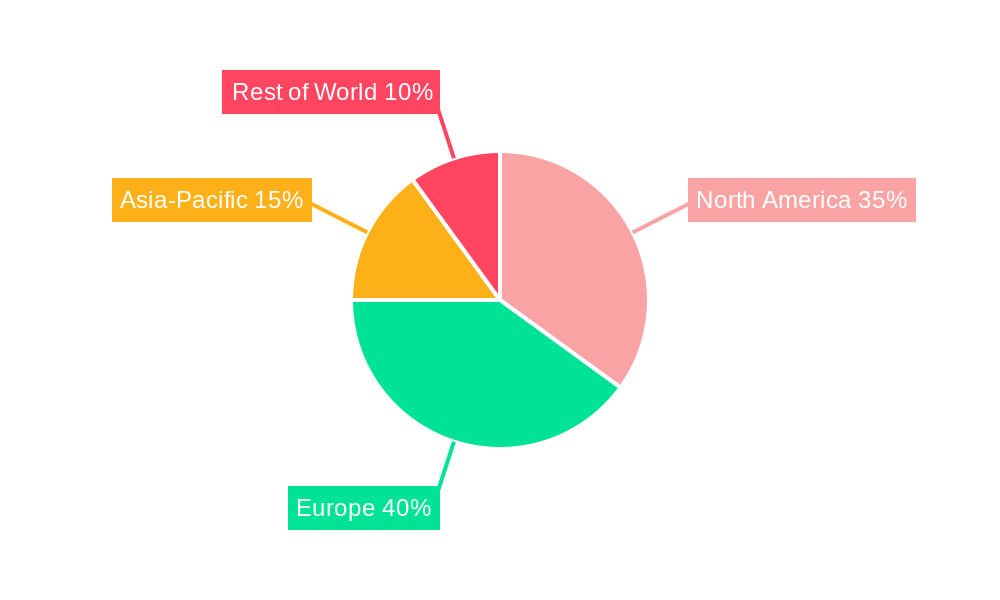
Dominant Regions, Countries, or Segments in Electric CamperVan
This section identifies leading regions and countries driving market growth, analyzing market share and growth potential. Key drivers, including economic policies, infrastructure development, and consumer preferences, are highlighted for each region. North America and Europe are expected to lead the market, but the Asia-Pacific region exhibits significant growth potential.
- North America: Strong consumer demand, supportive government policies, and well-established charging infrastructure contribute to its dominance.
- Europe: Stringent emission regulations and a growing focus on sustainable tourism fuel market growth.
- Asia-Pacific: Rapid economic development and increasing disposable incomes are expected to drive future growth, though infrastructure development presents a challenge.
Electric CamperVan Product Landscape
The Electric CamperVan market offers a diverse range of products, from compact vans to larger, luxury models. Manufacturers are focusing on improving range, charging times, and integrating advanced technology, such as solar panels and smart home features. Unique selling propositions include enhanced comfort, energy efficiency, and reduced environmental impact. Technological advancements in battery technology, motor efficiency, and lightweight materials contribute to improved performance and range.
Key Drivers, Barriers & Challenges in Electric CamperVan
Key Drivers:
- Growing environmental awareness and increasing demand for sustainable travel.
- Government incentives and subsidies promoting EV adoption.
- Advancements in battery technology leading to increased range and performance.
Challenges & Restraints:
- High initial purchase price compared to traditional campervans.
- Limited charging infrastructure in certain regions.
- Range anxiety among consumers remains a significant barrier. This accounts for an estimated xx% decrease in sales in 2024.
- Supply chain disruptions impacting battery production and component availability.
Emerging Opportunities in Electric CamperVan
Emerging opportunities include expanding into untapped markets, particularly in developing economies, and the development of innovative features, such as integrated renewable energy systems and advanced driver-assistance systems. The increasing demand for personalized and customized campervan experiences presents further growth potential.
Growth Accelerators in the Electric CamperVan Industry
Long-term growth will be driven by continued technological advancements, strategic partnerships between automotive manufacturers and technology companies, and expansion into new markets. Government policies promoting sustainable transportation and infrastructure development will also play a significant role.
Key Players Shaping the Electric CamperVan Market
- Mercedes-Benz
- Tesla
- Volkswagen
- Nissan Motor
- SAIC
- Maxwell Vehicles
- Rivian
- MRXUS
- FIAT
- Vauxhall
- RAM
- WOF
- MOIA
- Neuron
- ElectricBrands
- Thor Industries
Notable Milestones in Electric CamperVan Sector
- 2022 Q4: Tesla announces the Cybertruck Campervan concept.
- 2023 Q1: Volkswagen launches the ID. Buzz Campervan.
- 2023 Q3: Mercedes-Benz unveils its electric campervan prototype.
In-Depth Electric CamperVan Market Outlook
The Electric CamperVan market is poised for significant growth over the next decade, driven by technological advancements, increasing environmental awareness, and supportive government policies. Strategic partnerships and innovative product development will be crucial for companies seeking to capitalize on this emerging market. The market is expected to reach xx million units by 2033, presenting substantial opportunities for growth and investment.
Electric CamperVan Segmentation
-
1. Application
- 1.1. Recreation And Leisure
- 1.2. Cargo Transportation
- 1.3. Other
-
2. Types
- 2.1. Below Four Seats
- 2.2. Above Four Seats
Electric CamperVan Segmentation By Geography
-
1. North America
- 1.1. United States
- 1.2. Canada
- 1.3. Mexico
-
2. South America
- 2.1. Brazil
- 2.2. Argentina
- 2.3. Rest of South America
-
3. Europe
- 3.1. United Kingdom
- 3.2. Germany
- 3.3. France
- 3.4. Italy
- 3.5. Spain
- 3.6. Russia
- 3.7. Benelux
- 3.8. Nordics
- 3.9. Rest of Europe
-
4. Middle East & Africa
- 4.1. Turkey
- 4.2. Israel
- 4.3. GCC
- 4.4. North Africa
- 4.5. South Africa
- 4.6. Rest of Middle East & Africa
-
5. Asia Pacific
- 5.1. China
- 5.2. India
- 5.3. Japan
- 5.4. South Korea
- 5.5. ASEAN
- 5.6. Oceania
- 5.7. Rest of Asia Pacific
Electric CamperVan Regional Market Share
Geographic Coverage of Electric CamperVan
Electric CamperVan REPORT HIGHLIGHTS
| Aspects | Details |
|---|---|
| Study Period | 2020-2034 |
| Base Year | 2025 |
| Estimated Year | 2026 |
| Forecast Period | 2026-2034 |
| Historical Period | 2020-2025 |
| Growth Rate | CAGR of 25.2% from 2020-2034 |
| Segmentation |
|
Table of Contents
- 1. Introduction
- 1.1. Research Scope
- 1.2. Market Segmentation
- 1.3. Research Objective
- 1.4. Definitions and Assumptions
- 2. Executive Summary
- 2.1. Market Snapshot
- 3. Market Dynamics
- 3.1. Market Drivers
- 3.2. Market Restrains
- 3.3. Market Trends
- 3.4. Market Opportunities
- 4. Market Factor Analysis
- 4.1. Porters Five Forces
- 4.1.1. Bargaining Power of Suppliers
- 4.1.2. Bargaining Power of Buyers
- 4.1.3. Threat of New Entrants
- 4.1.4. Threat of Substitutes
- 4.1.5. Competitive Rivalry
- 4.2. PESTEL analysis
- 4.3. BCG Analysis
- 4.3.1. Stars (High Growth, High Market Share)
- 4.3.2. Cash Cows (Low Growth, High Market Share)
- 4.3.3. Question Mark (High Growth, Low Market Share)
- 4.3.4. Dogs (Low Growth, Low Market Share)
- 4.4. Ansoff Matrix Analysis
- 4.5. Supply Chain Analysis
- 4.6. Regulatory Landscape
- 4.7. Current Market Potential and Opportunity Assessment (TAM–SAM–SOM Framework)
- 4.8. IMR Analyst Note
- 4.1. Porters Five Forces
- 5. Market Analysis, Insights and Forecast 2021-2033
- 5.1. Market Analysis, Insights and Forecast - by Application
- 5.1.1. Recreation And Leisure
- 5.1.2. Cargo Transportation
- 5.1.3. Other
- 5.2. Market Analysis, Insights and Forecast - by Types
- 5.2.1. Below Four Seats
- 5.2.2. Above Four Seats
- 5.3. Market Analysis, Insights and Forecast - by Region
- 5.3.1. North America
- 5.3.2. South America
- 5.3.3. Europe
- 5.3.4. Middle East & Africa
- 5.3.5. Asia Pacific
- 5.1. Market Analysis, Insights and Forecast - by Application
- 6. Global Electric CamperVan Analysis, Insights and Forecast, 2021-2033
- 6.1. Market Analysis, Insights and Forecast - by Application
- 6.1.1. Recreation And Leisure
- 6.1.2. Cargo Transportation
- 6.1.3. Other
- 6.2. Market Analysis, Insights and Forecast - by Types
- 6.2.1. Below Four Seats
- 6.2.2. Above Four Seats
- 6.1. Market Analysis, Insights and Forecast - by Application
- 7. North America Electric CamperVan Analysis, Insights and Forecast, 2020-2032
- 7.1. Market Analysis, Insights and Forecast - by Application
- 7.1.1. Recreation And Leisure
- 7.1.2. Cargo Transportation
- 7.1.3. Other
- 7.2. Market Analysis, Insights and Forecast - by Types
- 7.2.1. Below Four Seats
- 7.2.2. Above Four Seats
- 7.1. Market Analysis, Insights and Forecast - by Application
- 8. South America Electric CamperVan Analysis, Insights and Forecast, 2020-2032
- 8.1. Market Analysis, Insights and Forecast - by Application
- 8.1.1. Recreation And Leisure
- 8.1.2. Cargo Transportation
- 8.1.3. Other
- 8.2. Market Analysis, Insights and Forecast - by Types
- 8.2.1. Below Four Seats
- 8.2.2. Above Four Seats
- 8.1. Market Analysis, Insights and Forecast - by Application
- 9. Europe Electric CamperVan Analysis, Insights and Forecast, 2020-2032
- 9.1. Market Analysis, Insights and Forecast - by Application
- 9.1.1. Recreation And Leisure
- 9.1.2. Cargo Transportation
- 9.1.3. Other
- 9.2. Market Analysis, Insights and Forecast - by Types
- 9.2.1. Below Four Seats
- 9.2.2. Above Four Seats
- 9.1. Market Analysis, Insights and Forecast - by Application
- 10. Middle East & Africa Electric CamperVan Analysis, Insights and Forecast, 2020-2032
- 10.1. Market Analysis, Insights and Forecast - by Application
- 10.1.1. Recreation And Leisure
- 10.1.2. Cargo Transportation
- 10.1.3. Other
- 10.2. Market Analysis, Insights and Forecast - by Types
- 10.2.1. Below Four Seats
- 10.2.2. Above Four Seats
- 10.1. Market Analysis, Insights and Forecast - by Application
- 11. Asia Pacific Electric CamperVan Analysis, Insights and Forecast, 2020-2032
- 11.1. Market Analysis, Insights and Forecast - by Application
- 11.1.1. Recreation And Leisure
- 11.1.2. Cargo Transportation
- 11.1.3. Other
- 11.2. Market Analysis, Insights and Forecast - by Types
- 11.2.1. Below Four Seats
- 11.2.2. Above Four Seats
- 11.1. Market Analysis, Insights and Forecast - by Application
- 12. Competitive Analysis
- 12.1. Company Profiles
- 12.1.1 Mercedes-Benz
- 12.1.1.1. Company Overview
- 12.1.1.2. Products
- 12.1.1.3. Company Financials
- 12.1.1.4. SWOT Analysis
- 12.1.2 Tesla
- 12.1.2.1. Company Overview
- 12.1.2.2. Products
- 12.1.2.3. Company Financials
- 12.1.2.4. SWOT Analysis
- 12.1.3 Volkswagen
- 12.1.3.1. Company Overview
- 12.1.3.2. Products
- 12.1.3.3. Company Financials
- 12.1.3.4. SWOT Analysis
- 12.1.4 Nissan Motor
- 12.1.4.1. Company Overview
- 12.1.4.2. Products
- 12.1.4.3. Company Financials
- 12.1.4.4. SWOT Analysis
- 12.1.5 SAIC
- 12.1.5.1. Company Overview
- 12.1.5.2. Products
- 12.1.5.3. Company Financials
- 12.1.5.4. SWOT Analysis
- 12.1.6 Maxwell Vehicles
- 12.1.6.1. Company Overview
- 12.1.6.2. Products
- 12.1.6.3. Company Financials
- 12.1.6.4. SWOT Analysis
- 12.1.7 Rivian
- 12.1.7.1. Company Overview
- 12.1.7.2. Products
- 12.1.7.3. Company Financials
- 12.1.7.4. SWOT Analysis
- 12.1.8 MRXUS
- 12.1.8.1. Company Overview
- 12.1.8.2. Products
- 12.1.8.3. Company Financials
- 12.1.8.4. SWOT Analysis
- 12.1.9 FIAT
- 12.1.9.1. Company Overview
- 12.1.9.2. Products
- 12.1.9.3. Company Financials
- 12.1.9.4. SWOT Analysis
- 12.1.10 Vauxhall
- 12.1.10.1. Company Overview
- 12.1.10.2. Products
- 12.1.10.3. Company Financials
- 12.1.10.4. SWOT Analysis
- 12.1.11 RAM
- 12.1.11.1. Company Overview
- 12.1.11.2. Products
- 12.1.11.3. Company Financials
- 12.1.11.4. SWOT Analysis
- 12.1.12 WOF
- 12.1.12.1. Company Overview
- 12.1.12.2. Products
- 12.1.12.3. Company Financials
- 12.1.12.4. SWOT Analysis
- 12.1.13 MOIA
- 12.1.13.1. Company Overview
- 12.1.13.2. Products
- 12.1.13.3. Company Financials
- 12.1.13.4. SWOT Analysis
- 12.1.14 Neuron
- 12.1.14.1. Company Overview
- 12.1.14.2. Products
- 12.1.14.3. Company Financials
- 12.1.14.4. SWOT Analysis
- 12.1.15 ElectricBrands
- 12.1.15.1. Company Overview
- 12.1.15.2. Products
- 12.1.15.3. Company Financials
- 12.1.15.4. SWOT Analysis
- 12.1.16 Thor Industries
- 12.1.16.1. Company Overview
- 12.1.16.2. Products
- 12.1.16.3. Company Financials
- 12.1.16.4. SWOT Analysis
- 12.1.1 Mercedes-Benz
- 12.2. Market Entropy
- 12.2.1 Company's Key Areas Served
- 12.2.2 Recent Developments
- 12.3. Company Market Share Analysis 2025
- 12.3.1 Top 5 Companies Market Share Analysis
- 12.3.2 Top 3 Companies Market Share Analysis
- 12.4. List of Potential Customers
- 13. Research Methodology
List of Figures
- Figure 1: Global Electric CamperVan Revenue Breakdown (undefined, %) by Region 2025 & 2033
- Figure 2: Global Electric CamperVan Volume Breakdown (K, %) by Region 2025 & 2033
- Figure 3: North America Electric CamperVan Revenue (undefined), by Application 2025 & 2033
- Figure 4: North America Electric CamperVan Volume (K), by Application 2025 & 2033
- Figure 5: North America Electric CamperVan Revenue Share (%), by Application 2025 & 2033
- Figure 6: North America Electric CamperVan Volume Share (%), by Application 2025 & 2033
- Figure 7: North America Electric CamperVan Revenue (undefined), by Types 2025 & 2033
- Figure 8: North America Electric CamperVan Volume (K), by Types 2025 & 2033
- Figure 9: North America Electric CamperVan Revenue Share (%), by Types 2025 & 2033
- Figure 10: North America Electric CamperVan Volume Share (%), by Types 2025 & 2033
- Figure 11: North America Electric CamperVan Revenue (undefined), by Country 2025 & 2033
- Figure 12: North America Electric CamperVan Volume (K), by Country 2025 & 2033
- Figure 13: North America Electric CamperVan Revenue Share (%), by Country 2025 & 2033
- Figure 14: North America Electric CamperVan Volume Share (%), by Country 2025 & 2033
- Figure 15: South America Electric CamperVan Revenue (undefined), by Application 2025 & 2033
- Figure 16: South America Electric CamperVan Volume (K), by Application 2025 & 2033
- Figure 17: South America Electric CamperVan Revenue Share (%), by Application 2025 & 2033
- Figure 18: South America Electric CamperVan Volume Share (%), by Application 2025 & 2033
- Figure 19: South America Electric CamperVan Revenue (undefined), by Types 2025 & 2033
- Figure 20: South America Electric CamperVan Volume (K), by Types 2025 & 2033
- Figure 21: South America Electric CamperVan Revenue Share (%), by Types 2025 & 2033
- Figure 22: South America Electric CamperVan Volume Share (%), by Types 2025 & 2033
- Figure 23: South America Electric CamperVan Revenue (undefined), by Country 2025 & 2033
- Figure 24: South America Electric CamperVan Volume (K), by Country 2025 & 2033
- Figure 25: South America Electric CamperVan Revenue Share (%), by Country 2025 & 2033
- Figure 26: South America Electric CamperVan Volume Share (%), by Country 2025 & 2033
- Figure 27: Europe Electric CamperVan Revenue (undefined), by Application 2025 & 2033
- Figure 28: Europe Electric CamperVan Volume (K), by Application 2025 & 2033
- Figure 29: Europe Electric CamperVan Revenue Share (%), by Application 2025 & 2033
- Figure 30: Europe Electric CamperVan Volume Share (%), by Application 2025 & 2033
- Figure 31: Europe Electric CamperVan Revenue (undefined), by Types 2025 & 2033
- Figure 32: Europe Electric CamperVan Volume (K), by Types 2025 & 2033
- Figure 33: Europe Electric CamperVan Revenue Share (%), by Types 2025 & 2033
- Figure 34: Europe Electric CamperVan Volume Share (%), by Types 2025 & 2033
- Figure 35: Europe Electric CamperVan Revenue (undefined), by Country 2025 & 2033
- Figure 36: Europe Electric CamperVan Volume (K), by Country 2025 & 2033
- Figure 37: Europe Electric CamperVan Revenue Share (%), by Country 2025 & 2033
- Figure 38: Europe Electric CamperVan Volume Share (%), by Country 2025 & 2033
- Figure 39: Middle East & Africa Electric CamperVan Revenue (undefined), by Application 2025 & 2033
- Figure 40: Middle East & Africa Electric CamperVan Volume (K), by Application 2025 & 2033
- Figure 41: Middle East & Africa Electric CamperVan Revenue Share (%), by Application 2025 & 2033
- Figure 42: Middle East & Africa Electric CamperVan Volume Share (%), by Application 2025 & 2033
- Figure 43: Middle East & Africa Electric CamperVan Revenue (undefined), by Types 2025 & 2033
- Figure 44: Middle East & Africa Electric CamperVan Volume (K), by Types 2025 & 2033
- Figure 45: Middle East & Africa Electric CamperVan Revenue Share (%), by Types 2025 & 2033
- Figure 46: Middle East & Africa Electric CamperVan Volume Share (%), by Types 2025 & 2033
- Figure 47: Middle East & Africa Electric CamperVan Revenue (undefined), by Country 2025 & 2033
- Figure 48: Middle East & Africa Electric CamperVan Volume (K), by Country 2025 & 2033
- Figure 49: Middle East & Africa Electric CamperVan Revenue Share (%), by Country 2025 & 2033
- Figure 50: Middle East & Africa Electric CamperVan Volume Share (%), by Country 2025 & 2033
- Figure 51: Asia Pacific Electric CamperVan Revenue (undefined), by Application 2025 & 2033
- Figure 52: Asia Pacific Electric CamperVan Volume (K), by Application 2025 & 2033
- Figure 53: Asia Pacific Electric CamperVan Revenue Share (%), by Application 2025 & 2033
- Figure 54: Asia Pacific Electric CamperVan Volume Share (%), by Application 2025 & 2033
- Figure 55: Asia Pacific Electric CamperVan Revenue (undefined), by Types 2025 & 2033
- Figure 56: Asia Pacific Electric CamperVan Volume (K), by Types 2025 & 2033
- Figure 57: Asia Pacific Electric CamperVan Revenue Share (%), by Types 2025 & 2033
- Figure 58: Asia Pacific Electric CamperVan Volume Share (%), by Types 2025 & 2033
- Figure 59: Asia Pacific Electric CamperVan Revenue (undefined), by Country 2025 & 2033
- Figure 60: Asia Pacific Electric CamperVan Volume (K), by Country 2025 & 2033
- Figure 61: Asia Pacific Electric CamperVan Revenue Share (%), by Country 2025 & 2033
- Figure 62: Asia Pacific Electric CamperVan Volume Share (%), by Country 2025 & 2033
List of Tables
- Table 1: Global Electric CamperVan Revenue undefined Forecast, by Application 2020 & 2033
- Table 2: Global Electric CamperVan Volume K Forecast, by Application 2020 & 2033
- Table 3: Global Electric CamperVan Revenue undefined Forecast, by Types 2020 & 2033
- Table 4: Global Electric CamperVan Volume K Forecast, by Types 2020 & 2033
- Table 5: Global Electric CamperVan Revenue undefined Forecast, by Region 2020 & 2033
- Table 6: Global Electric CamperVan Volume K Forecast, by Region 2020 & 2033
- Table 7: Global Electric CamperVan Revenue undefined Forecast, by Application 2020 & 2033
- Table 8: Global Electric CamperVan Volume K Forecast, by Application 2020 & 2033
- Table 9: Global Electric CamperVan Revenue undefined Forecast, by Types 2020 & 2033
- Table 10: Global Electric CamperVan Volume K Forecast, by Types 2020 & 2033
- Table 11: Global Electric CamperVan Revenue undefined Forecast, by Country 2020 & 2033
- Table 12: Global Electric CamperVan Volume K Forecast, by Country 2020 & 2033
- Table 13: United States Electric CamperVan Revenue (undefined) Forecast, by Application 2020 & 2033
- Table 14: United States Electric CamperVan Volume (K) Forecast, by Application 2020 & 2033
- Table 15: Canada Electric CamperVan Revenue (undefined) Forecast, by Application 2020 & 2033
- Table 16: Canada Electric CamperVan Volume (K) Forecast, by Application 2020 & 2033
- Table 17: Mexico Electric CamperVan Revenue (undefined) Forecast, by Application 2020 & 2033
- Table 18: Mexico Electric CamperVan Volume (K) Forecast, by Application 2020 & 2033
- Table 19: Global Electric CamperVan Revenue undefined Forecast, by Application 2020 & 2033
- Table 20: Global Electric CamperVan Volume K Forecast, by Application 2020 & 2033
- Table 21: Global Electric CamperVan Revenue undefined Forecast, by Types 2020 & 2033
- Table 22: Global Electric CamperVan Volume K Forecast, by Types 2020 & 2033
- Table 23: Global Electric CamperVan Revenue undefined Forecast, by Country 2020 & 2033
- Table 24: Global Electric CamperVan Volume K Forecast, by Country 2020 & 2033
- Table 25: Brazil Electric CamperVan Revenue (undefined) Forecast, by Application 2020 & 2033
- Table 26: Brazil Electric CamperVan Volume (K) Forecast, by Application 2020 & 2033
- Table 27: Argentina Electric CamperVan Revenue (undefined) Forecast, by Application 2020 & 2033
- Table 28: Argentina Electric CamperVan Volume (K) Forecast, by Application 2020 & 2033
- Table 29: Rest of South America Electric CamperVan Revenue (undefined) Forecast, by Application 2020 & 2033
- Table 30: Rest of South America Electric CamperVan Volume (K) Forecast, by Application 2020 & 2033
- Table 31: Global Electric CamperVan Revenue undefined Forecast, by Application 2020 & 2033
- Table 32: Global Electric CamperVan Volume K Forecast, by Application 2020 & 2033
- Table 33: Global Electric CamperVan Revenue undefined Forecast, by Types 2020 & 2033
- Table 34: Global Electric CamperVan Volume K Forecast, by Types 2020 & 2033
- Table 35: Global Electric CamperVan Revenue undefined Forecast, by Country 2020 & 2033
- Table 36: Global Electric CamperVan Volume K Forecast, by Country 2020 & 2033
- Table 37: United Kingdom Electric CamperVan Revenue (undefined) Forecast, by Application 2020 & 2033
- Table 38: United Kingdom Electric CamperVan Volume (K) Forecast, by Application 2020 & 2033
- Table 39: Germany Electric CamperVan Revenue (undefined) Forecast, by Application 2020 & 2033
- Table 40: Germany Electric CamperVan Volume (K) Forecast, by Application 2020 & 2033
- Table 41: France Electric CamperVan Revenue (undefined) Forecast, by Application 2020 & 2033
- Table 42: France Electric CamperVan Volume (K) Forecast, by Application 2020 & 2033
- Table 43: Italy Electric CamperVan Revenue (undefined) Forecast, by Application 2020 & 2033
- Table 44: Italy Electric CamperVan Volume (K) Forecast, by Application 2020 & 2033
- Table 45: Spain Electric CamperVan Revenue (undefined) Forecast, by Application 2020 & 2033
- Table 46: Spain Electric CamperVan Volume (K) Forecast, by Application 2020 & 2033
- Table 47: Russia Electric CamperVan Revenue (undefined) Forecast, by Application 2020 & 2033
- Table 48: Russia Electric CamperVan Volume (K) Forecast, by Application 2020 & 2033
- Table 49: Benelux Electric CamperVan Revenue (undefined) Forecast, by Application 2020 & 2033
- Table 50: Benelux Electric CamperVan Volume (K) Forecast, by Application 2020 & 2033
- Table 51: Nordics Electric CamperVan Revenue (undefined) Forecast, by Application 2020 & 2033
- Table 52: Nordics Electric CamperVan Volume (K) Forecast, by Application 2020 & 2033
- Table 53: Rest of Europe Electric CamperVan Revenue (undefined) Forecast, by Application 2020 & 2033
- Table 54: Rest of Europe Electric CamperVan Volume (K) Forecast, by Application 2020 & 2033
- Table 55: Global Electric CamperVan Revenue undefined Forecast, by Application 2020 & 2033
- Table 56: Global Electric CamperVan Volume K Forecast, by Application 2020 & 2033
- Table 57: Global Electric CamperVan Revenue undefined Forecast, by Types 2020 & 2033
- Table 58: Global Electric CamperVan Volume K Forecast, by Types 2020 & 2033
- Table 59: Global Electric CamperVan Revenue undefined Forecast, by Country 2020 & 2033
- Table 60: Global Electric CamperVan Volume K Forecast, by Country 2020 & 2033
- Table 61: Turkey Electric CamperVan Revenue (undefined) Forecast, by Application 2020 & 2033
- Table 62: Turkey Electric CamperVan Volume (K) Forecast, by Application 2020 & 2033
- Table 63: Israel Electric CamperVan Revenue (undefined) Forecast, by Application 2020 & 2033
- Table 64: Israel Electric CamperVan Volume (K) Forecast, by Application 2020 & 2033
- Table 65: GCC Electric CamperVan Revenue (undefined) Forecast, by Application 2020 & 2033
- Table 66: GCC Electric CamperVan Volume (K) Forecast, by Application 2020 & 2033
- Table 67: North Africa Electric CamperVan Revenue (undefined) Forecast, by Application 2020 & 2033
- Table 68: North Africa Electric CamperVan Volume (K) Forecast, by Application 2020 & 2033
- Table 69: South Africa Electric CamperVan Revenue (undefined) Forecast, by Application 2020 & 2033
- Table 70: South Africa Electric CamperVan Volume (K) Forecast, by Application 2020 & 2033
- Table 71: Rest of Middle East & Africa Electric CamperVan Revenue (undefined) Forecast, by Application 2020 & 2033
- Table 72: Rest of Middle East & Africa Electric CamperVan Volume (K) Forecast, by Application 2020 & 2033
- Table 73: Global Electric CamperVan Revenue undefined Forecast, by Application 2020 & 2033
- Table 74: Global Electric CamperVan Volume K Forecast, by Application 2020 & 2033
- Table 75: Global Electric CamperVan Revenue undefined Forecast, by Types 2020 & 2033
- Table 76: Global Electric CamperVan Volume K Forecast, by Types 2020 & 2033
- Table 77: Global Electric CamperVan Revenue undefined Forecast, by Country 2020 & 2033
- Table 78: Global Electric CamperVan Volume K Forecast, by Country 2020 & 2033
- Table 79: China Electric CamperVan Revenue (undefined) Forecast, by Application 2020 & 2033
- Table 80: China Electric CamperVan Volume (K) Forecast, by Application 2020 & 2033
- Table 81: India Electric CamperVan Revenue (undefined) Forecast, by Application 2020 & 2033
- Table 82: India Electric CamperVan Volume (K) Forecast, by Application 2020 & 2033
- Table 83: Japan Electric CamperVan Revenue (undefined) Forecast, by Application 2020 & 2033
- Table 84: Japan Electric CamperVan Volume (K) Forecast, by Application 2020 & 2033
- Table 85: South Korea Electric CamperVan Revenue (undefined) Forecast, by Application 2020 & 2033
- Table 86: South Korea Electric CamperVan Volume (K) Forecast, by Application 2020 & 2033
- Table 87: ASEAN Electric CamperVan Revenue (undefined) Forecast, by Application 2020 & 2033
- Table 88: ASEAN Electric CamperVan Volume (K) Forecast, by Application 2020 & 2033
- Table 89: Oceania Electric CamperVan Revenue (undefined) Forecast, by Application 2020 & 2033
- Table 90: Oceania Electric CamperVan Volume (K) Forecast, by Application 2020 & 2033
- Table 91: Rest of Asia Pacific Electric CamperVan Revenue (undefined) Forecast, by Application 2020 & 2033
- Table 92: Rest of Asia Pacific Electric CamperVan Volume (K) Forecast, by Application 2020 & 2033
Frequently Asked Questions
1. What is the projected Compound Annual Growth Rate (CAGR) of the Electric CamperVan?
The projected CAGR is approximately 25.2%.
2. Which companies are prominent players in the Electric CamperVan?
Key companies in the market include Mercedes-Benz, Tesla, Volkswagen, Nissan Motor, SAIC, Maxwell Vehicles, Rivian, MRXUS, FIAT, Vauxhall, RAM, WOF, MOIA, Neuron, ElectricBrands, Thor Industries.
3. What are the main segments of the Electric CamperVan?
The market segments include Application, Types.
4. Can you provide details about the market size?
The market size is estimated to be USD XXX N/A as of 2022.
5. What are some drivers contributing to market growth?
N/A
6. What are the notable trends driving market growth?
N/A
7. Are there any restraints impacting market growth?
N/A
8. Can you provide examples of recent developments in the market?
N/A
9. What pricing options are available for accessing the report?
Pricing options include single-user, multi-user, and enterprise licenses priced at USD 4350.00, USD 6525.00, and USD 8700.00 respectively.
10. Is the market size provided in terms of value or volume?
The market size is provided in terms of value, measured in N/A and volume, measured in K.
11. Are there any specific market keywords associated with the report?
Yes, the market keyword associated with the report is "Electric CamperVan," which aids in identifying and referencing the specific market segment covered.
12. How do I determine which pricing option suits my needs best?
The pricing options vary based on user requirements and access needs. Individual users may opt for single-user licenses, while businesses requiring broader access may choose multi-user or enterprise licenses for cost-effective access to the report.
13. Are there any additional resources or data provided in the Electric CamperVan report?
While the report offers comprehensive insights, it's advisable to review the specific contents or supplementary materials provided to ascertain if additional resources or data are available.
14. How can I stay updated on further developments or reports in the Electric CamperVan?
To stay informed about further developments, trends, and reports in the Electric CamperVan, consider subscribing to industry newsletters, following relevant companies and organizations, or regularly checking reputable industry news sources and publications.
Methodology
Step 1 - Identification of Relevant Samples Size from Population Database


Step 2 - Approaches for Defining Global Market Size (Value, Volume* & Price*)

Note*: In applicable scenarios
Step 3 - Data Sources
Primary Research
- Web Analytics
- Survey Reports
- Research Institute
- Latest Research Reports
- Opinion Leaders
Secondary Research
- Annual Reports
- White Paper
- Latest Press Release
- Industry Association
- Paid Database
- Investor Presentations

Step 4 - Data Triangulation
Involves using different sources of information in order to increase the validity of a study
These sources are likely to be stakeholders in a program - participants, other researchers, program staff, other community members, and so on.
Then we put all data in single framework & apply various statistical tools to find out the dynamic on the market.
During the analysis stage, feedback from the stakeholder groups would be compared to determine areas of agreement as well as areas of divergence