

Key Insights
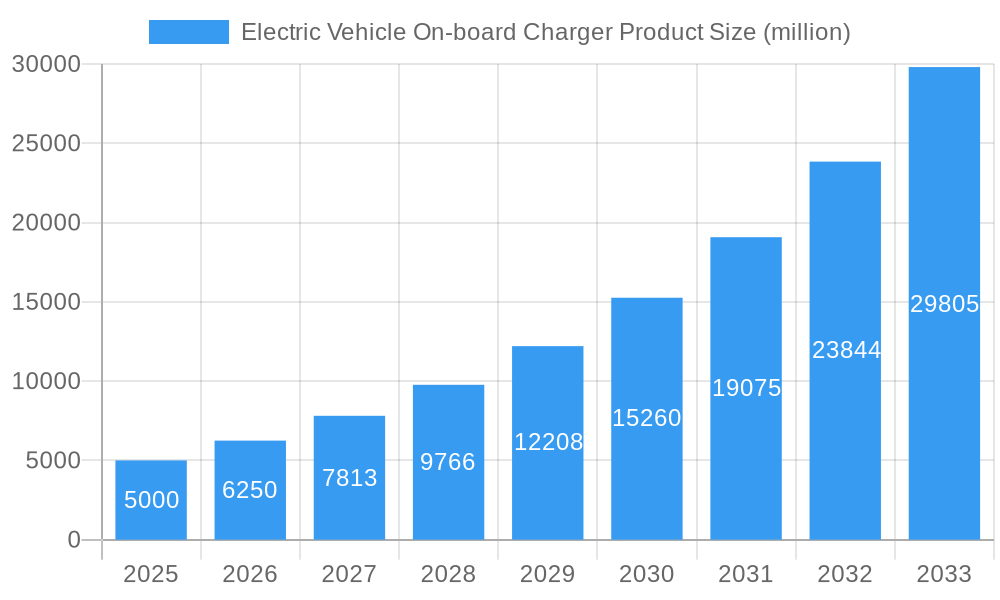
The Electric Vehicle (EV) on-board charger (OBC) market is experiencing robust growth, driven by the global surge in EV adoption. The market's expansion is fueled by several factors, including stringent emission regulations globally, increasing consumer preference for environmentally friendly vehicles, and continuous advancements in battery technology leading to greater EV range and faster charging capabilities. The market size in 2025 is estimated at $5 billion, with a Compound Annual Growth Rate (CAGR) of 25% projected from 2025 to 2033. This significant growth reflects the increasing demand for efficient and reliable charging solutions integrated directly into EVs. Key market segments include different power ratings (e.g., 3.3 kW, 7 kW, 11 kW, and above), charging standards (e.g., CHAdeMO, CCS, GB/T), and vehicle types (e.g., passenger cars, commercial vehicles). Leading companies such as Bel Power Solutions, BRUSA Elektronik AG, and Eaton Corporation are actively involved in developing advanced OBCs with enhanced features, such as bidirectional charging capabilities and improved thermal management.
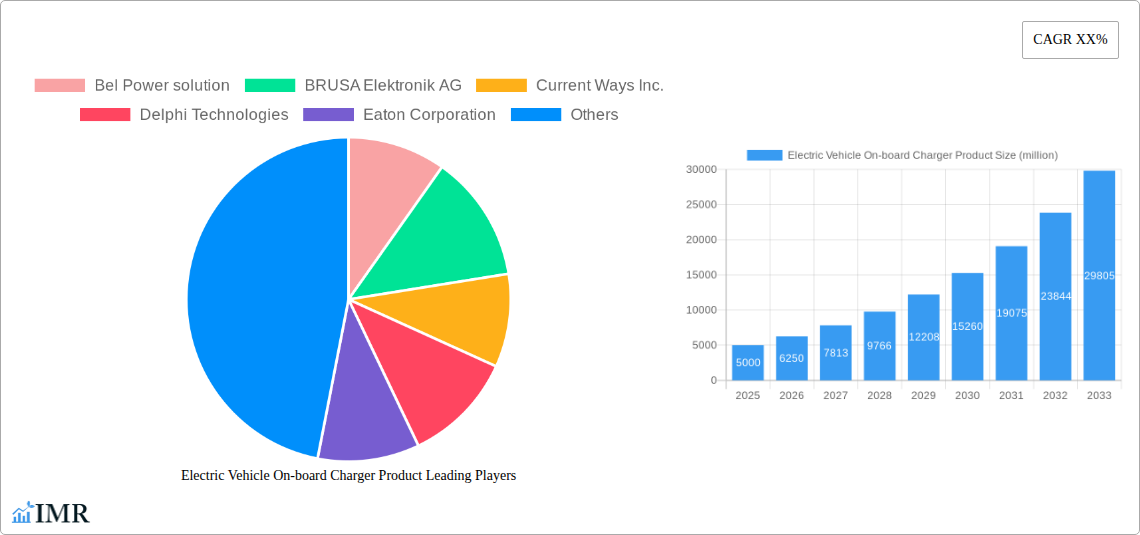
Electric Vehicle On-board Charger Product Market Size (In Billion)
Despite the significant growth potential, the EV OBC market faces certain challenges. These include the high initial investment costs associated with developing advanced OBC technology, the need for robust quality control to ensure reliable performance and safety, and potential supply chain disruptions impacting component availability. Nevertheless, ongoing research and development efforts aimed at improving efficiency, reducing costs, and enhancing functionalities (such as wireless charging) are expected to mitigate these challenges and further propel market growth. The growing adoption of government incentives and subsidies to promote EV adoption will also contribute significantly to market expansion in the forecast period. Regional market variations will exist, with North America and Europe anticipated to hold a considerable share, followed by Asia-Pacific, due to varying levels of EV penetration and infrastructure development.
Electric Vehicle On-board Charger Product Company Market Share
Electric Vehicle On-Board Charger Product Market Report: 2019-2033
This comprehensive report provides an in-depth analysis of the global Electric Vehicle (EV) On-board Charger (OBC) market, encompassing market dynamics, growth trends, regional analysis, product landscape, key players, and future outlook. The study period covers 2019-2033, with a base year of 2025 and a forecast period of 2025-2033. This report is crucial for industry professionals, investors, and strategists seeking to understand and capitalize on the burgeoning EV OBC market. The parent market is the broader Electric Vehicle market, while the child market is specifically EV charging infrastructure components.
Electric Vehicle On-board Charger Product Market Dynamics & Structure
The EV OBC market is characterized by increasing market concentration as major players consolidate their positions. Technological innovation, driven by advancements in silicon carbide (SiC) and gallium nitride (GaN) technologies, is a key growth driver. Stringent government regulations promoting EV adoption and stricter emission norms are further propelling market expansion. Competitive product substitutes, such as external chargers, exist but offer less convenience. The end-user demographic is expanding to include private consumers, fleet operators, and ride-sharing services. M&A activity is expected to remain robust, with an estimated xx million USD worth of deals in 2024.
- Market Concentration: Moderately concentrated, with top 5 players holding xx% market share in 2024.
- Technological Innovation: SiC and GaN adoption driving efficiency and power density improvements.
- Regulatory Framework: Government subsidies and emission regulations are key market drivers.
- Competitive Substitutes: External chargers pose a competitive threat, but OBCs maintain dominance due to convenience.
- End-User Demographics: Growing adoption across various segments - private consumers, fleet operators, and ride-sharing services.
- M&A Trends: Expected xx million USD in deal value during 2024, indicating significant consolidation.
Electric Vehicle On-board Charger Product Growth Trends & Insights
The global EV OBC market is experiencing significant growth, driven by the rising adoption of electric vehicles worldwide. The market size is projected to reach xx million units by 2025 and xx million units by 2033, exhibiting a CAGR of xx% during the forecast period. This growth is fueled by technological advancements leading to improved charger efficiency, reduced charging times, and enhanced vehicle range. Consumer preference is shifting towards EVs, supported by increasing environmental awareness and government incentives. Market penetration is expected to reach xx% by 2033, indicating significant growth potential. Technological disruptions, such as wireless charging and higher-power OBCs, are poised to further accelerate market expansion.
Dominant Regions, Countries, or Segments in Electric Vehicle On-board Charger Product
China remains the dominant region for EV OBCs, driven by robust government support for electric vehicle adoption, extensive charging infrastructure development, and a massive domestic EV market. Europe follows closely, spurred by stringent emission regulations and substantial investments in electric vehicle infrastructure. North America is also witnessing significant growth, albeit at a slower pace compared to Asia and Europe. The key drivers for these regions include:
- China: Strong government policies, large domestic EV market, and expanding charging infrastructure.
- Europe: Stringent emission regulations, significant investment in EV infrastructure, and growing consumer demand.
- North America: Increasing consumer awareness, government incentives, and improving charging infrastructure.
These regions are expected to account for xx million units of global EV OBC market share in 2025, with a projected growth to xx million units by 2033. Market dominance is primarily dictated by factors such as EV adoption rates, government support, and the availability of charging infrastructure.
Electric Vehicle On-board Charger Product Product Landscape
The EV OBC product landscape is characterized by continuous innovation, focusing on enhancing efficiency, power density, and charging speed. Products range from single-phase to three-phase chargers, offering varying power outputs to cater to different EV models and charging needs. Key features include advanced thermal management, integrated safety mechanisms, and communication protocols ensuring seamless integration with the vehicle’s electrical system. Unique selling propositions include smaller form factors, increased charging speeds, and improved efficiency, achieved through the adoption of SiC and GaN technologies.
Key Drivers, Barriers & Challenges in Electric Vehicle On-board Charger Product
Key Drivers: The burgeoning EV market, government incentives promoting EV adoption, and technological advancements like SiC and GaN are the primary drivers. Stringent emission regulations and rising consumer demand for eco-friendly vehicles further propel market growth.
Key Challenges: Supply chain disruptions caused by component shortages, particularly semiconductors, pose a significant challenge. High manufacturing costs associated with advanced technologies can limit market penetration. Regulatory hurdles and inconsistencies across different regions complicate market entry and expansion.
Emerging Opportunities in Electric Vehicle On-board Charger Product
Untapped markets in developing economies present significant opportunities. The integration of Vehicle-to-Grid (V2G) technology, enabling EVs to feed power back to the grid, offers a new revenue stream. Innovative applications, like wireless charging and fast-charging technologies, will unlock new market segments. Evolving consumer preferences towards higher power outputs and faster charging times create additional growth avenues.
Growth Accelerators in the Electric Vehicle On-board Charger Product Industry
Technological breakthroughs in semiconductor technology, such as SiC and GaN, are accelerating market growth by enhancing charger efficiency and power density. Strategic partnerships between OBC manufacturers and EV makers streamline supply chains and improve product integration. Market expansion strategies focusing on emerging markets with high growth potential will drive future growth.
Key Players Shaping the Electric Vehicle On-board Charger Product Market
- Bel Power Solutions
- BRUSA Elektronik AG
- Current Ways Inc.
- Delphi Technologies
- Eaton Corporation
- Infineon Technologies AG
- Innoelectric GmbH
- Stercom Power Solutions GmbH
- Toyota Industries Corporation
Notable Milestones in Electric Vehicle On-board Charger Product Sector
- 2021: Infineon launches a new SiC-based OBC, improving efficiency by 20%.
- 2022: Bel Power Solutions announces a partnership with a major EV manufacturer.
- 2023: Eaton releases a high-power OBC designed for fast-charging applications.
- 2024: Delphi Technologies acquires a smaller OBC manufacturer, expanding its market share.
In-Depth Electric Vehicle On-board Charger Product Market Outlook
The EV OBC market is poised for sustained growth, driven by the continued expansion of the EV market and technological advancements. Future market potential is significant, particularly in developing economies with high growth potential. Strategic opportunities exist in developing innovative products, establishing strategic partnerships, and expanding into new geographic markets. The focus on high-efficiency, fast-charging solutions, and integrated functionalities will shape the future of this dynamic market.
Electric Vehicle On-board Charger Product Segmentation
-
1. Type
- 1.1. Less than 20kW
- 1.2. More than 20kW
- 1.3. World Electric Vehicle On-board Charger Product Production
-
2. Application
- 2.1. Household
- 2.2. Commercial
- 2.3. Other
Electric Vehicle On-board Charger Product Segmentation By Geography
-
1. North America
- 1.1. United States
- 1.2. Canada
- 1.3. Mexico
-
2. South America
- 2.1. Brazil
- 2.2. Argentina
- 2.3. Rest of South America
-
3. Europe
- 3.1. United Kingdom
- 3.2. Germany
- 3.3. France
- 3.4. Italy
- 3.5. Spain
- 3.6. Russia
- 3.7. Benelux
- 3.8. Nordics
- 3.9. Rest of Europe
-
4. Middle East & Africa
- 4.1. Turkey
- 4.2. Israel
- 4.3. GCC
- 4.4. North Africa
- 4.5. South Africa
- 4.6. Rest of Middle East & Africa
-
5. Asia Pacific
- 5.1. China
- 5.2. India
- 5.3. Japan
- 5.4. South Korea
- 5.5. ASEAN
- 5.6. Oceania
- 5.7. Rest of Asia Pacific

Electric Vehicle On-board Charger Product Regional Market Share
Geographic Coverage of Electric Vehicle On-board Charger Product
Electric Vehicle On-board Charger Product REPORT HIGHLIGHTS
| Aspects | Details |
|---|---|
| Study Period | 2020-2034 |
| Base Year | 2025 |
| Estimated Year | 2026 |
| Forecast Period | 2026-2034 |
| Historical Period | 2020-2025 |
| Growth Rate | CAGR of 20.1% from 2020-2034 |
| Segmentation |
|
Table of Contents
- 1. Introduction
- 1.1. Research Scope
- 1.2. Market Segmentation
- 1.3. Research Objective
- 1.4. Definitions and Assumptions
- 2. Executive Summary
- 2.1. Market Snapshot
- 3. Market Dynamics
- 3.1. Market Drivers
- 3.2. Market Restrains
- 3.3. Market Trends
- 3.4. Market Opportunities
- 4. Market Factor Analysis
- 4.1. Porters Five Forces
- 4.1.1. Bargaining Power of Suppliers
- 4.1.2. Bargaining Power of Buyers
- 4.1.3. Threat of New Entrants
- 4.1.4. Threat of Substitutes
- 4.1.5. Competitive Rivalry
- 4.2. PESTEL analysis
- 4.3. BCG Analysis
- 4.3.1. Stars (High Growth, High Market Share)
- 4.3.2. Cash Cows (Low Growth, High Market Share)
- 4.3.3. Question Mark (High Growth, Low Market Share)
- 4.3.4. Dogs (Low Growth, Low Market Share)
- 4.4. Ansoff Matrix Analysis
- 4.5. Supply Chain Analysis
- 4.6. Regulatory Landscape
- 4.7. Current Market Potential and Opportunity Assessment (TAM–SAM–SOM Framework)
- 4.8. IMR Analyst Note
- 4.1. Porters Five Forces
- 5. Market Analysis, Insights and Forecast 2021-2033
- 5.1. Market Analysis, Insights and Forecast - by Type
- 5.1.1. Less than 20kW
- 5.1.2. More than 20kW
- 5.1.3. World Electric Vehicle On-board Charger Product Production
- 5.2. Market Analysis, Insights and Forecast - by Application
- 5.2.1. Household
- 5.2.2. Commercial
- 5.2.3. Other
- 5.3. Market Analysis, Insights and Forecast - by Region
- 5.3.1. North America
- 5.3.2. South America
- 5.3.3. Europe
- 5.3.4. Middle East & Africa
- 5.3.5. Asia Pacific
- 5.1. Market Analysis, Insights and Forecast - by Type
- 6. Global Electric Vehicle On-board Charger Product Analysis, Insights and Forecast, 2021-2033
- 6.1. Market Analysis, Insights and Forecast - by Type
- 6.1.1. Less than 20kW
- 6.1.2. More than 20kW
- 6.1.3. World Electric Vehicle On-board Charger Product Production
- 6.2. Market Analysis, Insights and Forecast - by Application
- 6.2.1. Household
- 6.2.2. Commercial
- 6.2.3. Other
- 6.1. Market Analysis, Insights and Forecast - by Type
- 7. North America Electric Vehicle On-board Charger Product Analysis, Insights and Forecast, 2020-2032
- 7.1. Market Analysis, Insights and Forecast - by Type
- 7.1.1. Less than 20kW
- 7.1.2. More than 20kW
- 7.1.3. World Electric Vehicle On-board Charger Product Production
- 7.2. Market Analysis, Insights and Forecast - by Application
- 7.2.1. Household
- 7.2.2. Commercial
- 7.2.3. Other
- 7.1. Market Analysis, Insights and Forecast - by Type
- 8. South America Electric Vehicle On-board Charger Product Analysis, Insights and Forecast, 2020-2032
- 8.1. Market Analysis, Insights and Forecast - by Type
- 8.1.1. Less than 20kW
- 8.1.2. More than 20kW
- 8.1.3. World Electric Vehicle On-board Charger Product Production
- 8.2. Market Analysis, Insights and Forecast - by Application
- 8.2.1. Household
- 8.2.2. Commercial
- 8.2.3. Other
- 8.1. Market Analysis, Insights and Forecast - by Type
- 9. Europe Electric Vehicle On-board Charger Product Analysis, Insights and Forecast, 2020-2032
- 9.1. Market Analysis, Insights and Forecast - by Type
- 9.1.1. Less than 20kW
- 9.1.2. More than 20kW
- 9.1.3. World Electric Vehicle On-board Charger Product Production
- 9.2. Market Analysis, Insights and Forecast - by Application
- 9.2.1. Household
- 9.2.2. Commercial
- 9.2.3. Other
- 9.1. Market Analysis, Insights and Forecast - by Type
- 10. Middle East & Africa Electric Vehicle On-board Charger Product Analysis, Insights and Forecast, 2020-2032
- 10.1. Market Analysis, Insights and Forecast - by Type
- 10.1.1. Less than 20kW
- 10.1.2. More than 20kW
- 10.1.3. World Electric Vehicle On-board Charger Product Production
- 10.2. Market Analysis, Insights and Forecast - by Application
- 10.2.1. Household
- 10.2.2. Commercial
- 10.2.3. Other
- 10.1. Market Analysis, Insights and Forecast - by Type
- 11. Asia Pacific Electric Vehicle On-board Charger Product Analysis, Insights and Forecast, 2020-2032
- 11.1. Market Analysis, Insights and Forecast - by Type
- 11.1.1. Less than 20kW
- 11.1.2. More than 20kW
- 11.1.3. World Electric Vehicle On-board Charger Product Production
- 11.2. Market Analysis, Insights and Forecast - by Application
- 11.2.1. Household
- 11.2.2. Commercial
- 11.2.3. Other
- 11.1. Market Analysis, Insights and Forecast - by Type
- 12. Competitive Analysis
- 12.1. Company Profiles
- 12.1.1 Bel Power solution
- 12.1.1.1. Company Overview
- 12.1.1.2. Products
- 12.1.1.3. Company Financials
- 12.1.1.4. SWOT Analysis
- 12.1.2 BRUSA Elektronik AG
- 12.1.2.1. Company Overview
- 12.1.2.2. Products
- 12.1.2.3. Company Financials
- 12.1.2.4. SWOT Analysis
- 12.1.3 Current Ways Inc.
- 12.1.3.1. Company Overview
- 12.1.3.2. Products
- 12.1.3.3. Company Financials
- 12.1.3.4. SWOT Analysis
- 12.1.4 Delphi Technologies
- 12.1.4.1. Company Overview
- 12.1.4.2. Products
- 12.1.4.3. Company Financials
- 12.1.4.4. SWOT Analysis
- 12.1.5 Eaton Corporation
- 12.1.5.1. Company Overview
- 12.1.5.2. Products
- 12.1.5.3. Company Financials
- 12.1.5.4. SWOT Analysis
- 12.1.6 Infineon Technologies AG
- 12.1.6.1. Company Overview
- 12.1.6.2. Products
- 12.1.6.3. Company Financials
- 12.1.6.4. SWOT Analysis
- 12.1.7 Innoelectric GmbH
- 12.1.7.1. Company Overview
- 12.1.7.2. Products
- 12.1.7.3. Company Financials
- 12.1.7.4. SWOT Analysis
- 12.1.8 Stercom Power Solutions GmbH
- 12.1.8.1. Company Overview
- 12.1.8.2. Products
- 12.1.8.3. Company Financials
- 12.1.8.4. SWOT Analysis
- 12.1.9 Toyota Industries Corporation
- 12.1.9.1. Company Overview
- 12.1.9.2. Products
- 12.1.9.3. Company Financials
- 12.1.9.4. SWOT Analysis
- 12.1.1 Bel Power solution
- 12.2. Market Entropy
- 12.2.1 Company's Key Areas Served
- 12.2.2 Recent Developments
- 12.3. Company Market Share Analysis 2025
- 12.3.1 Top 5 Companies Market Share Analysis
- 12.3.2 Top 3 Companies Market Share Analysis
- 12.4. List of Potential Customers
- 13. Research Methodology
List of Figures
- Figure 1: Global Electric Vehicle On-board Charger Product Revenue Breakdown (undefined, %) by Region 2025 & 2033
- Figure 2: North America Electric Vehicle On-board Charger Product Revenue (undefined), by Type 2025 & 2033
- Figure 3: North America Electric Vehicle On-board Charger Product Revenue Share (%), by Type 2025 & 2033
- Figure 4: North America Electric Vehicle On-board Charger Product Revenue (undefined), by Application 2025 & 2033
- Figure 5: North America Electric Vehicle On-board Charger Product Revenue Share (%), by Application 2025 & 2033
- Figure 6: North America Electric Vehicle On-board Charger Product Revenue (undefined), by Country 2025 & 2033
- Figure 7: North America Electric Vehicle On-board Charger Product Revenue Share (%), by Country 2025 & 2033
- Figure 8: South America Electric Vehicle On-board Charger Product Revenue (undefined), by Type 2025 & 2033
- Figure 9: South America Electric Vehicle On-board Charger Product Revenue Share (%), by Type 2025 & 2033
- Figure 10: South America Electric Vehicle On-board Charger Product Revenue (undefined), by Application 2025 & 2033
- Figure 11: South America Electric Vehicle On-board Charger Product Revenue Share (%), by Application 2025 & 2033
- Figure 12: South America Electric Vehicle On-board Charger Product Revenue (undefined), by Country 2025 & 2033
- Figure 13: South America Electric Vehicle On-board Charger Product Revenue Share (%), by Country 2025 & 2033
- Figure 14: Europe Electric Vehicle On-board Charger Product Revenue (undefined), by Type 2025 & 2033
- Figure 15: Europe Electric Vehicle On-board Charger Product Revenue Share (%), by Type 2025 & 2033
- Figure 16: Europe Electric Vehicle On-board Charger Product Revenue (undefined), by Application 2025 & 2033
- Figure 17: Europe Electric Vehicle On-board Charger Product Revenue Share (%), by Application 2025 & 2033
- Figure 18: Europe Electric Vehicle On-board Charger Product Revenue (undefined), by Country 2025 & 2033
- Figure 19: Europe Electric Vehicle On-board Charger Product Revenue Share (%), by Country 2025 & 2033
- Figure 20: Middle East & Africa Electric Vehicle On-board Charger Product Revenue (undefined), by Type 2025 & 2033
- Figure 21: Middle East & Africa Electric Vehicle On-board Charger Product Revenue Share (%), by Type 2025 & 2033
- Figure 22: Middle East & Africa Electric Vehicle On-board Charger Product Revenue (undefined), by Application 2025 & 2033
- Figure 23: Middle East & Africa Electric Vehicle On-board Charger Product Revenue Share (%), by Application 2025 & 2033
- Figure 24: Middle East & Africa Electric Vehicle On-board Charger Product Revenue (undefined), by Country 2025 & 2033
- Figure 25: Middle East & Africa Electric Vehicle On-board Charger Product Revenue Share (%), by Country 2025 & 2033
- Figure 26: Asia Pacific Electric Vehicle On-board Charger Product Revenue (undefined), by Type 2025 & 2033
- Figure 27: Asia Pacific Electric Vehicle On-board Charger Product Revenue Share (%), by Type 2025 & 2033
- Figure 28: Asia Pacific Electric Vehicle On-board Charger Product Revenue (undefined), by Application 2025 & 2033
- Figure 29: Asia Pacific Electric Vehicle On-board Charger Product Revenue Share (%), by Application 2025 & 2033
- Figure 30: Asia Pacific Electric Vehicle On-board Charger Product Revenue (undefined), by Country 2025 & 2033
- Figure 31: Asia Pacific Electric Vehicle On-board Charger Product Revenue Share (%), by Country 2025 & 2033
List of Tables
- Table 1: Global Electric Vehicle On-board Charger Product Revenue undefined Forecast, by Type 2020 & 2033
- Table 2: Global Electric Vehicle On-board Charger Product Revenue undefined Forecast, by Application 2020 & 2033
- Table 3: Global Electric Vehicle On-board Charger Product Revenue undefined Forecast, by Region 2020 & 2033
- Table 4: Global Electric Vehicle On-board Charger Product Revenue undefined Forecast, by Type 2020 & 2033
- Table 5: Global Electric Vehicle On-board Charger Product Revenue undefined Forecast, by Application 2020 & 2033
- Table 6: Global Electric Vehicle On-board Charger Product Revenue undefined Forecast, by Country 2020 & 2033
- Table 7: United States Electric Vehicle On-board Charger Product Revenue (undefined) Forecast, by Application 2020 & 2033
- Table 8: Canada Electric Vehicle On-board Charger Product Revenue (undefined) Forecast, by Application 2020 & 2033
- Table 9: Mexico Electric Vehicle On-board Charger Product Revenue (undefined) Forecast, by Application 2020 & 2033
- Table 10: Global Electric Vehicle On-board Charger Product Revenue undefined Forecast, by Type 2020 & 2033
- Table 11: Global Electric Vehicle On-board Charger Product Revenue undefined Forecast, by Application 2020 & 2033
- Table 12: Global Electric Vehicle On-board Charger Product Revenue undefined Forecast, by Country 2020 & 2033
- Table 13: Brazil Electric Vehicle On-board Charger Product Revenue (undefined) Forecast, by Application 2020 & 2033
- Table 14: Argentina Electric Vehicle On-board Charger Product Revenue (undefined) Forecast, by Application 2020 & 2033
- Table 15: Rest of South America Electric Vehicle On-board Charger Product Revenue (undefined) Forecast, by Application 2020 & 2033
- Table 16: Global Electric Vehicle On-board Charger Product Revenue undefined Forecast, by Type 2020 & 2033
- Table 17: Global Electric Vehicle On-board Charger Product Revenue undefined Forecast, by Application 2020 & 2033
- Table 18: Global Electric Vehicle On-board Charger Product Revenue undefined Forecast, by Country 2020 & 2033
- Table 19: United Kingdom Electric Vehicle On-board Charger Product Revenue (undefined) Forecast, by Application 2020 & 2033
- Table 20: Germany Electric Vehicle On-board Charger Product Revenue (undefined) Forecast, by Application 2020 & 2033
- Table 21: France Electric Vehicle On-board Charger Product Revenue (undefined) Forecast, by Application 2020 & 2033
- Table 22: Italy Electric Vehicle On-board Charger Product Revenue (undefined) Forecast, by Application 2020 & 2033
- Table 23: Spain Electric Vehicle On-board Charger Product Revenue (undefined) Forecast, by Application 2020 & 2033
- Table 24: Russia Electric Vehicle On-board Charger Product Revenue (undefined) Forecast, by Application 2020 & 2033
- Table 25: Benelux Electric Vehicle On-board Charger Product Revenue (undefined) Forecast, by Application 2020 & 2033
- Table 26: Nordics Electric Vehicle On-board Charger Product Revenue (undefined) Forecast, by Application 2020 & 2033
- Table 27: Rest of Europe Electric Vehicle On-board Charger Product Revenue (undefined) Forecast, by Application 2020 & 2033
- Table 28: Global Electric Vehicle On-board Charger Product Revenue undefined Forecast, by Type 2020 & 2033
- Table 29: Global Electric Vehicle On-board Charger Product Revenue undefined Forecast, by Application 2020 & 2033
- Table 30: Global Electric Vehicle On-board Charger Product Revenue undefined Forecast, by Country 2020 & 2033
- Table 31: Turkey Electric Vehicle On-board Charger Product Revenue (undefined) Forecast, by Application 2020 & 2033
- Table 32: Israel Electric Vehicle On-board Charger Product Revenue (undefined) Forecast, by Application 2020 & 2033
- Table 33: GCC Electric Vehicle On-board Charger Product Revenue (undefined) Forecast, by Application 2020 & 2033
- Table 34: North Africa Electric Vehicle On-board Charger Product Revenue (undefined) Forecast, by Application 2020 & 2033
- Table 35: South Africa Electric Vehicle On-board Charger Product Revenue (undefined) Forecast, by Application 2020 & 2033
- Table 36: Rest of Middle East & Africa Electric Vehicle On-board Charger Product Revenue (undefined) Forecast, by Application 2020 & 2033
- Table 37: Global Electric Vehicle On-board Charger Product Revenue undefined Forecast, by Type 2020 & 2033
- Table 38: Global Electric Vehicle On-board Charger Product Revenue undefined Forecast, by Application 2020 & 2033
- Table 39: Global Electric Vehicle On-board Charger Product Revenue undefined Forecast, by Country 2020 & 2033
- Table 40: China Electric Vehicle On-board Charger Product Revenue (undefined) Forecast, by Application 2020 & 2033
- Table 41: India Electric Vehicle On-board Charger Product Revenue (undefined) Forecast, by Application 2020 & 2033
- Table 42: Japan Electric Vehicle On-board Charger Product Revenue (undefined) Forecast, by Application 2020 & 2033
- Table 43: South Korea Electric Vehicle On-board Charger Product Revenue (undefined) Forecast, by Application 2020 & 2033
- Table 44: ASEAN Electric Vehicle On-board Charger Product Revenue (undefined) Forecast, by Application 2020 & 2033
- Table 45: Oceania Electric Vehicle On-board Charger Product Revenue (undefined) Forecast, by Application 2020 & 2033
- Table 46: Rest of Asia Pacific Electric Vehicle On-board Charger Product Revenue (undefined) Forecast, by Application 2020 & 2033
Frequently Asked Questions
1. What is the projected Compound Annual Growth Rate (CAGR) of the Electric Vehicle On-board Charger Product?
The projected CAGR is approximately 20.1%.
2. Which companies are prominent players in the Electric Vehicle On-board Charger Product?
Key companies in the market include Bel Power solution, BRUSA Elektronik AG, Current Ways Inc., Delphi Technologies, Eaton Corporation, Infineon Technologies AG, Innoelectric GmbH, Stercom Power Solutions GmbH, Toyota Industries Corporation.
3. What are the main segments of the Electric Vehicle On-board Charger Product?
The market segments include Type, Application.
4. Can you provide details about the market size?
The market size is estimated to be USD XXX N/A as of 2022.
5. What are some drivers contributing to market growth?
N/A
6. What are the notable trends driving market growth?
N/A
7. Are there any restraints impacting market growth?
N/A
8. Can you provide examples of recent developments in the market?
N/A
9. What pricing options are available for accessing the report?
Pricing options include single-user, multi-user, and enterprise licenses priced at USD 2900.00, USD 4350.00, and USD 5800.00 respectively.
10. Is the market size provided in terms of value or volume?
The market size is provided in terms of value, measured in N/A.
11. Are there any specific market keywords associated with the report?
Yes, the market keyword associated with the report is "Electric Vehicle On-board Charger Product," which aids in identifying and referencing the specific market segment covered.
12. How do I determine which pricing option suits my needs best?
The pricing options vary based on user requirements and access needs. Individual users may opt for single-user licenses, while businesses requiring broader access may choose multi-user or enterprise licenses for cost-effective access to the report.
13. Are there any additional resources or data provided in the Electric Vehicle On-board Charger Product report?
While the report offers comprehensive insights, it's advisable to review the specific contents or supplementary materials provided to ascertain if additional resources or data are available.
14. How can I stay updated on further developments or reports in the Electric Vehicle On-board Charger Product?
To stay informed about further developments, trends, and reports in the Electric Vehicle On-board Charger Product, consider subscribing to industry newsletters, following relevant companies and organizations, or regularly checking reputable industry news sources and publications.
Methodology
Step 1 - Identification of Relevant Samples Size from Population Database


Step 2 - Approaches for Defining Global Market Size (Value, Volume* & Price*)

Note*: In applicable scenarios
Step 3 - Data Sources
Primary Research
- Web Analytics
- Survey Reports
- Research Institute
- Latest Research Reports
- Opinion Leaders
Secondary Research
- Annual Reports
- White Paper
- Latest Press Release
- Industry Association
- Paid Database
- Investor Presentations

Step 4 - Data Triangulation
Involves using different sources of information in order to increase the validity of a study
These sources are likely to be stakeholders in a program - participants, other researchers, program staff, other community members, and so on.
Then we put all data in single framework & apply various statistical tools to find out the dynamic on the market.
During the analysis stage, feedback from the stakeholder groups would be compared to determine areas of agreement as well as areas of divergence