

Key Insights
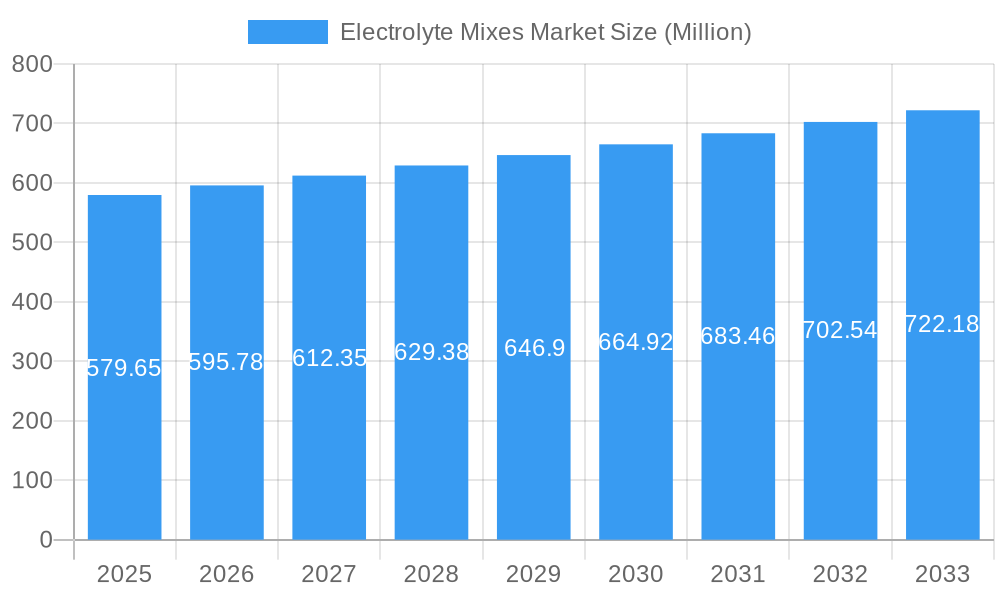
The global Electrolyte Mixes Market is poised for steady expansion, projected to reach USD 579.65 million in value. This growth is underpinned by a Compound Annual Growth Rate (CAGR) of 2.81% from 2019 to 2033, indicating sustained demand for products that support hydration and performance. The market is propelled by increasing consumer awareness regarding the importance of electrolyte balance for overall health, athletic performance, and recovery. The rising prevalence of chronic diseases and the growing elderly population also contribute to the demand for electrolyte replenishment solutions. Convenience is a significant driver, with the popularity of Ready-to-Drink (RTD) beverages and easily portable electrolyte powders and tablets catering to busy lifestyles and on-the-go consumption. Furthermore, the burgeoning health and wellness trend, coupled with greater accessibility through diverse distribution channels like supermarkets, convenience stores, pharmacies, and online retail, is expanding the market's reach. Innovation in product formulations, including a wider array of flavors and sugar-free options, is also attracting a broader consumer base, from athletes to general health-conscious individuals.
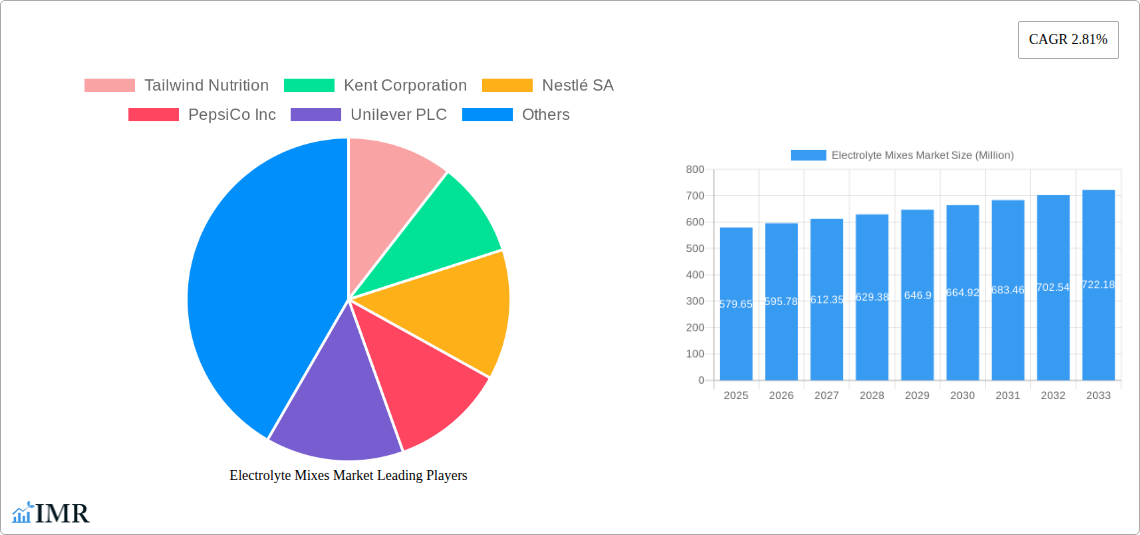
Electrolyte Mixes Market Market Size (In Million)
Despite the positive outlook, certain factors could temper growth. The competitive landscape is intense, with numerous players vying for market share. While the market benefits from robust demand drivers, potential restraints include fluctuating raw material costs and the emergence of new, alternative hydration solutions. Nonetheless, the overarching trend points towards continued market penetration driven by an increasing focus on preventative healthcare and performance optimization. Key market segments include RTD beverages, electrolyte powders, and tablets, with flavored variants leading consumer preference. Distribution channels are diverse, with supermarkets/hypermarkets and online retail stores being particularly dominant. Geographically, North America is anticipated to be a leading region, driven by a strong health and fitness culture, followed by Europe and the Asia Pacific, which is expected to witness significant growth due to increasing disposable incomes and rising health consciousness. Companies such as Nestlé SA, PepsiCo Inc., and Abbott Laboratories are key players, actively innovating and expanding their offerings to capture market opportunities.
Electrolyte Mixes Market Company Market Share
Comprehensive Electrolyte Mixes Market Report: Growth, Trends, and Competitive Landscape (2019-2033)
This in-depth report provides a definitive analysis of the global Electrolyte Mixes Market, offering critical insights for stakeholders seeking to navigate this dynamic industry. Covering the period from 2019 to 2033, with a detailed focus on the Base Year 2025 and the Forecast Period 2025–2033, this report delves into market size, growth drivers, key trends, regional dominance, product innovations, and the competitive landscape. Utilizing a wealth of data and strategic analysis, this report equips industry professionals with the intelligence needed to capitalize on emerging opportunities and overcome market challenges.
Electrolyte Mixes Market Market Dynamics & Structure
The global Electrolyte Mixes Market is characterized by a moderate market concentration, with several key players holding significant market share. Technological innovation is a primary driver, fueled by advancements in ingredient formulation and product delivery systems, such as the increasing demand for functional hydration solutions. Regulatory frameworks, particularly concerning health claims and ingredient sourcing, play a crucial role in shaping product development and market entry strategies. The competitive landscape features a range of product substitutes, including sports drinks, natural electrolyte sources, and other functional beverages, intensifying the need for product differentiation. End-user demographics are evolving, with a growing emphasis on health-conscious consumers, athletes of all levels, and individuals seeking post-illness recovery aids. Mergers and acquisitions (M&A) trends indicate a strategic consolidation phase, with companies aiming to expand their product portfolios and market reach. For instance, the acquisition of Nuun by Nestlé Health Science in July 2021 exemplifies this trend, bolstering Nestlé's functional hydration offerings. Key innovation barriers include the high cost of R&D for novel formulations and stringent regulatory approvals. The market is projected to witness a CAGR of approximately 7.5% during the forecast period.
- Market Concentration: Dominated by a mix of large corporations and specialized niche players.
- Technological Innovation: Focus on enhanced absorption, natural ingredients, and diverse delivery formats (powders, RTDs, tablets).
- Regulatory Frameworks: Stringent oversight on health claims, nutritional labeling, and ingredient safety.
- Competitive Product Substitutes: Sports drinks, coconut water, electrolyte-infused waters.
- End-User Demographics: Growing demand from athletes, fitness enthusiasts, and health-conscious individuals.
- M&A Trends: Strategic acquisitions for portfolio expansion and market penetration.
- Innovation Barriers: High R&D costs, regulatory hurdles, and consumer education requirements.
Electrolyte Mixes Market Growth Trends & Insights
The Electrolyte Mixes Market is experiencing robust growth, driven by increasing consumer awareness regarding the importance of hydration and electrolyte balance for overall health and performance. The market size is projected to reach an estimated $12,500 million by the end of 2025, with a significant compound annual growth rate (CAGR) of approximately 7.5% anticipated throughout the forecast period of 2025–2033. Adoption rates are steadily increasing across various consumer segments, from elite athletes to everyday individuals seeking to replenish lost fluids and minerals. Technological disruptions, such as the development of advanced electrolyte delivery systems and the incorporation of novel ingredients like probiotics and adaptogens, are further fueling market expansion. Consumer behavior shifts are a pivotal influence; there's a discernible trend towards seeking natural, scientifically backed hydration solutions with added functional benefits. This includes a growing preference for plant-based ingredients and transparent labeling. The Base Year 2025 is estimated to have a market value of $12,500 million. The Historical Period 2019–2024 witnessed a steady upward trajectory, laying the foundation for the projected growth. The market penetration for electrolyte mixes is expected to deepen as more consumers integrate these products into their daily routines for athletic recovery, travel, and general well-being. The advent of specialized electrolyte formulations catering to specific needs, such as those for endurance sports or cognitive function, is also contributing to market diversification and expansion. Furthermore, the increasing prevalence of lifestyle-related health issues and a greater focus on preventative healthcare are driving demand for products that support bodily functions, with electrolyte mixes playing a key role in maintaining hydration and nutrient balance. The market's ability to adapt to evolving consumer demands for convenience, efficacy, and clean ingredient profiles will be crucial for sustained growth.
Dominant Regions, Countries, or Segments in Electrolyte Mixes Market
North America currently holds a dominant position in the global Electrolyte Mixes Market, driven by a highly health-conscious consumer base, a well-developed sports and fitness infrastructure, and a high disposable income that facilitates the adoption of premium health and wellness products. The United States, in particular, is a significant contributor to this dominance, with a substantial market share attributed to strong brand presence, extensive distribution networks, and widespread consumer engagement with sports and physical activities. The convenience and widespread availability of electrolyte mixes through various channels, including supermarkets, convenience stores, and a burgeoning online retail sector, further solidify North America's lead.
Product Type Dominance: Electrolyte Powders
Within the product type segmentation, Electrolyte Powders are emerging as the dominant segment, accounting for an estimated 45% of the market share in 2025. This dominance is driven by their cost-effectiveness, portability, and versatility. Consumers can easily mix powders with water to create their desired concentration and flavor profile. Their long shelf life and compact nature make them ideal for travel and storage, appealing to a broad range of users from athletes to everyday consumers. The segment's growth is further propelled by ongoing innovation in powder formulations, offering improved mixability and faster dissolution rates.
Flavor Dominance: Flavored
The Flavored segment significantly leads the Electrolyte Mixes Market, capturing an estimated 65% of the market share. This preference is deeply rooted in consumer taste preferences, making hydration more palatable and enjoyable. A wide array of flavor options, ranging from fruity to more sophisticated blends, caters to diverse palates and encourages regular consumption. The development of natural and exotic flavors is a key growth accelerator within this segment, attracting a broader consumer base seeking both functional benefits and a pleasant sensory experience.
Distribution Channel Dominance: Supermarkets/Hypermarkets
Supermarkets/Hypermarkets represent the most dominant distribution channel for electrolyte mixes, estimated to hold a 38% market share in 2025. This channel's dominance stems from its broad reach, accessibility, and the ability to cater to a large consumer base performing routine grocery shopping. The one-stop-shop convenience offered by these retailers, coupled with prominent product placement and promotional activities, drives significant sales volume. The continued expansion of private label offerings within this channel also contributes to its market leadership by providing consumers with a wider range of price points and options.
Electrolyte Mixes Market Product Landscape
The Electrolyte Mixes Market is witnessing continuous product innovation, with a strong emphasis on enhancing bioavailability, taste, and functional benefits. Companies are developing advanced formulations that offer rapid hydration and replenishment of essential electrolytes like sodium, potassium, and magnesium. Emerging product types include effervescent tablets for quick dissolution and customizable powder mixes with added vitamins, minerals, and probiotics to support gut health and immunity. These innovations cater to diverse consumer needs, from endurance athletes requiring sustained energy to individuals seeking recovery from illness or dehydration. Unique selling propositions often revolve around natural ingredient sourcing, allergen-free formulations, and scientifically validated performance claims.
Key Drivers, Barriers & Challenges in Electrolyte Mixes Market
The Electrolyte Mixes Market is propelled by several key drivers, including the escalating global interest in health and wellness, a growing participation in sports and fitness activities, and increasing consumer awareness of the importance of hydration for optimal bodily function. Technological advancements in product formulation and delivery systems are also significant growth catalysts.
- Key Drivers:
- Rising health consciousness and demand for functional beverages.
- Growth in sports participation and active lifestyles.
- Increasing awareness of hydration's role in performance and recovery.
- Innovation in ingredients and delivery formats.
Conversely, the market faces several barriers and challenges that can impede growth. These include intense competition from established beverage brands and natural alternatives, stringent regulatory requirements for health claims, and potential price sensitivity among certain consumer segments. Supply chain disruptions and the cost of raw materials can also impact profitability and market stability.
- Key Barriers & Challenges:
- High competition from sports drinks and other beverages.
- Strict regulatory scrutiny on health claims.
- Price sensitivity and demand for value-for-money products.
- Supply chain volatility and raw material cost fluctuations.
- Consumer education on the specific benefits of electrolyte mixes.
Emerging Opportunities in Electrolyte Mixes Market
Emerging opportunities in the Electrolyte Mixes Market lie in the development of specialized formulations for niche consumer groups, such as pregnant women, the elderly, and individuals with specific medical conditions. The growing demand for plant-based and organic electrolyte mixes presents a significant untapped market. Furthermore, exploring innovative delivery formats, like dissolvable strips or ready-to-drink options with extended shelf lives, can capture new consumer segments. The integration of smart packaging and personalized hydration solutions, leveraging wearable technology, also represents a forward-looking opportunity.
Growth Accelerators in the Electrolyte Mixes Market Industry
Long-term growth in the Electrolyte Mixes Market will be significantly accelerated by continuous technological breakthroughs in ingredient science, leading to more effective and bioavailable electrolyte formulations. Strategic partnerships between electrolyte mix manufacturers and sports organizations, fitness centers, and healthcare providers will expand market reach and build brand credibility. Furthermore, aggressive market expansion strategies, including penetration into emerging economies and the development of culturally relevant product offerings, will be crucial for sustained growth. The increasing acceptance of e-commerce for health and wellness products also acts as a major accelerator.
Key Players Shaping the Electrolyte Mixes Market Market
- Tailwind Nutrition
- Kent Corporation
- Nestlé SA
- PepsiCo Inc
- Unilever PLC
- Abbott Laboratories
- LyteLine LLC
- Otsuka Holdings Co Ltd
- Vitalyte Sports Nutrition Inc
- Ultima Health Products Inc
Notable Milestones in Electrolyte Mixes Market Sector
- MAY 2022: Liquid IV announced the launch of Hydration Multiplier+ Powdered Probiotic Kombucha, a blendable mixture that contains electrolytes, Liquid IV's BC30 Probiotic, which boasts an impressive 1 billion colony forming units (CFU), and a powdered kombucha. These components together help in boosting gut health.
- MAR 2022: Canada Soccer and Gatorade Canada announced a new multi-year partnership to establish Gatorade Canada as the official Isotonic and Sports Nutrition partner of Canada Soccer.
- JUL 2021: The Nestlé Health Science Company announced the successful acquisition of Nuun, a leading provider of functional hydration products, including effervescent tablets and powders.
In-Depth Electrolyte Mixes Market Market Outlook
The Electrolyte Mixes Market is poised for sustained growth, driven by an ever-increasing global focus on health, wellness, and active living. Future market potential will be significantly shaped by continued innovation in product formulation, with a strong emphasis on natural ingredients, personalized hydration solutions, and the integration of synergistic functional ingredients. Strategic partnerships and a robust expansion into emerging markets will be critical for unlocking new revenue streams. The increasing consumer demand for transparent labeling and scientifically backed products will also guide future product development. Overall, the market presents a promising landscape for companies that can effectively cater to evolving consumer preferences and leverage technological advancements to deliver superior hydration and wellness solutions.
Electrolyte Mixes Market Segmentation
-
1. Product Type
- 1.1. RTD Beverages
- 1.2. Electrolyte Powders
- 1.3. Tablets
-
2. Flavor
- 2.1. Flavored
- 2.2. Unflavored
-
3. Distribution Channel
- 3.1. Supermarkets/Hypermarkets
- 3.2. Convenience Stores
- 3.3. Pharmacies/Drug Stores
- 3.4. Online Retail Stores
- 3.5. Other Distribution Channels
Electrolyte Mixes Market Segmentation By Geography
-
1. North America
- 1.1. United States
- 1.2. Canada
- 1.3. Mexico
- 1.4. Rest of North America
-
2. Europe
- 2.1. United Kingdom
- 2.2. Germany
- 2.3. France
- 2.4. Russia
- 2.5. Italy
- 2.6. Spain
- 2.7. Rest of Europe
-
3. Asia Pacific
- 3.1. China
- 3.2. India
- 3.3. Japan
- 3.4. Australia
- 3.5. Rest of Asia Pacific
-
4. South America
- 4.1. Brazil
- 4.2. Argentina
- 4.3. Rest of South America
-
5. Middle East and Africa
- 5.1. South Africa
- 5.2. United Arab Emirates
- 5.3. Rest of Middle East and Africa
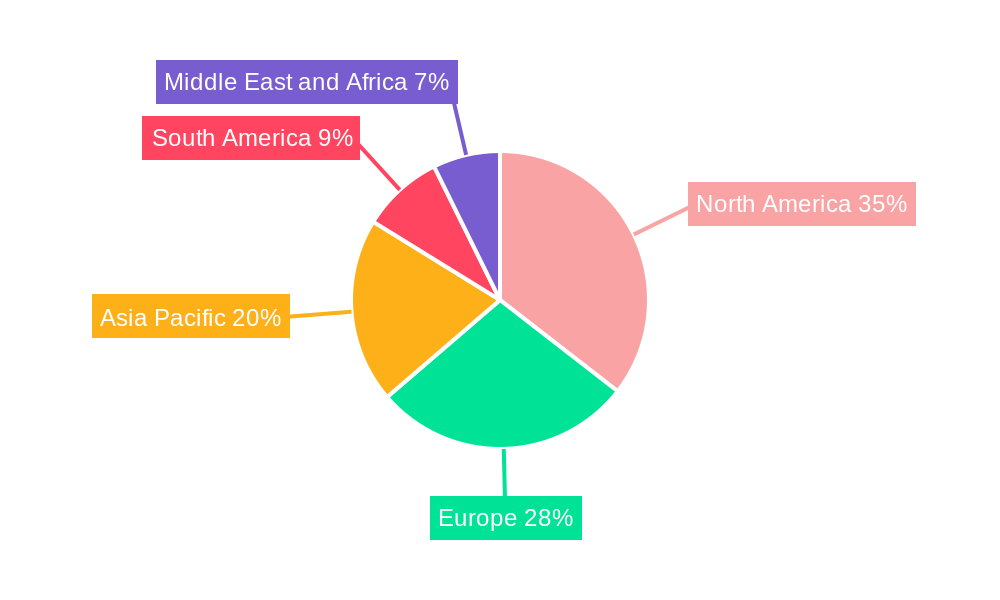
Electrolyte Mixes Market Regional Market Share
Geographic Coverage of Electrolyte Mixes Market
Electrolyte Mixes Market REPORT HIGHLIGHTS
| Aspects | Details |
|---|---|
| Study Period | 2020-2034 |
| Base Year | 2025 |
| Estimated Year | 2026 |
| Forecast Period | 2026-2034 |
| Historical Period | 2020-2025 |
| Growth Rate | CAGR of 2.81% from 2020-2034 |
| Segmentation |
|
Table of Contents
- 1. Introduction
- 1.1. Research Scope
- 1.2. Market Segmentation
- 1.3. Research Objective
- 1.4. Definitions and Assumptions
- 2. Executive Summary
- 2.1. Market Snapshot
- 3. Market Dynamics
- 3.1. Market Drivers
- 3.2. Market Restrains
- 3.3. Market Trends
- 3.4. Market Opportunities
- 4. Market Factor Analysis
- 4.1. Porters Five Forces
- 4.1.1. Bargaining Power of Suppliers
- 4.1.2. Bargaining Power of Buyers
- 4.1.3. Threat of New Entrants
- 4.1.4. Threat of Substitutes
- 4.1.5. Competitive Rivalry
- 4.2. PESTEL analysis
- 4.3. BCG Analysis
- 4.3.1. Stars (High Growth, High Market Share)
- 4.3.2. Cash Cows (Low Growth, High Market Share)
- 4.3.3. Question Mark (High Growth, Low Market Share)
- 4.3.4. Dogs (Low Growth, Low Market Share)
- 4.4. Ansoff Matrix Analysis
- 4.5. Supply Chain Analysis
- 4.6. Regulatory Landscape
- 4.7. Current Market Potential and Opportunity Assessment (TAM–SAM–SOM Framework)
- 4.8. IMR Analyst Note
- 4.1. Porters Five Forces
- 5. Market Analysis, Insights and Forecast 2021-2033
- 5.1. Market Analysis, Insights and Forecast - by Product Type
- 5.1.1. RTD Beverages
- 5.1.2. Electrolyte Powders
- 5.1.3. Tablets
- 5.2. Market Analysis, Insights and Forecast - by Flavor
- 5.2.1. Flavored
- 5.2.2. Unflavored
- 5.3. Market Analysis, Insights and Forecast - by Distribution Channel
- 5.3.1. Supermarkets/Hypermarkets
- 5.3.2. Convenience Stores
- 5.3.3. Pharmacies/Drug Stores
- 5.3.4. Online Retail Stores
- 5.3.5. Other Distribution Channels
- 5.4. Market Analysis, Insights and Forecast - by Region
- 5.4.1. North America
- 5.4.2. Europe
- 5.4.3. Asia Pacific
- 5.4.4. South America
- 5.4.5. Middle East and Africa
- 5.1. Market Analysis, Insights and Forecast - by Product Type
- 6. Global Electrolyte Mixes Market Analysis, Insights and Forecast, 2021-2033
- 6.1. Market Analysis, Insights and Forecast - by Product Type
- 6.1.1. RTD Beverages
- 6.1.2. Electrolyte Powders
- 6.1.3. Tablets
- 6.2. Market Analysis, Insights and Forecast - by Flavor
- 6.2.1. Flavored
- 6.2.2. Unflavored
- 6.3. Market Analysis, Insights and Forecast - by Distribution Channel
- 6.3.1. Supermarkets/Hypermarkets
- 6.3.2. Convenience Stores
- 6.3.3. Pharmacies/Drug Stores
- 6.3.4. Online Retail Stores
- 6.3.5. Other Distribution Channels
- 6.1. Market Analysis, Insights and Forecast - by Product Type
- 7. North America Electrolyte Mixes Market Analysis, Insights and Forecast, 2020-2032
- 7.1. Market Analysis, Insights and Forecast - by Product Type
- 7.1.1. RTD Beverages
- 7.1.2. Electrolyte Powders
- 7.1.3. Tablets
- 7.2. Market Analysis, Insights and Forecast - by Flavor
- 7.2.1. Flavored
- 7.2.2. Unflavored
- 7.3. Market Analysis, Insights and Forecast - by Distribution Channel
- 7.3.1. Supermarkets/Hypermarkets
- 7.3.2. Convenience Stores
- 7.3.3. Pharmacies/Drug Stores
- 7.3.4. Online Retail Stores
- 7.3.5. Other Distribution Channels
- 7.1. Market Analysis, Insights and Forecast - by Product Type
- 8. Europe Electrolyte Mixes Market Analysis, Insights and Forecast, 2020-2032
- 8.1. Market Analysis, Insights and Forecast - by Product Type
- 8.1.1. RTD Beverages
- 8.1.2. Electrolyte Powders
- 8.1.3. Tablets
- 8.2. Market Analysis, Insights and Forecast - by Flavor
- 8.2.1. Flavored
- 8.2.2. Unflavored
- 8.3. Market Analysis, Insights and Forecast - by Distribution Channel
- 8.3.1. Supermarkets/Hypermarkets
- 8.3.2. Convenience Stores
- 8.3.3. Pharmacies/Drug Stores
- 8.3.4. Online Retail Stores
- 8.3.5. Other Distribution Channels
- 8.1. Market Analysis, Insights and Forecast - by Product Type
- 9. Asia Pacific Electrolyte Mixes Market Analysis, Insights and Forecast, 2020-2032
- 9.1. Market Analysis, Insights and Forecast - by Product Type
- 9.1.1. RTD Beverages
- 9.1.2. Electrolyte Powders
- 9.1.3. Tablets
- 9.2. Market Analysis, Insights and Forecast - by Flavor
- 9.2.1. Flavored
- 9.2.2. Unflavored
- 9.3. Market Analysis, Insights and Forecast - by Distribution Channel
- 9.3.1. Supermarkets/Hypermarkets
- 9.3.2. Convenience Stores
- 9.3.3. Pharmacies/Drug Stores
- 9.3.4. Online Retail Stores
- 9.3.5. Other Distribution Channels
- 9.1. Market Analysis, Insights and Forecast - by Product Type
- 10. South America Electrolyte Mixes Market Analysis, Insights and Forecast, 2020-2032
- 10.1. Market Analysis, Insights and Forecast - by Product Type
- 10.1.1. RTD Beverages
- 10.1.2. Electrolyte Powders
- 10.1.3. Tablets
- 10.2. Market Analysis, Insights and Forecast - by Flavor
- 10.2.1. Flavored
- 10.2.2. Unflavored
- 10.3. Market Analysis, Insights and Forecast - by Distribution Channel
- 10.3.1. Supermarkets/Hypermarkets
- 10.3.2. Convenience Stores
- 10.3.3. Pharmacies/Drug Stores
- 10.3.4. Online Retail Stores
- 10.3.5. Other Distribution Channels
- 10.1. Market Analysis, Insights and Forecast - by Product Type
- 11. Middle East and Africa Electrolyte Mixes Market Analysis, Insights and Forecast, 2020-2032
- 11.1. Market Analysis, Insights and Forecast - by Product Type
- 11.1.1. RTD Beverages
- 11.1.2. Electrolyte Powders
- 11.1.3. Tablets
- 11.2. Market Analysis, Insights and Forecast - by Flavor
- 11.2.1. Flavored
- 11.2.2. Unflavored
- 11.3. Market Analysis, Insights and Forecast - by Distribution Channel
- 11.3.1. Supermarkets/Hypermarkets
- 11.3.2. Convenience Stores
- 11.3.3. Pharmacies/Drug Stores
- 11.3.4. Online Retail Stores
- 11.3.5. Other Distribution Channels
- 11.1. Market Analysis, Insights and Forecast - by Product Type
- 12. Competitive Analysis
- 12.1. Company Profiles
- 12.1.1 Tailwind Nutrition
- 12.1.1.1. Company Overview
- 12.1.1.2. Products
- 12.1.1.3. Company Financials
- 12.1.1.4. SWOT Analysis
- 12.1.2 Kent Corporation
- 12.1.2.1. Company Overview
- 12.1.2.2. Products
- 12.1.2.3. Company Financials
- 12.1.2.4. SWOT Analysis
- 12.1.3 Nestlé SA
- 12.1.3.1. Company Overview
- 12.1.3.2. Products
- 12.1.3.3. Company Financials
- 12.1.3.4. SWOT Analysis
- 12.1.4 PepsiCo Inc
- 12.1.4.1. Company Overview
- 12.1.4.2. Products
- 12.1.4.3. Company Financials
- 12.1.4.4. SWOT Analysis
- 12.1.5 Unilever PLC
- 12.1.5.1. Company Overview
- 12.1.5.2. Products
- 12.1.5.3. Company Financials
- 12.1.5.4. SWOT Analysis
- 12.1.6 Abbott Laboratories
- 12.1.6.1. Company Overview
- 12.1.6.2. Products
- 12.1.6.3. Company Financials
- 12.1.6.4. SWOT Analysis
- 12.1.7 LyteLine LLC
- 12.1.7.1. Company Overview
- 12.1.7.2. Products
- 12.1.7.3. Company Financials
- 12.1.7.4. SWOT Analysis
- 12.1.8 Otsuka Holdings Co Ltd
- 12.1.8.1. Company Overview
- 12.1.8.2. Products
- 12.1.8.3. Company Financials
- 12.1.8.4. SWOT Analysis
- 12.1.9 Vitalyte Sports Nutrition Inc *List Not Exhaustive
- 12.1.9.1. Company Overview
- 12.1.9.2. Products
- 12.1.9.3. Company Financials
- 12.1.9.4. SWOT Analysis
- 12.1.10 Ultima Health Products Inc
- 12.1.10.1. Company Overview
- 12.1.10.2. Products
- 12.1.10.3. Company Financials
- 12.1.10.4. SWOT Analysis
- 12.1.1 Tailwind Nutrition
- 12.2. Market Entropy
- 12.2.1 Company's Key Areas Served
- 12.2.2 Recent Developments
- 12.3. Company Market Share Analysis 2025
- 12.3.1 Top 5 Companies Market Share Analysis
- 12.3.2 Top 3 Companies Market Share Analysis
- 12.4. List of Potential Customers
- 13. Research Methodology
List of Figures
- Figure 1: Global Electrolyte Mixes Market Revenue Breakdown (Million, %) by Region 2025 & 2033
- Figure 2: North America Electrolyte Mixes Market Revenue (Million), by Product Type 2025 & 2033
- Figure 3: North America Electrolyte Mixes Market Revenue Share (%), by Product Type 2025 & 2033
- Figure 4: North America Electrolyte Mixes Market Revenue (Million), by Flavor 2025 & 2033
- Figure 5: North America Electrolyte Mixes Market Revenue Share (%), by Flavor 2025 & 2033
- Figure 6: North America Electrolyte Mixes Market Revenue (Million), by Distribution Channel 2025 & 2033
- Figure 7: North America Electrolyte Mixes Market Revenue Share (%), by Distribution Channel 2025 & 2033
- Figure 8: North America Electrolyte Mixes Market Revenue (Million), by Country 2025 & 2033
- Figure 9: North America Electrolyte Mixes Market Revenue Share (%), by Country 2025 & 2033
- Figure 10: Europe Electrolyte Mixes Market Revenue (Million), by Product Type 2025 & 2033
- Figure 11: Europe Electrolyte Mixes Market Revenue Share (%), by Product Type 2025 & 2033
- Figure 12: Europe Electrolyte Mixes Market Revenue (Million), by Flavor 2025 & 2033
- Figure 13: Europe Electrolyte Mixes Market Revenue Share (%), by Flavor 2025 & 2033
- Figure 14: Europe Electrolyte Mixes Market Revenue (Million), by Distribution Channel 2025 & 2033
- Figure 15: Europe Electrolyte Mixes Market Revenue Share (%), by Distribution Channel 2025 & 2033
- Figure 16: Europe Electrolyte Mixes Market Revenue (Million), by Country 2025 & 2033
- Figure 17: Europe Electrolyte Mixes Market Revenue Share (%), by Country 2025 & 2033
- Figure 18: Asia Pacific Electrolyte Mixes Market Revenue (Million), by Product Type 2025 & 2033
- Figure 19: Asia Pacific Electrolyte Mixes Market Revenue Share (%), by Product Type 2025 & 2033
- Figure 20: Asia Pacific Electrolyte Mixes Market Revenue (Million), by Flavor 2025 & 2033
- Figure 21: Asia Pacific Electrolyte Mixes Market Revenue Share (%), by Flavor 2025 & 2033
- Figure 22: Asia Pacific Electrolyte Mixes Market Revenue (Million), by Distribution Channel 2025 & 2033
- Figure 23: Asia Pacific Electrolyte Mixes Market Revenue Share (%), by Distribution Channel 2025 & 2033
- Figure 24: Asia Pacific Electrolyte Mixes Market Revenue (Million), by Country 2025 & 2033
- Figure 25: Asia Pacific Electrolyte Mixes Market Revenue Share (%), by Country 2025 & 2033
- Figure 26: South America Electrolyte Mixes Market Revenue (Million), by Product Type 2025 & 2033
- Figure 27: South America Electrolyte Mixes Market Revenue Share (%), by Product Type 2025 & 2033
- Figure 28: South America Electrolyte Mixes Market Revenue (Million), by Flavor 2025 & 2033
- Figure 29: South America Electrolyte Mixes Market Revenue Share (%), by Flavor 2025 & 2033
- Figure 30: South America Electrolyte Mixes Market Revenue (Million), by Distribution Channel 2025 & 2033
- Figure 31: South America Electrolyte Mixes Market Revenue Share (%), by Distribution Channel 2025 & 2033
- Figure 32: South America Electrolyte Mixes Market Revenue (Million), by Country 2025 & 2033
- Figure 33: South America Electrolyte Mixes Market Revenue Share (%), by Country 2025 & 2033
- Figure 34: Middle East and Africa Electrolyte Mixes Market Revenue (Million), by Product Type 2025 & 2033
- Figure 35: Middle East and Africa Electrolyte Mixes Market Revenue Share (%), by Product Type 2025 & 2033
- Figure 36: Middle East and Africa Electrolyte Mixes Market Revenue (Million), by Flavor 2025 & 2033
- Figure 37: Middle East and Africa Electrolyte Mixes Market Revenue Share (%), by Flavor 2025 & 2033
- Figure 38: Middle East and Africa Electrolyte Mixes Market Revenue (Million), by Distribution Channel 2025 & 2033
- Figure 39: Middle East and Africa Electrolyte Mixes Market Revenue Share (%), by Distribution Channel 2025 & 2033
- Figure 40: Middle East and Africa Electrolyte Mixes Market Revenue (Million), by Country 2025 & 2033
- Figure 41: Middle East and Africa Electrolyte Mixes Market Revenue Share (%), by Country 2025 & 2033
List of Tables
- Table 1: Global Electrolyte Mixes Market Revenue Million Forecast, by Product Type 2020 & 2033
- Table 2: Global Electrolyte Mixes Market Revenue Million Forecast, by Flavor 2020 & 2033
- Table 3: Global Electrolyte Mixes Market Revenue Million Forecast, by Distribution Channel 2020 & 2033
- Table 4: Global Electrolyte Mixes Market Revenue Million Forecast, by Region 2020 & 2033
- Table 5: Global Electrolyte Mixes Market Revenue Million Forecast, by Product Type 2020 & 2033
- Table 6: Global Electrolyte Mixes Market Revenue Million Forecast, by Flavor 2020 & 2033
- Table 7: Global Electrolyte Mixes Market Revenue Million Forecast, by Distribution Channel 2020 & 2033
- Table 8: Global Electrolyte Mixes Market Revenue Million Forecast, by Country 2020 & 2033
- Table 9: United States Electrolyte Mixes Market Revenue (Million) Forecast, by Application 2020 & 2033
- Table 10: Canada Electrolyte Mixes Market Revenue (Million) Forecast, by Application 2020 & 2033
- Table 11: Mexico Electrolyte Mixes Market Revenue (Million) Forecast, by Application 2020 & 2033
- Table 12: Rest of North America Electrolyte Mixes Market Revenue (Million) Forecast, by Application 2020 & 2033
- Table 13: Global Electrolyte Mixes Market Revenue Million Forecast, by Product Type 2020 & 2033
- Table 14: Global Electrolyte Mixes Market Revenue Million Forecast, by Flavor 2020 & 2033
- Table 15: Global Electrolyte Mixes Market Revenue Million Forecast, by Distribution Channel 2020 & 2033
- Table 16: Global Electrolyte Mixes Market Revenue Million Forecast, by Country 2020 & 2033
- Table 17: United Kingdom Electrolyte Mixes Market Revenue (Million) Forecast, by Application 2020 & 2033
- Table 18: Germany Electrolyte Mixes Market Revenue (Million) Forecast, by Application 2020 & 2033
- Table 19: France Electrolyte Mixes Market Revenue (Million) Forecast, by Application 2020 & 2033
- Table 20: Russia Electrolyte Mixes Market Revenue (Million) Forecast, by Application 2020 & 2033
- Table 21: Italy Electrolyte Mixes Market Revenue (Million) Forecast, by Application 2020 & 2033
- Table 22: Spain Electrolyte Mixes Market Revenue (Million) Forecast, by Application 2020 & 2033
- Table 23: Rest of Europe Electrolyte Mixes Market Revenue (Million) Forecast, by Application 2020 & 2033
- Table 24: Global Electrolyte Mixes Market Revenue Million Forecast, by Product Type 2020 & 2033
- Table 25: Global Electrolyte Mixes Market Revenue Million Forecast, by Flavor 2020 & 2033
- Table 26: Global Electrolyte Mixes Market Revenue Million Forecast, by Distribution Channel 2020 & 2033
- Table 27: Global Electrolyte Mixes Market Revenue Million Forecast, by Country 2020 & 2033
- Table 28: China Electrolyte Mixes Market Revenue (Million) Forecast, by Application 2020 & 2033
- Table 29: India Electrolyte Mixes Market Revenue (Million) Forecast, by Application 2020 & 2033
- Table 30: Japan Electrolyte Mixes Market Revenue (Million) Forecast, by Application 2020 & 2033
- Table 31: Australia Electrolyte Mixes Market Revenue (Million) Forecast, by Application 2020 & 2033
- Table 32: Rest of Asia Pacific Electrolyte Mixes Market Revenue (Million) Forecast, by Application 2020 & 2033
- Table 33: Global Electrolyte Mixes Market Revenue Million Forecast, by Product Type 2020 & 2033
- Table 34: Global Electrolyte Mixes Market Revenue Million Forecast, by Flavor 2020 & 2033
- Table 35: Global Electrolyte Mixes Market Revenue Million Forecast, by Distribution Channel 2020 & 2033
- Table 36: Global Electrolyte Mixes Market Revenue Million Forecast, by Country 2020 & 2033
- Table 37: Brazil Electrolyte Mixes Market Revenue (Million) Forecast, by Application 2020 & 2033
- Table 38: Argentina Electrolyte Mixes Market Revenue (Million) Forecast, by Application 2020 & 2033
- Table 39: Rest of South America Electrolyte Mixes Market Revenue (Million) Forecast, by Application 2020 & 2033
- Table 40: Global Electrolyte Mixes Market Revenue Million Forecast, by Product Type 2020 & 2033
- Table 41: Global Electrolyte Mixes Market Revenue Million Forecast, by Flavor 2020 & 2033
- Table 42: Global Electrolyte Mixes Market Revenue Million Forecast, by Distribution Channel 2020 & 2033
- Table 43: Global Electrolyte Mixes Market Revenue Million Forecast, by Country 2020 & 2033
- Table 44: South Africa Electrolyte Mixes Market Revenue (Million) Forecast, by Application 2020 & 2033
- Table 45: United Arab Emirates Electrolyte Mixes Market Revenue (Million) Forecast, by Application 2020 & 2033
- Table 46: Rest of Middle East and Africa Electrolyte Mixes Market Revenue (Million) Forecast, by Application 2020 & 2033
Frequently Asked Questions
1. What is the projected Compound Annual Growth Rate (CAGR) of the Electrolyte Mixes Market?
The projected CAGR is approximately 2.81%.
2. Which companies are prominent players in the Electrolyte Mixes Market?
Key companies in the market include Tailwind Nutrition, Kent Corporation, Nestlé SA, PepsiCo Inc, Unilever PLC, Abbott Laboratories, LyteLine LLC, Otsuka Holdings Co Ltd, Vitalyte Sports Nutrition Inc *List Not Exhaustive, Ultima Health Products Inc.
3. What are the main segments of the Electrolyte Mixes Market?
The market segments include Product Type, Flavor, Distribution Channel.
4. Can you provide details about the market size?
The market size is estimated to be USD 579.65 Million as of 2022.
5. What are some drivers contributing to market growth?
Rising Demand For Ready Meals Food Products to Influence Growth; Increasing Demand for Organic and Vegan Ready-to-Eat food products..
6. What are the notable trends driving market growth?
Surging Interest Among Consumers in Physical Activities. Including Gyms.
7. Are there any restraints impacting market growth?
Rising Concern Over Health Issues Associated with Processed Foods.
8. Can you provide examples of recent developments in the market?
MAY 2022: Liquid IV announced the launch of Hydration Multiplier+ Powdered Probiotic Kombucha, a blendable mixture that contains electrolytes, Liquid IV's BC30 Probiotic, which boasts an impressive 1 billion colony forming units (CFU), and a powdered kombucha. These components together help in boosting gut health.
9. What pricing options are available for accessing the report?
Pricing options include single-user, multi-user, and enterprise licenses priced at USD 4750, USD 5250, and USD 8750 respectively.
10. Is the market size provided in terms of value or volume?
The market size is provided in terms of value, measured in Million.
11. Are there any specific market keywords associated with the report?
Yes, the market keyword associated with the report is "Electrolyte Mixes Market," which aids in identifying and referencing the specific market segment covered.
12. How do I determine which pricing option suits my needs best?
The pricing options vary based on user requirements and access needs. Individual users may opt for single-user licenses, while businesses requiring broader access may choose multi-user or enterprise licenses for cost-effective access to the report.
13. Are there any additional resources or data provided in the Electrolyte Mixes Market report?
While the report offers comprehensive insights, it's advisable to review the specific contents or supplementary materials provided to ascertain if additional resources or data are available.
14. How can I stay updated on further developments or reports in the Electrolyte Mixes Market?
To stay informed about further developments, trends, and reports in the Electrolyte Mixes Market, consider subscribing to industry newsletters, following relevant companies and organizations, or regularly checking reputable industry news sources and publications.
Methodology
Step 1 - Identification of Relevant Samples Size from Population Database


Step 2 - Approaches for Defining Global Market Size (Value, Volume* & Price*)

Note*: In applicable scenarios
Step 3 - Data Sources
Primary Research
- Web Analytics
- Survey Reports
- Research Institute
- Latest Research Reports
- Opinion Leaders
Secondary Research
- Annual Reports
- White Paper
- Latest Press Release
- Industry Association
- Paid Database
- Investor Presentations

Step 4 - Data Triangulation
Involves using different sources of information in order to increase the validity of a study
These sources are likely to be stakeholders in a program - participants, other researchers, program staff, other community members, and so on.
Then we put all data in single framework & apply various statistical tools to find out the dynamic on the market.
During the analysis stage, feedback from the stakeholder groups would be compared to determine areas of agreement as well as areas of divergence