

Key Insights
The Electronic Instrument Panel (EIP) market for passenger cars is experiencing robust growth, driven by increasing demand for advanced driver-assistance systems (ADAS), enhanced user experience, and the rising adoption of electric vehicles (EVs). The integration of EIPs allows for seamless display of crucial vehicle information, including speed, fuel level, engine performance, and navigation data, often through customizable and intuitive interfaces. Furthermore, the shift towards digital cockpits and the incorporation of larger, higher-resolution displays are key market drivers. Competitive pressures among automotive manufacturers to offer innovative features are further fueling the market's expansion. While the initial investment in developing and implementing EIP technology can be substantial, the long-term benefits in terms of improved safety, enhanced driver satisfaction, and brand differentiation are compelling manufacturers to adopt this technology rapidly. The market is segmented by display type (TFT, LCD, OLED), functionality (basic, advanced), and vehicle type (luxury, mid-range, economy), with the advanced segment exhibiting the highest growth.
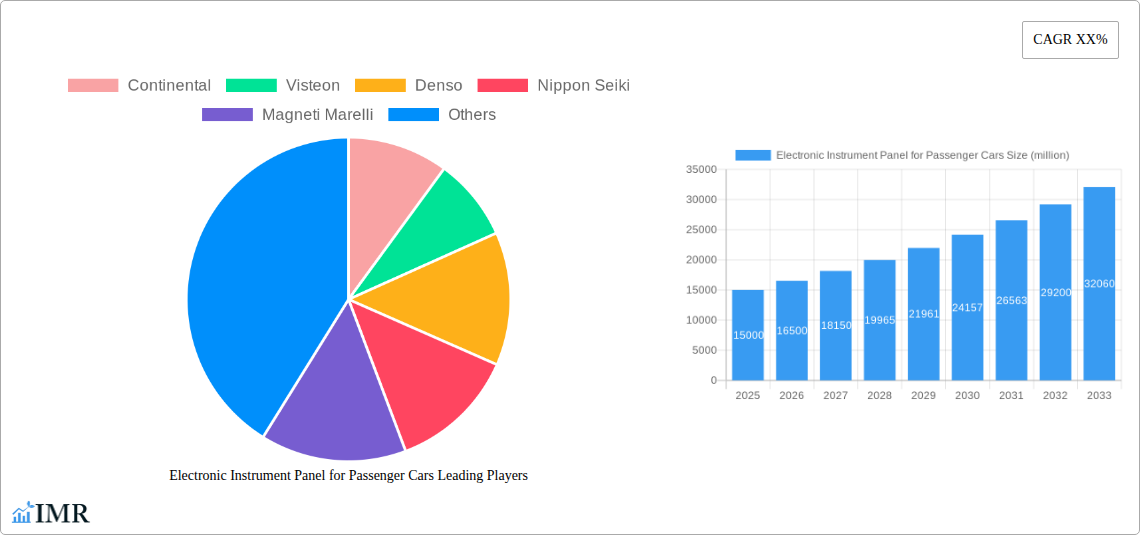
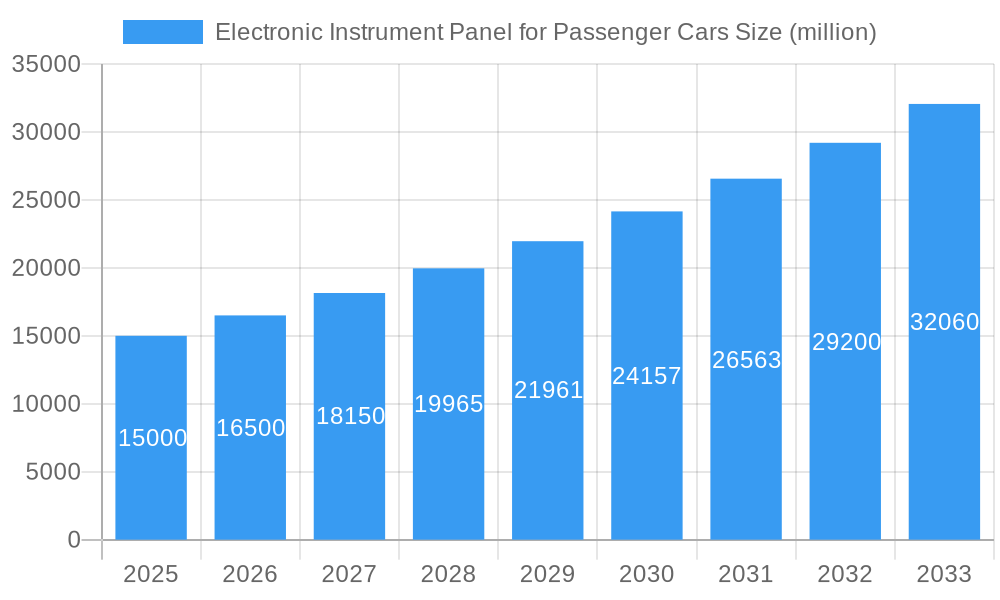
Electronic Instrument Panel for Passenger Cars Market Size (In Billion)
The prominent players in this market include established automotive suppliers like Continental, Visteon, Denso, and Bosch, alongside several rapidly growing Asian companies actively innovating in this space. The market is geographically diverse, with North America and Europe currently leading in adoption, but the Asia-Pacific region is projected to witness significant growth in the coming years, fueled by increasing vehicle production and rising disposable incomes. Challenges include managing the complexity of software integration, ensuring cybersecurity within the EIP systems, and meeting stringent regulatory requirements concerning safety and data privacy. Nevertheless, the overall market outlook remains positive, with continued technological advancements and increasing consumer demand expected to sustain its expansion throughout the forecast period.
Electronic Instrument Panel for Passenger Cars Company Market Share
Electronic Instrument Panel for Passenger Cars Market Report: 2019-2033
This comprehensive report provides an in-depth analysis of the Electronic Instrument Panel (EIP) market for passenger cars, encompassing market dynamics, growth trends, regional analysis, competitive landscape, and future outlook. The study period covers 2019-2033, with a base year of 2025 and a forecast period of 2025-2033. This report serves as an essential resource for automotive manufacturers, Tier-1 suppliers, technology providers, and investors seeking to navigate this rapidly evolving market. The parent market is the automotive industry, with the child market being automotive electronics.
Electronic Instrument Panel for Passenger Cars Market Dynamics & Structure
This section analyzes the market's competitive structure, technological advancements, regulatory influences, and market trends impacting the growth of electronic instrument panels in passenger cars. The global market size in 2025 is estimated at xx million units.
- Market Concentration: The market is moderately concentrated, with key players holding significant shares. The top five players (Continental, Visteon, Denso, Nippon Seiki, and Bosch) collectively account for an estimated xx% of the global market share in 2025.
- Technological Innovation: Advancements in display technology (e.g., OLED, AMOLED), increased processing power, and integration of advanced driver-assistance systems (ADAS) are key drivers. However, high R&D costs and integration complexities pose significant innovation barriers.
- Regulatory Framework: Stringent safety and emissions regulations are pushing the adoption of EIPs with enhanced features and functionalities. Government incentives for fuel efficiency and advanced safety technologies further accelerate market growth.
- Competitive Product Substitutes: While traditional mechanical instrument clusters still exist, their market share is declining rapidly due to the superior functionalities and aesthetics offered by EIPs.
- End-User Demographics: The rising demand for premium vehicles equipped with advanced features and the increasing adoption of connected cars contribute to market expansion. Consumer preference for personalized and interactive dashboards is a crucial factor.
- M&A Trends: Consolidation among key players is expected to continue, with a predicted xx number of M&A deals in the forecast period. These mergers and acquisitions aim to enhance technological capabilities, expand geographic reach, and secure a larger market share.
Electronic Instrument Panel for Passenger Cars Growth Trends & Insights
The global EIP market for passenger cars is experiencing significant growth, driven by technological advancements and increasing demand for enhanced in-vehicle infotainment and safety features. The market is projected to exhibit a Compound Annual Growth Rate (CAGR) of xx% during the forecast period (2025-2033), reaching an estimated xx million units by 2033. This growth is attributed to several key factors, including the rising adoption of advanced driver-assistance systems (ADAS), the growing popularity of connected cars, and the increasing demand for sophisticated and customizable instrument clusters. The market penetration rate is projected to increase from xx% in 2025 to xx% by 2033. Technological disruptions, such as the introduction of augmented reality (AR) head-up displays and the integration of artificial intelligence (AI) for personalized driver experiences, are further accelerating market expansion. Consumer behavior shifts, including a growing preference for digital dashboards and a demand for intuitive user interfaces, are also significant growth drivers.
Dominant Regions, Countries, or Segments in Electronic Instrument Panel for Passenger Cars
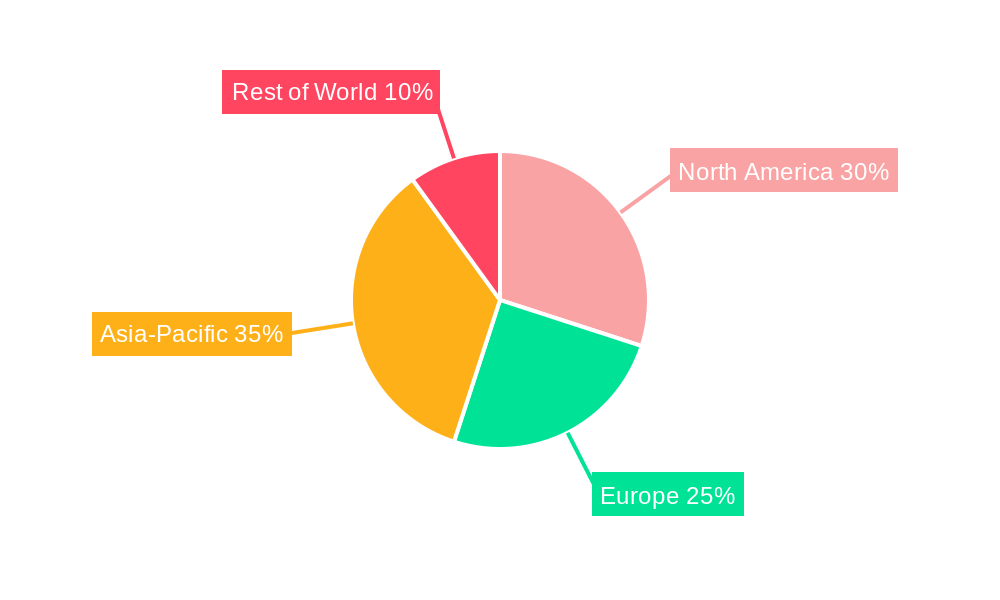
The Asia-Pacific region is expected to dominate the global electronic instrument panel market for passenger cars throughout the forecast period. This dominance is primarily driven by the burgeoning automotive industry in countries like China, India, and Japan, along with increasing production of passenger vehicles.
- Key Drivers:
- Rapid economic growth and rising disposable incomes in emerging economies.
- Increasing government support for the automotive industry.
- Growing demand for technologically advanced vehicles.
- Expansion of automotive manufacturing facilities.
- Dominance Factors: High vehicle production volumes, cost-effective manufacturing capabilities, and a large consumer base in the Asia-Pacific region contribute significantly to its market share. The region's growth potential remains substantial, fueled by further economic expansion and increasing vehicle ownership.
Electronic Instrument Panel for Passenger Cars Product Landscape
Electronic instrument panels are evolving from simple displays of speed and fuel levels to sophisticated, integrated systems showcasing navigation, entertainment, and advanced driver-assistance features. Current product innovations emphasize high-resolution displays, intuitive user interfaces, customizable layouts, and seamless integration with smartphones and other connected devices. The performance metrics of EIPs are increasingly focused on faster processing speeds, enhanced graphics capabilities, and improved energy efficiency. Unique selling propositions include augmented reality overlays, haptic feedback, and voice control functionalities, creating personalized driving experiences.
Key Drivers, Barriers & Challenges in Electronic Instrument Panel for Passenger Cars
Key Drivers: The increasing demand for enhanced safety features (ADAS integration), improved driver experience (personalized infotainment), fuel efficiency regulations (supporting eco-friendly technologies), and the proliferation of connected cars are key drivers pushing market growth.
Key Challenges: The high initial investment costs for developing advanced EIPs, complex supply chain management, stringent safety and regulatory compliance requirements, and intense competition among established and emerging players pose significant challenges to market growth. Supply chain disruptions can lead to production delays and increased costs, impacting overall market dynamics. Intense competition from established and emerging players is also a significant factor.
Emerging Opportunities in Electronic Instrument Panel for Passenger Cars
Emerging opportunities lie in the integration of AI for personalized driver experiences, the expansion into the commercial vehicle segment, and the development of advanced head-up display (HUD) systems. Untapped markets in developing countries, particularly in Africa and South America, offer significant potential. Growing consumer demand for sustainable and eco-friendly transportation solutions creates opportunities for EIPs featuring energy-efficient components.
Growth Accelerators in the Electronic Instrument Panel for Passenger Cars Industry
Technological breakthroughs in display technology, such as microLED and holographic displays, will significantly enhance the user experience and drive market growth. Strategic partnerships between automotive manufacturers and technology providers will accelerate innovation and market penetration. Expansion into new geographical markets, especially in developing economies, will fuel long-term growth.
Key Players Shaping the Electronic Instrument Panel for Passenger Cars Market
- Continental
- Visteon
- Denso
- Nippon Seiki
- Magneti Marelli
- Yazaki
- Delphi
- Bosch
- Calsonic Kansei
- Marelli Europe S.p.A.
- Aptiv
- Hyundai Mobis
- Huizhou Desay SV Automotive
- Zhejiang Automobile Instrument
- Jiangsu Xingtongda Electronics Technology
- Ningbo Vikeer Electronics
- DongFeng Electronic Technology
- Shanghai Youzhong Technology
- ShanXi HuaYang Group NewEnergy
- Wuhan Bluestar Technology Co.,Ltd.
- Zhejiang Zhongke Linghang Automotive Electronics
- Chengdu Tianxing Instrument And Meter
- TOPCON TECHNOHOUSE CORPORATION
Notable Milestones in Electronic Instrument Panel for Passenger Cars Sector
- 2020: Introduction of several EIPs with advanced driver-assistance features and enhanced connectivity.
- 2021: Significant increase in the adoption of OLED and AMOLED displays in premium vehicles.
- 2022: Several key mergers and acquisitions aimed at expanding product portfolios and market share.
- 2023: Launch of multiple EIPs integrating augmented reality (AR) and artificial intelligence (AI) technologies.
In-Depth Electronic Instrument Panel for Passenger Cars Market Outlook
The future of the electronic instrument panel market is bright, with continued growth driven by technological advancements, increasing demand for advanced features, and expansion into new markets. Strategic partnerships and investments in R&D will play a crucial role in shaping the market landscape. The focus will shift towards enhanced user experience, integration of AI and machine learning, and improved safety features, promising a dynamic and innovative market outlook for the next decade.
Electronic Instrument Panel for Passenger Cars Segmentation
-
1. Type
- 1.1. Below 7 Inches
- 1.2. 7-12 Inches
- 1.3. Aabove 12 Inches
-
2. Application
- 2.1. Sedan
- 2.2. SUV
- 2.3. Other
Electronic Instrument Panel for Passenger Cars Segmentation By Geography
-
1. North America
- 1.1. United States
- 1.2. Canada
- 1.3. Mexico
-
2. South America
- 2.1. Brazil
- 2.2. Argentina
- 2.3. Rest of South America
-
3. Europe
- 3.1. United Kingdom
- 3.2. Germany
- 3.3. France
- 3.4. Italy
- 3.5. Spain
- 3.6. Russia
- 3.7. Benelux
- 3.8. Nordics
- 3.9. Rest of Europe
-
4. Middle East & Africa
- 4.1. Turkey
- 4.2. Israel
- 4.3. GCC
- 4.4. North Africa
- 4.5. South Africa
- 4.6. Rest of Middle East & Africa
-
5. Asia Pacific
- 5.1. China
- 5.2. India
- 5.3. Japan
- 5.4. South Korea
- 5.5. ASEAN
- 5.6. Oceania
- 5.7. Rest of Asia Pacific
Electronic Instrument Panel for Passenger Cars Regional Market Share
Geographic Coverage of Electronic Instrument Panel for Passenger Cars
Electronic Instrument Panel for Passenger Cars REPORT HIGHLIGHTS
| Aspects | Details |
|---|---|
| Study Period | 2020-2034 |
| Base Year | 2025 |
| Estimated Year | 2026 |
| Forecast Period | 2026-2034 |
| Historical Period | 2020-2025 |
| Growth Rate | CAGR of 5.2% from 2020-2034 |
| Segmentation |
|
Table of Contents
- 1. Introduction
- 1.1. Research Scope
- 1.2. Market Segmentation
- 1.3. Research Objective
- 1.4. Definitions and Assumptions
- 2. Executive Summary
- 2.1. Market Snapshot
- 3. Market Dynamics
- 3.1. Market Drivers
- 3.2. Market Restrains
- 3.3. Market Trends
- 3.4. Market Opportunities
- 4. Market Factor Analysis
- 4.1. Porters Five Forces
- 4.1.1. Bargaining Power of Suppliers
- 4.1.2. Bargaining Power of Buyers
- 4.1.3. Threat of New Entrants
- 4.1.4. Threat of Substitutes
- 4.1.5. Competitive Rivalry
- 4.2. PESTEL analysis
- 4.3. BCG Analysis
- 4.3.1. Stars (High Growth, High Market Share)
- 4.3.2. Cash Cows (Low Growth, High Market Share)
- 4.3.3. Question Mark (High Growth, Low Market Share)
- 4.3.4. Dogs (Low Growth, Low Market Share)
- 4.4. Ansoff Matrix Analysis
- 4.5. Supply Chain Analysis
- 4.6. Regulatory Landscape
- 4.7. Current Market Potential and Opportunity Assessment (TAM–SAM–SOM Framework)
- 4.8. IMR Analyst Note
- 4.1. Porters Five Forces
- 5. Market Analysis, Insights and Forecast 2021-2033
- 5.1. Market Analysis, Insights and Forecast - by Type
- 5.1.1. Below 7 Inches
- 5.1.2. 7-12 Inches
- 5.1.3. Aabove 12 Inches
- 5.2. Market Analysis, Insights and Forecast - by Application
- 5.2.1. Sedan
- 5.2.2. SUV
- 5.2.3. Other
- 5.3. Market Analysis, Insights and Forecast - by Region
- 5.3.1. North America
- 5.3.2. South America
- 5.3.3. Europe
- 5.3.4. Middle East & Africa
- 5.3.5. Asia Pacific
- 5.1. Market Analysis, Insights and Forecast - by Type
- 6. Global Electronic Instrument Panel for Passenger Cars Analysis, Insights and Forecast, 2021-2033
- 6.1. Market Analysis, Insights and Forecast - by Type
- 6.1.1. Below 7 Inches
- 6.1.2. 7-12 Inches
- 6.1.3. Aabove 12 Inches
- 6.2. Market Analysis, Insights and Forecast - by Application
- 6.2.1. Sedan
- 6.2.2. SUV
- 6.2.3. Other
- 6.1. Market Analysis, Insights and Forecast - by Type
- 7. North America Electronic Instrument Panel for Passenger Cars Analysis, Insights and Forecast, 2020-2032
- 7.1. Market Analysis, Insights and Forecast - by Type
- 7.1.1. Below 7 Inches
- 7.1.2. 7-12 Inches
- 7.1.3. Aabove 12 Inches
- 7.2. Market Analysis, Insights and Forecast - by Application
- 7.2.1. Sedan
- 7.2.2. SUV
- 7.2.3. Other
- 7.1. Market Analysis, Insights and Forecast - by Type
- 8. South America Electronic Instrument Panel for Passenger Cars Analysis, Insights and Forecast, 2020-2032
- 8.1. Market Analysis, Insights and Forecast - by Type
- 8.1.1. Below 7 Inches
- 8.1.2. 7-12 Inches
- 8.1.3. Aabove 12 Inches
- 8.2. Market Analysis, Insights and Forecast - by Application
- 8.2.1. Sedan
- 8.2.2. SUV
- 8.2.3. Other
- 8.1. Market Analysis, Insights and Forecast - by Type
- 9. Europe Electronic Instrument Panel for Passenger Cars Analysis, Insights and Forecast, 2020-2032
- 9.1. Market Analysis, Insights and Forecast - by Type
- 9.1.1. Below 7 Inches
- 9.1.2. 7-12 Inches
- 9.1.3. Aabove 12 Inches
- 9.2. Market Analysis, Insights and Forecast - by Application
- 9.2.1. Sedan
- 9.2.2. SUV
- 9.2.3. Other
- 9.1. Market Analysis, Insights and Forecast - by Type
- 10. Middle East & Africa Electronic Instrument Panel for Passenger Cars Analysis, Insights and Forecast, 2020-2032
- 10.1. Market Analysis, Insights and Forecast - by Type
- 10.1.1. Below 7 Inches
- 10.1.2. 7-12 Inches
- 10.1.3. Aabove 12 Inches
- 10.2. Market Analysis, Insights and Forecast - by Application
- 10.2.1. Sedan
- 10.2.2. SUV
- 10.2.3. Other
- 10.1. Market Analysis, Insights and Forecast - by Type
- 11. Asia Pacific Electronic Instrument Panel for Passenger Cars Analysis, Insights and Forecast, 2020-2032
- 11.1. Market Analysis, Insights and Forecast - by Type
- 11.1.1. Below 7 Inches
- 11.1.2. 7-12 Inches
- 11.1.3. Aabove 12 Inches
- 11.2. Market Analysis, Insights and Forecast - by Application
- 11.2.1. Sedan
- 11.2.2. SUV
- 11.2.3. Other
- 11.1. Market Analysis, Insights and Forecast - by Type
- 12. Competitive Analysis
- 12.1. Company Profiles
- 12.1.1 Continental
- 12.1.1.1. Company Overview
- 12.1.1.2. Products
- 12.1.1.3. Company Financials
- 12.1.1.4. SWOT Analysis
- 12.1.2 Visteon
- 12.1.2.1. Company Overview
- 12.1.2.2. Products
- 12.1.2.3. Company Financials
- 12.1.2.4. SWOT Analysis
- 12.1.3 Denso
- 12.1.3.1. Company Overview
- 12.1.3.2. Products
- 12.1.3.3. Company Financials
- 12.1.3.4. SWOT Analysis
- 12.1.4 Nippon Seiki
- 12.1.4.1. Company Overview
- 12.1.4.2. Products
- 12.1.4.3. Company Financials
- 12.1.4.4. SWOT Analysis
- 12.1.5 Magneti Marelli
- 12.1.5.1. Company Overview
- 12.1.5.2. Products
- 12.1.5.3. Company Financials
- 12.1.5.4. SWOT Analysis
- 12.1.6 Yazaki
- 12.1.6.1. Company Overview
- 12.1.6.2. Products
- 12.1.6.3. Company Financials
- 12.1.6.4. SWOT Analysis
- 12.1.7 Delphi
- 12.1.7.1. Company Overview
- 12.1.7.2. Products
- 12.1.7.3. Company Financials
- 12.1.7.4. SWOT Analysis
- 12.1.8 Bosch
- 12.1.8.1. Company Overview
- 12.1.8.2. Products
- 12.1.8.3. Company Financials
- 12.1.8.4. SWOT Analysis
- 12.1.9 Calsonic Kansei
- 12.1.9.1. Company Overview
- 12.1.9.2. Products
- 12.1.9.3. Company Financials
- 12.1.9.4. SWOT Analysis
- 12.1.10 Marelli Europe S.p.A.
- 12.1.10.1. Company Overview
- 12.1.10.2. Products
- 12.1.10.3. Company Financials
- 12.1.10.4. SWOT Analysis
- 12.1.11 Aptiv
- 12.1.11.1. Company Overview
- 12.1.11.2. Products
- 12.1.11.3. Company Financials
- 12.1.11.4. SWOT Analysis
- 12.1.12 Hyundai Mobis
- 12.1.12.1. Company Overview
- 12.1.12.2. Products
- 12.1.12.3. Company Financials
- 12.1.12.4. SWOT Analysis
- 12.1.13 Huizhou Desay SV Automotive
- 12.1.13.1. Company Overview
- 12.1.13.2. Products
- 12.1.13.3. Company Financials
- 12.1.13.4. SWOT Analysis
- 12.1.14 Zhejiang Automobile Instrument
- 12.1.14.1. Company Overview
- 12.1.14.2. Products
- 12.1.14.3. Company Financials
- 12.1.14.4. SWOT Analysis
- 12.1.15 Jiangsu Xingtongda Electronics Technology
- 12.1.15.1. Company Overview
- 12.1.15.2. Products
- 12.1.15.3. Company Financials
- 12.1.15.4. SWOT Analysis
- 12.1.16 Ningbo Vikeer Electronics
- 12.1.16.1. Company Overview
- 12.1.16.2. Products
- 12.1.16.3. Company Financials
- 12.1.16.4. SWOT Analysis
- 12.1.17 DongFeng Electronic Technology
- 12.1.17.1. Company Overview
- 12.1.17.2. Products
- 12.1.17.3. Company Financials
- 12.1.17.4. SWOT Analysis
- 12.1.18 Shanghai Youzhong Technology
- 12.1.18.1. Company Overview
- 12.1.18.2. Products
- 12.1.18.3. Company Financials
- 12.1.18.4. SWOT Analysis
- 12.1.19 ShanXi HuaYang Group NewEnergy
- 12.1.19.1. Company Overview
- 12.1.19.2. Products
- 12.1.19.3. Company Financials
- 12.1.19.4. SWOT Analysis
- 12.1.20 Wuhan Bluestar Technology Co.
- 12.1.20.1. Company Overview
- 12.1.20.2. Products
- 12.1.20.3. Company Financials
- 12.1.20.4. SWOT Analysis
- 12.1.21 Ltd.
- 12.1.21.1. Company Overview
- 12.1.21.2. Products
- 12.1.21.3. Company Financials
- 12.1.21.4. SWOT Analysis
- 12.1.22 Zhejiang Zhongke Linghang Automotive Electronics
- 12.1.22.1. Company Overview
- 12.1.22.2. Products
- 12.1.22.3. Company Financials
- 12.1.22.4. SWOT Analysis
- 12.1.23 Chengdu Tianxing Instrument And Meter
- 12.1.23.1. Company Overview
- 12.1.23.2. Products
- 12.1.23.3. Company Financials
- 12.1.23.4. SWOT Analysis
- 12.1.24 TOPCON TECHNOHOUSE CORPORATION
- 12.1.24.1. Company Overview
- 12.1.24.2. Products
- 12.1.24.3. Company Financials
- 12.1.24.4. SWOT Analysis
- 12.1.1 Continental
- 12.2. Market Entropy
- 12.2.1 Company's Key Areas Served
- 12.2.2 Recent Developments
- 12.3. Company Market Share Analysis 2025
- 12.3.1 Top 5 Companies Market Share Analysis
- 12.3.2 Top 3 Companies Market Share Analysis
- 12.4. List of Potential Customers
- 13. Research Methodology
List of Figures
- Figure 1: Global Electronic Instrument Panel for Passenger Cars Revenue Breakdown (undefined, %) by Region 2025 & 2033
- Figure 2: Global Electronic Instrument Panel for Passenger Cars Volume Breakdown (K, %) by Region 2025 & 2033
- Figure 3: North America Electronic Instrument Panel for Passenger Cars Revenue (undefined), by Type 2025 & 2033
- Figure 4: North America Electronic Instrument Panel for Passenger Cars Volume (K), by Type 2025 & 2033
- Figure 5: North America Electronic Instrument Panel for Passenger Cars Revenue Share (%), by Type 2025 & 2033
- Figure 6: North America Electronic Instrument Panel for Passenger Cars Volume Share (%), by Type 2025 & 2033
- Figure 7: North America Electronic Instrument Panel for Passenger Cars Revenue (undefined), by Application 2025 & 2033
- Figure 8: North America Electronic Instrument Panel for Passenger Cars Volume (K), by Application 2025 & 2033
- Figure 9: North America Electronic Instrument Panel for Passenger Cars Revenue Share (%), by Application 2025 & 2033
- Figure 10: North America Electronic Instrument Panel for Passenger Cars Volume Share (%), by Application 2025 & 2033
- Figure 11: North America Electronic Instrument Panel for Passenger Cars Revenue (undefined), by Country 2025 & 2033
- Figure 12: North America Electronic Instrument Panel for Passenger Cars Volume (K), by Country 2025 & 2033
- Figure 13: North America Electronic Instrument Panel for Passenger Cars Revenue Share (%), by Country 2025 & 2033
- Figure 14: North America Electronic Instrument Panel for Passenger Cars Volume Share (%), by Country 2025 & 2033
- Figure 15: South America Electronic Instrument Panel for Passenger Cars Revenue (undefined), by Type 2025 & 2033
- Figure 16: South America Electronic Instrument Panel for Passenger Cars Volume (K), by Type 2025 & 2033
- Figure 17: South America Electronic Instrument Panel for Passenger Cars Revenue Share (%), by Type 2025 & 2033
- Figure 18: South America Electronic Instrument Panel for Passenger Cars Volume Share (%), by Type 2025 & 2033
- Figure 19: South America Electronic Instrument Panel for Passenger Cars Revenue (undefined), by Application 2025 & 2033
- Figure 20: South America Electronic Instrument Panel for Passenger Cars Volume (K), by Application 2025 & 2033
- Figure 21: South America Electronic Instrument Panel for Passenger Cars Revenue Share (%), by Application 2025 & 2033
- Figure 22: South America Electronic Instrument Panel for Passenger Cars Volume Share (%), by Application 2025 & 2033
- Figure 23: South America Electronic Instrument Panel for Passenger Cars Revenue (undefined), by Country 2025 & 2033
- Figure 24: South America Electronic Instrument Panel for Passenger Cars Volume (K), by Country 2025 & 2033
- Figure 25: South America Electronic Instrument Panel for Passenger Cars Revenue Share (%), by Country 2025 & 2033
- Figure 26: South America Electronic Instrument Panel for Passenger Cars Volume Share (%), by Country 2025 & 2033
- Figure 27: Europe Electronic Instrument Panel for Passenger Cars Revenue (undefined), by Type 2025 & 2033
- Figure 28: Europe Electronic Instrument Panel for Passenger Cars Volume (K), by Type 2025 & 2033
- Figure 29: Europe Electronic Instrument Panel for Passenger Cars Revenue Share (%), by Type 2025 & 2033
- Figure 30: Europe Electronic Instrument Panel for Passenger Cars Volume Share (%), by Type 2025 & 2033
- Figure 31: Europe Electronic Instrument Panel for Passenger Cars Revenue (undefined), by Application 2025 & 2033
- Figure 32: Europe Electronic Instrument Panel for Passenger Cars Volume (K), by Application 2025 & 2033
- Figure 33: Europe Electronic Instrument Panel for Passenger Cars Revenue Share (%), by Application 2025 & 2033
- Figure 34: Europe Electronic Instrument Panel for Passenger Cars Volume Share (%), by Application 2025 & 2033
- Figure 35: Europe Electronic Instrument Panel for Passenger Cars Revenue (undefined), by Country 2025 & 2033
- Figure 36: Europe Electronic Instrument Panel for Passenger Cars Volume (K), by Country 2025 & 2033
- Figure 37: Europe Electronic Instrument Panel for Passenger Cars Revenue Share (%), by Country 2025 & 2033
- Figure 38: Europe Electronic Instrument Panel for Passenger Cars Volume Share (%), by Country 2025 & 2033
- Figure 39: Middle East & Africa Electronic Instrument Panel for Passenger Cars Revenue (undefined), by Type 2025 & 2033
- Figure 40: Middle East & Africa Electronic Instrument Panel for Passenger Cars Volume (K), by Type 2025 & 2033
- Figure 41: Middle East & Africa Electronic Instrument Panel for Passenger Cars Revenue Share (%), by Type 2025 & 2033
- Figure 42: Middle East & Africa Electronic Instrument Panel for Passenger Cars Volume Share (%), by Type 2025 & 2033
- Figure 43: Middle East & Africa Electronic Instrument Panel for Passenger Cars Revenue (undefined), by Application 2025 & 2033
- Figure 44: Middle East & Africa Electronic Instrument Panel for Passenger Cars Volume (K), by Application 2025 & 2033
- Figure 45: Middle East & Africa Electronic Instrument Panel for Passenger Cars Revenue Share (%), by Application 2025 & 2033
- Figure 46: Middle East & Africa Electronic Instrument Panel for Passenger Cars Volume Share (%), by Application 2025 & 2033
- Figure 47: Middle East & Africa Electronic Instrument Panel for Passenger Cars Revenue (undefined), by Country 2025 & 2033
- Figure 48: Middle East & Africa Electronic Instrument Panel for Passenger Cars Volume (K), by Country 2025 & 2033
- Figure 49: Middle East & Africa Electronic Instrument Panel for Passenger Cars Revenue Share (%), by Country 2025 & 2033
- Figure 50: Middle East & Africa Electronic Instrument Panel for Passenger Cars Volume Share (%), by Country 2025 & 2033
- Figure 51: Asia Pacific Electronic Instrument Panel for Passenger Cars Revenue (undefined), by Type 2025 & 2033
- Figure 52: Asia Pacific Electronic Instrument Panel for Passenger Cars Volume (K), by Type 2025 & 2033
- Figure 53: Asia Pacific Electronic Instrument Panel for Passenger Cars Revenue Share (%), by Type 2025 & 2033
- Figure 54: Asia Pacific Electronic Instrument Panel for Passenger Cars Volume Share (%), by Type 2025 & 2033
- Figure 55: Asia Pacific Electronic Instrument Panel for Passenger Cars Revenue (undefined), by Application 2025 & 2033
- Figure 56: Asia Pacific Electronic Instrument Panel for Passenger Cars Volume (K), by Application 2025 & 2033
- Figure 57: Asia Pacific Electronic Instrument Panel for Passenger Cars Revenue Share (%), by Application 2025 & 2033
- Figure 58: Asia Pacific Electronic Instrument Panel for Passenger Cars Volume Share (%), by Application 2025 & 2033
- Figure 59: Asia Pacific Electronic Instrument Panel for Passenger Cars Revenue (undefined), by Country 2025 & 2033
- Figure 60: Asia Pacific Electronic Instrument Panel for Passenger Cars Volume (K), by Country 2025 & 2033
- Figure 61: Asia Pacific Electronic Instrument Panel for Passenger Cars Revenue Share (%), by Country 2025 & 2033
- Figure 62: Asia Pacific Electronic Instrument Panel for Passenger Cars Volume Share (%), by Country 2025 & 2033
List of Tables
- Table 1: Global Electronic Instrument Panel for Passenger Cars Revenue undefined Forecast, by Type 2020 & 2033
- Table 2: Global Electronic Instrument Panel for Passenger Cars Volume K Forecast, by Type 2020 & 2033
- Table 3: Global Electronic Instrument Panel for Passenger Cars Revenue undefined Forecast, by Application 2020 & 2033
- Table 4: Global Electronic Instrument Panel for Passenger Cars Volume K Forecast, by Application 2020 & 2033
- Table 5: Global Electronic Instrument Panel for Passenger Cars Revenue undefined Forecast, by Region 2020 & 2033
- Table 6: Global Electronic Instrument Panel for Passenger Cars Volume K Forecast, by Region 2020 & 2033
- Table 7: Global Electronic Instrument Panel for Passenger Cars Revenue undefined Forecast, by Type 2020 & 2033
- Table 8: Global Electronic Instrument Panel for Passenger Cars Volume K Forecast, by Type 2020 & 2033
- Table 9: Global Electronic Instrument Panel for Passenger Cars Revenue undefined Forecast, by Application 2020 & 2033
- Table 10: Global Electronic Instrument Panel for Passenger Cars Volume K Forecast, by Application 2020 & 2033
- Table 11: Global Electronic Instrument Panel for Passenger Cars Revenue undefined Forecast, by Country 2020 & 2033
- Table 12: Global Electronic Instrument Panel for Passenger Cars Volume K Forecast, by Country 2020 & 2033
- Table 13: United States Electronic Instrument Panel for Passenger Cars Revenue (undefined) Forecast, by Application 2020 & 2033
- Table 14: United States Electronic Instrument Panel for Passenger Cars Volume (K) Forecast, by Application 2020 & 2033
- Table 15: Canada Electronic Instrument Panel for Passenger Cars Revenue (undefined) Forecast, by Application 2020 & 2033
- Table 16: Canada Electronic Instrument Panel for Passenger Cars Volume (K) Forecast, by Application 2020 & 2033
- Table 17: Mexico Electronic Instrument Panel for Passenger Cars Revenue (undefined) Forecast, by Application 2020 & 2033
- Table 18: Mexico Electronic Instrument Panel for Passenger Cars Volume (K) Forecast, by Application 2020 & 2033
- Table 19: Global Electronic Instrument Panel for Passenger Cars Revenue undefined Forecast, by Type 2020 & 2033
- Table 20: Global Electronic Instrument Panel for Passenger Cars Volume K Forecast, by Type 2020 & 2033
- Table 21: Global Electronic Instrument Panel for Passenger Cars Revenue undefined Forecast, by Application 2020 & 2033
- Table 22: Global Electronic Instrument Panel for Passenger Cars Volume K Forecast, by Application 2020 & 2033
- Table 23: Global Electronic Instrument Panel for Passenger Cars Revenue undefined Forecast, by Country 2020 & 2033
- Table 24: Global Electronic Instrument Panel for Passenger Cars Volume K Forecast, by Country 2020 & 2033
- Table 25: Brazil Electronic Instrument Panel for Passenger Cars Revenue (undefined) Forecast, by Application 2020 & 2033
- Table 26: Brazil Electronic Instrument Panel for Passenger Cars Volume (K) Forecast, by Application 2020 & 2033
- Table 27: Argentina Electronic Instrument Panel for Passenger Cars Revenue (undefined) Forecast, by Application 2020 & 2033
- Table 28: Argentina Electronic Instrument Panel for Passenger Cars Volume (K) Forecast, by Application 2020 & 2033
- Table 29: Rest of South America Electronic Instrument Panel for Passenger Cars Revenue (undefined) Forecast, by Application 2020 & 2033
- Table 30: Rest of South America Electronic Instrument Panel for Passenger Cars Volume (K) Forecast, by Application 2020 & 2033
- Table 31: Global Electronic Instrument Panel for Passenger Cars Revenue undefined Forecast, by Type 2020 & 2033
- Table 32: Global Electronic Instrument Panel for Passenger Cars Volume K Forecast, by Type 2020 & 2033
- Table 33: Global Electronic Instrument Panel for Passenger Cars Revenue undefined Forecast, by Application 2020 & 2033
- Table 34: Global Electronic Instrument Panel for Passenger Cars Volume K Forecast, by Application 2020 & 2033
- Table 35: Global Electronic Instrument Panel for Passenger Cars Revenue undefined Forecast, by Country 2020 & 2033
- Table 36: Global Electronic Instrument Panel for Passenger Cars Volume K Forecast, by Country 2020 & 2033
- Table 37: United Kingdom Electronic Instrument Panel for Passenger Cars Revenue (undefined) Forecast, by Application 2020 & 2033
- Table 38: United Kingdom Electronic Instrument Panel for Passenger Cars Volume (K) Forecast, by Application 2020 & 2033
- Table 39: Germany Electronic Instrument Panel for Passenger Cars Revenue (undefined) Forecast, by Application 2020 & 2033
- Table 40: Germany Electronic Instrument Panel for Passenger Cars Volume (K) Forecast, by Application 2020 & 2033
- Table 41: France Electronic Instrument Panel for Passenger Cars Revenue (undefined) Forecast, by Application 2020 & 2033
- Table 42: France Electronic Instrument Panel for Passenger Cars Volume (K) Forecast, by Application 2020 & 2033
- Table 43: Italy Electronic Instrument Panel for Passenger Cars Revenue (undefined) Forecast, by Application 2020 & 2033
- Table 44: Italy Electronic Instrument Panel for Passenger Cars Volume (K) Forecast, by Application 2020 & 2033
- Table 45: Spain Electronic Instrument Panel for Passenger Cars Revenue (undefined) Forecast, by Application 2020 & 2033
- Table 46: Spain Electronic Instrument Panel for Passenger Cars Volume (K) Forecast, by Application 2020 & 2033
- Table 47: Russia Electronic Instrument Panel for Passenger Cars Revenue (undefined) Forecast, by Application 2020 & 2033
- Table 48: Russia Electronic Instrument Panel for Passenger Cars Volume (K) Forecast, by Application 2020 & 2033
- Table 49: Benelux Electronic Instrument Panel for Passenger Cars Revenue (undefined) Forecast, by Application 2020 & 2033
- Table 50: Benelux Electronic Instrument Panel for Passenger Cars Volume (K) Forecast, by Application 2020 & 2033
- Table 51: Nordics Electronic Instrument Panel for Passenger Cars Revenue (undefined) Forecast, by Application 2020 & 2033
- Table 52: Nordics Electronic Instrument Panel for Passenger Cars Volume (K) Forecast, by Application 2020 & 2033
- Table 53: Rest of Europe Electronic Instrument Panel for Passenger Cars Revenue (undefined) Forecast, by Application 2020 & 2033
- Table 54: Rest of Europe Electronic Instrument Panel for Passenger Cars Volume (K) Forecast, by Application 2020 & 2033
- Table 55: Global Electronic Instrument Panel for Passenger Cars Revenue undefined Forecast, by Type 2020 & 2033
- Table 56: Global Electronic Instrument Panel for Passenger Cars Volume K Forecast, by Type 2020 & 2033
- Table 57: Global Electronic Instrument Panel for Passenger Cars Revenue undefined Forecast, by Application 2020 & 2033
- Table 58: Global Electronic Instrument Panel for Passenger Cars Volume K Forecast, by Application 2020 & 2033
- Table 59: Global Electronic Instrument Panel for Passenger Cars Revenue undefined Forecast, by Country 2020 & 2033
- Table 60: Global Electronic Instrument Panel for Passenger Cars Volume K Forecast, by Country 2020 & 2033
- Table 61: Turkey Electronic Instrument Panel for Passenger Cars Revenue (undefined) Forecast, by Application 2020 & 2033
- Table 62: Turkey Electronic Instrument Panel for Passenger Cars Volume (K) Forecast, by Application 2020 & 2033
- Table 63: Israel Electronic Instrument Panel for Passenger Cars Revenue (undefined) Forecast, by Application 2020 & 2033
- Table 64: Israel Electronic Instrument Panel for Passenger Cars Volume (K) Forecast, by Application 2020 & 2033
- Table 65: GCC Electronic Instrument Panel for Passenger Cars Revenue (undefined) Forecast, by Application 2020 & 2033
- Table 66: GCC Electronic Instrument Panel for Passenger Cars Volume (K) Forecast, by Application 2020 & 2033
- Table 67: North Africa Electronic Instrument Panel for Passenger Cars Revenue (undefined) Forecast, by Application 2020 & 2033
- Table 68: North Africa Electronic Instrument Panel for Passenger Cars Volume (K) Forecast, by Application 2020 & 2033
- Table 69: South Africa Electronic Instrument Panel for Passenger Cars Revenue (undefined) Forecast, by Application 2020 & 2033
- Table 70: South Africa Electronic Instrument Panel for Passenger Cars Volume (K) Forecast, by Application 2020 & 2033
- Table 71: Rest of Middle East & Africa Electronic Instrument Panel for Passenger Cars Revenue (undefined) Forecast, by Application 2020 & 2033
- Table 72: Rest of Middle East & Africa Electronic Instrument Panel for Passenger Cars Volume (K) Forecast, by Application 2020 & 2033
- Table 73: Global Electronic Instrument Panel for Passenger Cars Revenue undefined Forecast, by Type 2020 & 2033
- Table 74: Global Electronic Instrument Panel for Passenger Cars Volume K Forecast, by Type 2020 & 2033
- Table 75: Global Electronic Instrument Panel for Passenger Cars Revenue undefined Forecast, by Application 2020 & 2033
- Table 76: Global Electronic Instrument Panel for Passenger Cars Volume K Forecast, by Application 2020 & 2033
- Table 77: Global Electronic Instrument Panel for Passenger Cars Revenue undefined Forecast, by Country 2020 & 2033
- Table 78: Global Electronic Instrument Panel for Passenger Cars Volume K Forecast, by Country 2020 & 2033
- Table 79: China Electronic Instrument Panel for Passenger Cars Revenue (undefined) Forecast, by Application 2020 & 2033
- Table 80: China Electronic Instrument Panel for Passenger Cars Volume (K) Forecast, by Application 2020 & 2033
- Table 81: India Electronic Instrument Panel for Passenger Cars Revenue (undefined) Forecast, by Application 2020 & 2033
- Table 82: India Electronic Instrument Panel for Passenger Cars Volume (K) Forecast, by Application 2020 & 2033
- Table 83: Japan Electronic Instrument Panel for Passenger Cars Revenue (undefined) Forecast, by Application 2020 & 2033
- Table 84: Japan Electronic Instrument Panel for Passenger Cars Volume (K) Forecast, by Application 2020 & 2033
- Table 85: South Korea Electronic Instrument Panel for Passenger Cars Revenue (undefined) Forecast, by Application 2020 & 2033
- Table 86: South Korea Electronic Instrument Panel for Passenger Cars Volume (K) Forecast, by Application 2020 & 2033
- Table 87: ASEAN Electronic Instrument Panel for Passenger Cars Revenue (undefined) Forecast, by Application 2020 & 2033
- Table 88: ASEAN Electronic Instrument Panel for Passenger Cars Volume (K) Forecast, by Application 2020 & 2033
- Table 89: Oceania Electronic Instrument Panel for Passenger Cars Revenue (undefined) Forecast, by Application 2020 & 2033
- Table 90: Oceania Electronic Instrument Panel for Passenger Cars Volume (K) Forecast, by Application 2020 & 2033
- Table 91: Rest of Asia Pacific Electronic Instrument Panel for Passenger Cars Revenue (undefined) Forecast, by Application 2020 & 2033
- Table 92: Rest of Asia Pacific Electronic Instrument Panel for Passenger Cars Volume (K) Forecast, by Application 2020 & 2033
Frequently Asked Questions
1. What is the projected Compound Annual Growth Rate (CAGR) of the Electronic Instrument Panel for Passenger Cars?
The projected CAGR is approximately 5.2%.
2. Which companies are prominent players in the Electronic Instrument Panel for Passenger Cars?
Key companies in the market include Continental, Visteon, Denso, Nippon Seiki, Magneti Marelli, Yazaki, Delphi, Bosch, Calsonic Kansei, Marelli Europe S.p.A., Aptiv, Hyundai Mobis, Huizhou Desay SV Automotive, Zhejiang Automobile Instrument, Jiangsu Xingtongda Electronics Technology, Ningbo Vikeer Electronics, DongFeng Electronic Technology, Shanghai Youzhong Technology, ShanXi HuaYang Group NewEnergy, Wuhan Bluestar Technology Co., Ltd., Zhejiang Zhongke Linghang Automotive Electronics, Chengdu Tianxing Instrument And Meter, TOPCON TECHNOHOUSE CORPORATION.
3. What are the main segments of the Electronic Instrument Panel for Passenger Cars?
The market segments include Type, Application.
4. Can you provide details about the market size?
The market size is estimated to be USD XXX N/A as of 2022.
5. What are some drivers contributing to market growth?
N/A
6. What are the notable trends driving market growth?
N/A
7. Are there any restraints impacting market growth?
N/A
8. Can you provide examples of recent developments in the market?
N/A
9. What pricing options are available for accessing the report?
Pricing options include single-user, multi-user, and enterprise licenses priced at USD 3350.00, USD 5025.00, and USD 6700.00 respectively.
10. Is the market size provided in terms of value or volume?
The market size is provided in terms of value, measured in N/A and volume, measured in K.
11. Are there any specific market keywords associated with the report?
Yes, the market keyword associated with the report is "Electronic Instrument Panel for Passenger Cars," which aids in identifying and referencing the specific market segment covered.
12. How do I determine which pricing option suits my needs best?
The pricing options vary based on user requirements and access needs. Individual users may opt for single-user licenses, while businesses requiring broader access may choose multi-user or enterprise licenses for cost-effective access to the report.
13. Are there any additional resources or data provided in the Electronic Instrument Panel for Passenger Cars report?
While the report offers comprehensive insights, it's advisable to review the specific contents or supplementary materials provided to ascertain if additional resources or data are available.
14. How can I stay updated on further developments or reports in the Electronic Instrument Panel for Passenger Cars?
To stay informed about further developments, trends, and reports in the Electronic Instrument Panel for Passenger Cars, consider subscribing to industry newsletters, following relevant companies and organizations, or regularly checking reputable industry news sources and publications.
Methodology
Step 1 - Identification of Relevant Samples Size from Population Database


Step 2 - Approaches for Defining Global Market Size (Value, Volume* & Price*)

Note*: In applicable scenarios
Step 3 - Data Sources
Primary Research
- Web Analytics
- Survey Reports
- Research Institute
- Latest Research Reports
- Opinion Leaders
Secondary Research
- Annual Reports
- White Paper
- Latest Press Release
- Industry Association
- Paid Database
- Investor Presentations

Step 4 - Data Triangulation
Involves using different sources of information in order to increase the validity of a study
These sources are likely to be stakeholders in a program - participants, other researchers, program staff, other community members, and so on.
Then we put all data in single framework & apply various statistical tools to find out the dynamic on the market.
During the analysis stage, feedback from the stakeholder groups would be compared to determine areas of agreement as well as areas of divergence