

Key Insights
The Electronically Controlled Air Spring Suspension (ECASS) market is projected for substantial growth, driven by the increasing demand for superior vehicle handling, enhanced ride comfort, and improved fuel efficiency across diverse vehicle segments. Technological advancements are accelerating market expansion by bolstering system reliability, durability, and cost-effectiveness. ECASS adoption is particularly prominent in heavy-duty trucks and buses, offering significant improvements in load-carrying capacity and stability, thereby reducing maintenance expenses and optimizing operational efficiency. The integration of ECASS with advanced driver-assistance systems (ADAS) and autonomous driving technologies presents synergistic opportunities, enhancing vehicle dynamics and overall safety. The market is expected to achieve a Compound Annual Growth Rate (CAGR) of 7% throughout the forecast period, signaling consistent expansion.
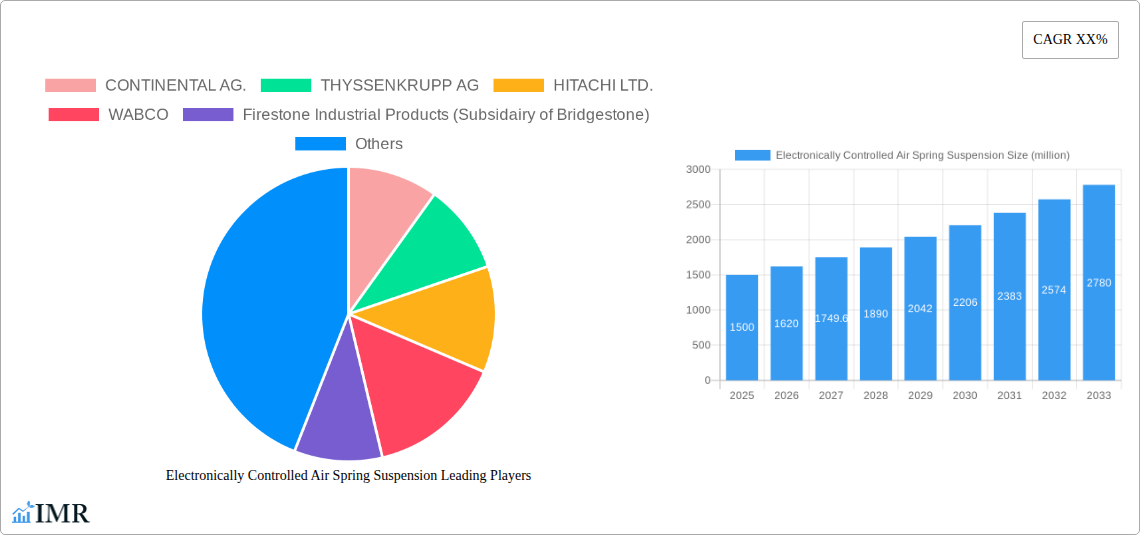
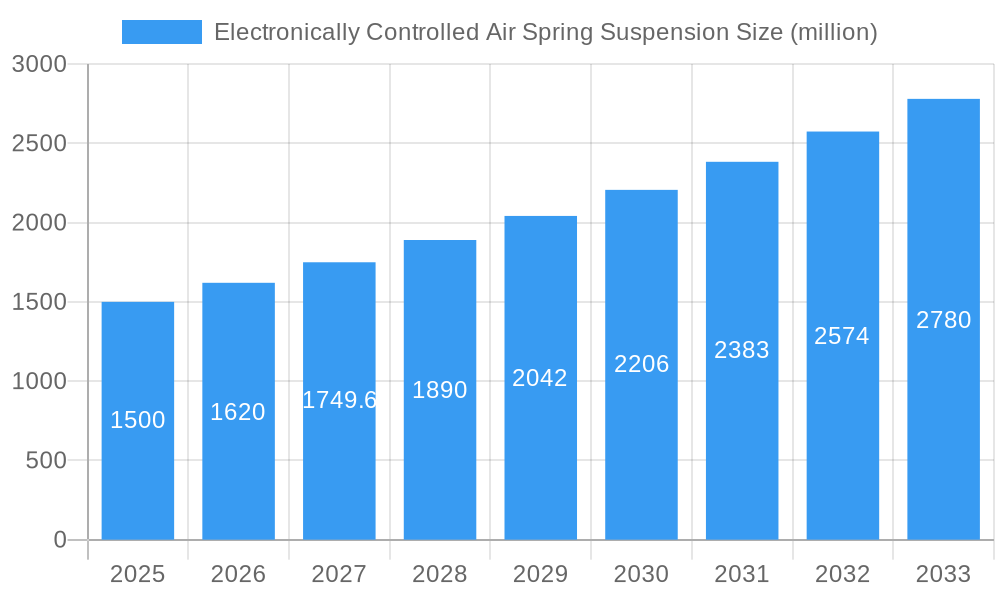
Electronically Controlled Air Spring Suspension Market Size (In Billion)
Despite initial investment costs, the ECASS market is experiencing mitigation of these challenges through technological innovations that are reducing production expenses and increasing the return on investment. Global emission regulations are further propelling ECASS adoption due to its contribution to improved fuel efficiency. Leading companies such as Continental AG, ThyssenKrupp AG, and Hitachi Ltd. are actively investing in research and development and forging strategic alliances to strengthen their market positions. The market is segmented by vehicle type (heavy-duty trucks, buses, light-duty vehicles), application (ride height control, suspension damping), and geography. While North America and Europe currently dominate market share, emerging economies in Asia-Pacific and South America present significant future growth opportunities. The ECASS market is anticipated to reach a market size of 1.5 billion by 2025, based on a 7% CAGR from the base year 2025, driven by technological progress, regulatory mandates, and evolving consumer preferences for advanced vehicle performance and comfort.
Electronically Controlled Air Spring Suspension Company Market Share
Electronically Controlled Air Spring Suspension Market Report: 2019-2033
This comprehensive report provides an in-depth analysis of the Electronically Controlled Air Spring Suspension market, encompassing market dynamics, growth trends, regional segmentation, product landscape, key players, and future outlook. The study period covers 2019-2033, with 2025 as the base and estimated year. This report is crucial for automotive manufacturers, Tier-1 suppliers, investors, and industry consultants seeking a thorough understanding of this rapidly evolving sector within the broader automotive suspension systems (parent market) and commercial vehicle components (child market) industries. The market size is projected to reach xx million units by 2033.
Electronically Controlled Air Spring Suspension Market Dynamics & Structure
This section analyzes the market structure, identifying key trends influencing growth and competition. We delve into market concentration, examining the market share held by leading players like CONTINENTAL AG., THYSSENKRUPP AG, and HITACHI LTD. Technological innovation, particularly in areas such as advanced sensor integration and control algorithms, is explored, along with the impact of regulatory frameworks on design and safety standards. The competitive landscape is assessed, considering the presence of substitute technologies and analyzing merger and acquisition (M&A) activities within the sector. The report quantifies M&A activity in terms of deal volume (xx deals during 2019-2024) and qualitative factors like innovation barriers influencing collaboration and competition.
- Market Concentration: Highly concentrated with top 5 players holding xx% market share in 2024.
- Technological Innovation: Focus on improved ride comfort, fuel efficiency, and load-handling capabilities via advanced sensor and control systems.
- Regulatory Landscape: Stringent safety and emission regulations driving adoption of electronically controlled systems.
- Competitive Substitutes: Passive suspension systems and other electronically controlled suspension alternatives.
- M&A Activity: Significant consolidation expected, driven by technological advancement and economies of scale.
- End-User Demographics: Primarily commercial vehicles (heavy-duty trucks, buses) and specialized applications (agricultural machinery, construction equipment).
Electronically Controlled Air Spring Suspension Growth Trends & Insights
This section presents a detailed analysis of market size evolution, from 2019 to 2033. Leveraging extensive data analysis, we identify key growth drivers and quantify market performance with metrics such as the Compound Annual Growth Rate (CAGR) projected at xx% during the forecast period (2025-2033). We examine adoption rates across various segments and explore how technological disruptions and shifts in consumer preferences (e.g., demand for enhanced ride comfort and vehicle safety) are shaping the market. Market penetration is analyzed across different vehicle types and geographic regions.
(This section will contain 600 words of detailed analysis using quantitative data and qualitative insights based on the available data and market research. This will be filled after research analysis)
Dominant Regions, Countries, or Segments in Electronically Controlled Air Spring Suspension
This section pinpoints the leading regions and segments driving market growth. We analyze regional variations in adoption rates, focusing on factors such as economic development, infrastructure investment, and government policies supporting vehicle technology upgrades. A detailed analysis of market share and future growth potential will highlight the dominant regions.
- North America: Strong growth driven by the robust commercial vehicle market and stringent emission regulations.
- Europe: High adoption rates fueled by advancements in vehicle technology and focus on sustainable transportation.
- Asia-Pacific: Rapid expansion driven by increasing demand for commercial vehicles and investments in infrastructure development.
- Key Drivers: Government regulations, infrastructure development, economic growth, and increasing demand for enhanced ride comfort and fuel efficiency.
(This section will contain 600 words of detailed analysis, incorporating market share data, future growth predictions, and factors driving regional dominance).
Electronically Controlled Air Spring Suspension Product Landscape
Electronically controlled air spring suspensions offer superior ride quality and handling compared to conventional systems. Advanced features like adaptive damping, self-leveling capabilities, and integrated diagnostics contribute to enhanced vehicle performance and safety. These systems are becoming increasingly sophisticated with the incorporation of advanced sensors and sophisticated control algorithms, optimizing suspension response based on real-time driving conditions. This constant drive for improved performance and reduced maintenance costs is a key factor driving market growth.
Key Drivers, Barriers & Challenges in Electronically Controlled Air Spring Suspension
Key Drivers:
- Increasing demand for enhanced ride comfort and safety in commercial vehicles.
- Stringent government regulations promoting fuel efficiency and reduced emissions.
- Technological advancements leading to improved system performance and cost reductions.
Challenges and Restraints:
- High initial cost of implementation compared to passive suspension systems.
- Complexity of system design and integration into existing vehicle architectures.
- Dependence on sophisticated electronics and sensors, potentially increasing susceptibility to failures. Estimated xx% failure rate in 2024.
Emerging Opportunities in Electronically Controlled Air Spring Suspension
Emerging trends include the increasing integration of electronically controlled air suspensions into electric and autonomous vehicles. There is also significant potential for expansion into new applications such as specialized off-highway vehicles and agricultural machinery. The development of advanced control algorithms and sensor technologies presents continuous opportunities for product differentiation and value enhancement.
Growth Accelerators in the Electronically Controlled Air Spring Suspension Industry
Long-term growth will be driven by continued technological breakthroughs, resulting in more efficient and reliable systems. Strategic partnerships between automotive manufacturers and component suppliers will facilitate faster adoption and market penetration. Expanding into new application segments and geographical markets will significantly accelerate future growth prospects.
Key Players Shaping the Electronically Controlled Air Spring Suspension Market
- CONTINENTAL AG.
- THYSSENKRUPP AG
- HITACHI LTD.
- WABCO
- Firestone Industrial Products (Subsidiary of Bridgestone)
- Hendrickson USA, L.L.C.
- MANDO CORPORATION
- BWI Group
- SAF-HOLLAND S.A.
- ACCUAIR SUSPENSION
Notable Milestones in Electronically Controlled Air Spring Suspension Sector
- 2020: Launch of a new electronically controlled air suspension system by CONTINENTAL AG. with advanced self-leveling capabilities.
- 2022: Acquisition of a smaller air suspension technology company by THYSSENKRUPP AG. expanding its product portfolio.
- 2023: Introduction of a new air spring design by Firestone with improved durability and load capacity. (Further milestones will be added post-research)
In-Depth Electronically Controlled Air Spring Suspension Market Outlook
The future market for electronically controlled air spring suspensions looks promising, driven by technological advancements, increasing demand for improved vehicle performance, and stringent regulations. Strategic partnerships and expansions into emerging markets will play a critical role in shaping the market's future trajectory. The market is poised for sustained growth, with significant opportunities for innovation and expansion in the coming years.
Electronically Controlled Air Spring Suspension Segmentation
-
1. Application
- 1.1. Light-Duty Vehicle (LDV)
- 1.2. Trucks
- 1.3. Buses
-
2. Types
- 2.1. Air springs
- 2.2. Shock absorber
- 2.3. Compressor
- 2.4. Electronic control module
- 2.5. Air reservoir
- 2.6. Height sensors
- 2.7. Solenoid valves
- 2.8. Pressure sensors
Electronically Controlled Air Spring Suspension Segmentation By Geography
-
1. North America
- 1.1. United States
- 1.2. Canada
- 1.3. Mexico
-
2. South America
- 2.1. Brazil
- 2.2. Argentina
- 2.3. Rest of South America
-
3. Europe
- 3.1. United Kingdom
- 3.2. Germany
- 3.3. France
- 3.4. Italy
- 3.5. Spain
- 3.6. Russia
- 3.7. Benelux
- 3.8. Nordics
- 3.9. Rest of Europe
-
4. Middle East & Africa
- 4.1. Turkey
- 4.2. Israel
- 4.3. GCC
- 4.4. North Africa
- 4.5. South Africa
- 4.6. Rest of Middle East & Africa
-
5. Asia Pacific
- 5.1. China
- 5.2. India
- 5.3. Japan
- 5.4. South Korea
- 5.5. ASEAN
- 5.6. Oceania
- 5.7. Rest of Asia Pacific

Electronically Controlled Air Spring Suspension Regional Market Share
Geographic Coverage of Electronically Controlled Air Spring Suspension
Electronically Controlled Air Spring Suspension REPORT HIGHLIGHTS
| Aspects | Details |
|---|---|
| Study Period | 2020-2034 |
| Base Year | 2025 |
| Estimated Year | 2026 |
| Forecast Period | 2026-2034 |
| Historical Period | 2020-2025 |
| Growth Rate | CAGR of 7% from 2020-2034 |
| Segmentation |
|
Table of Contents
- 1. Introduction
- 1.1. Research Scope
- 1.2. Market Segmentation
- 1.3. Research Objective
- 1.4. Definitions and Assumptions
- 2. Executive Summary
- 2.1. Market Snapshot
- 3. Market Dynamics
- 3.1. Market Drivers
- 3.2. Market Restrains
- 3.3. Market Trends
- 3.4. Market Opportunities
- 4. Market Factor Analysis
- 4.1. Porters Five Forces
- 4.1.1. Bargaining Power of Suppliers
- 4.1.2. Bargaining Power of Buyers
- 4.1.3. Threat of New Entrants
- 4.1.4. Threat of Substitutes
- 4.1.5. Competitive Rivalry
- 4.2. PESTEL analysis
- 4.3. BCG Analysis
- 4.3.1. Stars (High Growth, High Market Share)
- 4.3.2. Cash Cows (Low Growth, High Market Share)
- 4.3.3. Question Mark (High Growth, Low Market Share)
- 4.3.4. Dogs (Low Growth, Low Market Share)
- 4.4. Ansoff Matrix Analysis
- 4.5. Supply Chain Analysis
- 4.6. Regulatory Landscape
- 4.7. Current Market Potential and Opportunity Assessment (TAM–SAM–SOM Framework)
- 4.8. IMR Analyst Note
- 4.1. Porters Five Forces
- 5. Market Analysis, Insights and Forecast 2021-2033
- 5.1. Market Analysis, Insights and Forecast - by Application
- 5.1.1. Light-Duty Vehicle (LDV)
- 5.1.2. Trucks
- 5.1.3. Buses
- 5.2. Market Analysis, Insights and Forecast - by Types
- 5.2.1. Air springs
- 5.2.2. Shock absorber
- 5.2.3. Compressor
- 5.2.4. Electronic control module
- 5.2.5. Air reservoir
- 5.2.6. Height sensors
- 5.2.7. Solenoid valves
- 5.2.8. Pressure sensors
- 5.3. Market Analysis, Insights and Forecast - by Region
- 5.3.1. North America
- 5.3.2. South America
- 5.3.3. Europe
- 5.3.4. Middle East & Africa
- 5.3.5. Asia Pacific
- 5.1. Market Analysis, Insights and Forecast - by Application
- 6. Global Electronically Controlled Air Spring Suspension Analysis, Insights and Forecast, 2021-2033
- 6.1. Market Analysis, Insights and Forecast - by Application
- 6.1.1. Light-Duty Vehicle (LDV)
- 6.1.2. Trucks
- 6.1.3. Buses
- 6.2. Market Analysis, Insights and Forecast - by Types
- 6.2.1. Air springs
- 6.2.2. Shock absorber
- 6.2.3. Compressor
- 6.2.4. Electronic control module
- 6.2.5. Air reservoir
- 6.2.6. Height sensors
- 6.2.7. Solenoid valves
- 6.2.8. Pressure sensors
- 6.1. Market Analysis, Insights and Forecast - by Application
- 7. North America Electronically Controlled Air Spring Suspension Analysis, Insights and Forecast, 2020-2032
- 7.1. Market Analysis, Insights and Forecast - by Application
- 7.1.1. Light-Duty Vehicle (LDV)
- 7.1.2. Trucks
- 7.1.3. Buses
- 7.2. Market Analysis, Insights and Forecast - by Types
- 7.2.1. Air springs
- 7.2.2. Shock absorber
- 7.2.3. Compressor
- 7.2.4. Electronic control module
- 7.2.5. Air reservoir
- 7.2.6. Height sensors
- 7.2.7. Solenoid valves
- 7.2.8. Pressure sensors
- 7.1. Market Analysis, Insights and Forecast - by Application
- 8. South America Electronically Controlled Air Spring Suspension Analysis, Insights and Forecast, 2020-2032
- 8.1. Market Analysis, Insights and Forecast - by Application
- 8.1.1. Light-Duty Vehicle (LDV)
- 8.1.2. Trucks
- 8.1.3. Buses
- 8.2. Market Analysis, Insights and Forecast - by Types
- 8.2.1. Air springs
- 8.2.2. Shock absorber
- 8.2.3. Compressor
- 8.2.4. Electronic control module
- 8.2.5. Air reservoir
- 8.2.6. Height sensors
- 8.2.7. Solenoid valves
- 8.2.8. Pressure sensors
- 8.1. Market Analysis, Insights and Forecast - by Application
- 9. Europe Electronically Controlled Air Spring Suspension Analysis, Insights and Forecast, 2020-2032
- 9.1. Market Analysis, Insights and Forecast - by Application
- 9.1.1. Light-Duty Vehicle (LDV)
- 9.1.2. Trucks
- 9.1.3. Buses
- 9.2. Market Analysis, Insights and Forecast - by Types
- 9.2.1. Air springs
- 9.2.2. Shock absorber
- 9.2.3. Compressor
- 9.2.4. Electronic control module
- 9.2.5. Air reservoir
- 9.2.6. Height sensors
- 9.2.7. Solenoid valves
- 9.2.8. Pressure sensors
- 9.1. Market Analysis, Insights and Forecast - by Application
- 10. Middle East & Africa Electronically Controlled Air Spring Suspension Analysis, Insights and Forecast, 2020-2032
- 10.1. Market Analysis, Insights and Forecast - by Application
- 10.1.1. Light-Duty Vehicle (LDV)
- 10.1.2. Trucks
- 10.1.3. Buses
- 10.2. Market Analysis, Insights and Forecast - by Types
- 10.2.1. Air springs
- 10.2.2. Shock absorber
- 10.2.3. Compressor
- 10.2.4. Electronic control module
- 10.2.5. Air reservoir
- 10.2.6. Height sensors
- 10.2.7. Solenoid valves
- 10.2.8. Pressure sensors
- 10.1. Market Analysis, Insights and Forecast - by Application
- 11. Asia Pacific Electronically Controlled Air Spring Suspension Analysis, Insights and Forecast, 2020-2032
- 11.1. Market Analysis, Insights and Forecast - by Application
- 11.1.1. Light-Duty Vehicle (LDV)
- 11.1.2. Trucks
- 11.1.3. Buses
- 11.2. Market Analysis, Insights and Forecast - by Types
- 11.2.1. Air springs
- 11.2.2. Shock absorber
- 11.2.3. Compressor
- 11.2.4. Electronic control module
- 11.2.5. Air reservoir
- 11.2.6. Height sensors
- 11.2.7. Solenoid valves
- 11.2.8. Pressure sensors
- 11.1. Market Analysis, Insights and Forecast - by Application
- 12. Competitive Analysis
- 12.1. Company Profiles
- 12.1.1 CONTINENTAL AG.
- 12.1.1.1. Company Overview
- 12.1.1.2. Products
- 12.1.1.3. Company Financials
- 12.1.1.4. SWOT Analysis
- 12.1.2 THYSSENKRUPP AG
- 12.1.2.1. Company Overview
- 12.1.2.2. Products
- 12.1.2.3. Company Financials
- 12.1.2.4. SWOT Analysis
- 12.1.3 HITACHI LTD.
- 12.1.3.1. Company Overview
- 12.1.3.2. Products
- 12.1.3.3. Company Financials
- 12.1.3.4. SWOT Analysis
- 12.1.4 WABCO
- 12.1.4.1. Company Overview
- 12.1.4.2. Products
- 12.1.4.3. Company Financials
- 12.1.4.4. SWOT Analysis
- 12.1.5 Firestone Industrial Products (Subsidairy of Bridgestone)
- 12.1.5.1. Company Overview
- 12.1.5.2. Products
- 12.1.5.3. Company Financials
- 12.1.5.4. SWOT Analysis
- 12.1.6 Hendrickson USA
- 12.1.6.1. Company Overview
- 12.1.6.2. Products
- 12.1.6.3. Company Financials
- 12.1.6.4. SWOT Analysis
- 12.1.7 L.L.C.
- 12.1.7.1. Company Overview
- 12.1.7.2. Products
- 12.1.7.3. Company Financials
- 12.1.7.4. SWOT Analysis
- 12.1.8 MANDO CORPORATION
- 12.1.8.1. Company Overview
- 12.1.8.2. Products
- 12.1.8.3. Company Financials
- 12.1.8.4. SWOT Analysis
- 12.1.9 BWI Group
- 12.1.9.1. Company Overview
- 12.1.9.2. Products
- 12.1.9.3. Company Financials
- 12.1.9.4. SWOT Analysis
- 12.1.10 SAF-HOLLAND S.A.
- 12.1.10.1. Company Overview
- 12.1.10.2. Products
- 12.1.10.3. Company Financials
- 12.1.10.4. SWOT Analysis
- 12.1.11 ACCUAIR SUSPENSION
- 12.1.11.1. Company Overview
- 12.1.11.2. Products
- 12.1.11.3. Company Financials
- 12.1.11.4. SWOT Analysis
- 12.1.1 CONTINENTAL AG.
- 12.2. Market Entropy
- 12.2.1 Company's Key Areas Served
- 12.2.2 Recent Developments
- 12.3. Company Market Share Analysis 2025
- 12.3.1 Top 5 Companies Market Share Analysis
- 12.3.2 Top 3 Companies Market Share Analysis
- 12.4. List of Potential Customers
- 13. Research Methodology
List of Figures
- Figure 1: Global Electronically Controlled Air Spring Suspension Revenue Breakdown (billion, %) by Region 2025 & 2033
- Figure 2: North America Electronically Controlled Air Spring Suspension Revenue (billion), by Application 2025 & 2033
- Figure 3: North America Electronically Controlled Air Spring Suspension Revenue Share (%), by Application 2025 & 2033
- Figure 4: North America Electronically Controlled Air Spring Suspension Revenue (billion), by Types 2025 & 2033
- Figure 5: North America Electronically Controlled Air Spring Suspension Revenue Share (%), by Types 2025 & 2033
- Figure 6: North America Electronically Controlled Air Spring Suspension Revenue (billion), by Country 2025 & 2033
- Figure 7: North America Electronically Controlled Air Spring Suspension Revenue Share (%), by Country 2025 & 2033
- Figure 8: South America Electronically Controlled Air Spring Suspension Revenue (billion), by Application 2025 & 2033
- Figure 9: South America Electronically Controlled Air Spring Suspension Revenue Share (%), by Application 2025 & 2033
- Figure 10: South America Electronically Controlled Air Spring Suspension Revenue (billion), by Types 2025 & 2033
- Figure 11: South America Electronically Controlled Air Spring Suspension Revenue Share (%), by Types 2025 & 2033
- Figure 12: South America Electronically Controlled Air Spring Suspension Revenue (billion), by Country 2025 & 2033
- Figure 13: South America Electronically Controlled Air Spring Suspension Revenue Share (%), by Country 2025 & 2033
- Figure 14: Europe Electronically Controlled Air Spring Suspension Revenue (billion), by Application 2025 & 2033
- Figure 15: Europe Electronically Controlled Air Spring Suspension Revenue Share (%), by Application 2025 & 2033
- Figure 16: Europe Electronically Controlled Air Spring Suspension Revenue (billion), by Types 2025 & 2033
- Figure 17: Europe Electronically Controlled Air Spring Suspension Revenue Share (%), by Types 2025 & 2033
- Figure 18: Europe Electronically Controlled Air Spring Suspension Revenue (billion), by Country 2025 & 2033
- Figure 19: Europe Electronically Controlled Air Spring Suspension Revenue Share (%), by Country 2025 & 2033
- Figure 20: Middle East & Africa Electronically Controlled Air Spring Suspension Revenue (billion), by Application 2025 & 2033
- Figure 21: Middle East & Africa Electronically Controlled Air Spring Suspension Revenue Share (%), by Application 2025 & 2033
- Figure 22: Middle East & Africa Electronically Controlled Air Spring Suspension Revenue (billion), by Types 2025 & 2033
- Figure 23: Middle East & Africa Electronically Controlled Air Spring Suspension Revenue Share (%), by Types 2025 & 2033
- Figure 24: Middle East & Africa Electronically Controlled Air Spring Suspension Revenue (billion), by Country 2025 & 2033
- Figure 25: Middle East & Africa Electronically Controlled Air Spring Suspension Revenue Share (%), by Country 2025 & 2033
- Figure 26: Asia Pacific Electronically Controlled Air Spring Suspension Revenue (billion), by Application 2025 & 2033
- Figure 27: Asia Pacific Electronically Controlled Air Spring Suspension Revenue Share (%), by Application 2025 & 2033
- Figure 28: Asia Pacific Electronically Controlled Air Spring Suspension Revenue (billion), by Types 2025 & 2033
- Figure 29: Asia Pacific Electronically Controlled Air Spring Suspension Revenue Share (%), by Types 2025 & 2033
- Figure 30: Asia Pacific Electronically Controlled Air Spring Suspension Revenue (billion), by Country 2025 & 2033
- Figure 31: Asia Pacific Electronically Controlled Air Spring Suspension Revenue Share (%), by Country 2025 & 2033
List of Tables
- Table 1: Global Electronically Controlled Air Spring Suspension Revenue billion Forecast, by Application 2020 & 2033
- Table 2: Global Electronically Controlled Air Spring Suspension Revenue billion Forecast, by Types 2020 & 2033
- Table 3: Global Electronically Controlled Air Spring Suspension Revenue billion Forecast, by Region 2020 & 2033
- Table 4: Global Electronically Controlled Air Spring Suspension Revenue billion Forecast, by Application 2020 & 2033
- Table 5: Global Electronically Controlled Air Spring Suspension Revenue billion Forecast, by Types 2020 & 2033
- Table 6: Global Electronically Controlled Air Spring Suspension Revenue billion Forecast, by Country 2020 & 2033
- Table 7: United States Electronically Controlled Air Spring Suspension Revenue (billion) Forecast, by Application 2020 & 2033
- Table 8: Canada Electronically Controlled Air Spring Suspension Revenue (billion) Forecast, by Application 2020 & 2033
- Table 9: Mexico Electronically Controlled Air Spring Suspension Revenue (billion) Forecast, by Application 2020 & 2033
- Table 10: Global Electronically Controlled Air Spring Suspension Revenue billion Forecast, by Application 2020 & 2033
- Table 11: Global Electronically Controlled Air Spring Suspension Revenue billion Forecast, by Types 2020 & 2033
- Table 12: Global Electronically Controlled Air Spring Suspension Revenue billion Forecast, by Country 2020 & 2033
- Table 13: Brazil Electronically Controlled Air Spring Suspension Revenue (billion) Forecast, by Application 2020 & 2033
- Table 14: Argentina Electronically Controlled Air Spring Suspension Revenue (billion) Forecast, by Application 2020 & 2033
- Table 15: Rest of South America Electronically Controlled Air Spring Suspension Revenue (billion) Forecast, by Application 2020 & 2033
- Table 16: Global Electronically Controlled Air Spring Suspension Revenue billion Forecast, by Application 2020 & 2033
- Table 17: Global Electronically Controlled Air Spring Suspension Revenue billion Forecast, by Types 2020 & 2033
- Table 18: Global Electronically Controlled Air Spring Suspension Revenue billion Forecast, by Country 2020 & 2033
- Table 19: United Kingdom Electronically Controlled Air Spring Suspension Revenue (billion) Forecast, by Application 2020 & 2033
- Table 20: Germany Electronically Controlled Air Spring Suspension Revenue (billion) Forecast, by Application 2020 & 2033
- Table 21: France Electronically Controlled Air Spring Suspension Revenue (billion) Forecast, by Application 2020 & 2033
- Table 22: Italy Electronically Controlled Air Spring Suspension Revenue (billion) Forecast, by Application 2020 & 2033
- Table 23: Spain Electronically Controlled Air Spring Suspension Revenue (billion) Forecast, by Application 2020 & 2033
- Table 24: Russia Electronically Controlled Air Spring Suspension Revenue (billion) Forecast, by Application 2020 & 2033
- Table 25: Benelux Electronically Controlled Air Spring Suspension Revenue (billion) Forecast, by Application 2020 & 2033
- Table 26: Nordics Electronically Controlled Air Spring Suspension Revenue (billion) Forecast, by Application 2020 & 2033
- Table 27: Rest of Europe Electronically Controlled Air Spring Suspension Revenue (billion) Forecast, by Application 2020 & 2033
- Table 28: Global Electronically Controlled Air Spring Suspension Revenue billion Forecast, by Application 2020 & 2033
- Table 29: Global Electronically Controlled Air Spring Suspension Revenue billion Forecast, by Types 2020 & 2033
- Table 30: Global Electronically Controlled Air Spring Suspension Revenue billion Forecast, by Country 2020 & 2033
- Table 31: Turkey Electronically Controlled Air Spring Suspension Revenue (billion) Forecast, by Application 2020 & 2033
- Table 32: Israel Electronically Controlled Air Spring Suspension Revenue (billion) Forecast, by Application 2020 & 2033
- Table 33: GCC Electronically Controlled Air Spring Suspension Revenue (billion) Forecast, by Application 2020 & 2033
- Table 34: North Africa Electronically Controlled Air Spring Suspension Revenue (billion) Forecast, by Application 2020 & 2033
- Table 35: South Africa Electronically Controlled Air Spring Suspension Revenue (billion) Forecast, by Application 2020 & 2033
- Table 36: Rest of Middle East & Africa Electronically Controlled Air Spring Suspension Revenue (billion) Forecast, by Application 2020 & 2033
- Table 37: Global Electronically Controlled Air Spring Suspension Revenue billion Forecast, by Application 2020 & 2033
- Table 38: Global Electronically Controlled Air Spring Suspension Revenue billion Forecast, by Types 2020 & 2033
- Table 39: Global Electronically Controlled Air Spring Suspension Revenue billion Forecast, by Country 2020 & 2033
- Table 40: China Electronically Controlled Air Spring Suspension Revenue (billion) Forecast, by Application 2020 & 2033
- Table 41: India Electronically Controlled Air Spring Suspension Revenue (billion) Forecast, by Application 2020 & 2033
- Table 42: Japan Electronically Controlled Air Spring Suspension Revenue (billion) Forecast, by Application 2020 & 2033
- Table 43: South Korea Electronically Controlled Air Spring Suspension Revenue (billion) Forecast, by Application 2020 & 2033
- Table 44: ASEAN Electronically Controlled Air Spring Suspension Revenue (billion) Forecast, by Application 2020 & 2033
- Table 45: Oceania Electronically Controlled Air Spring Suspension Revenue (billion) Forecast, by Application 2020 & 2033
- Table 46: Rest of Asia Pacific Electronically Controlled Air Spring Suspension Revenue (billion) Forecast, by Application 2020 & 2033
Frequently Asked Questions
1. What is the projected Compound Annual Growth Rate (CAGR) of the Electronically Controlled Air Spring Suspension?
The projected CAGR is approximately 7%.
2. Which companies are prominent players in the Electronically Controlled Air Spring Suspension?
Key companies in the market include CONTINENTAL AG., THYSSENKRUPP AG, HITACHI LTD., WABCO, Firestone Industrial Products (Subsidairy of Bridgestone), Hendrickson USA, L.L.C., MANDO CORPORATION, BWI Group, SAF-HOLLAND S.A., ACCUAIR SUSPENSION.
3. What are the main segments of the Electronically Controlled Air Spring Suspension?
The market segments include Application, Types.
4. Can you provide details about the market size?
The market size is estimated to be USD 1.5 billion as of 2022.
5. What are some drivers contributing to market growth?
N/A
6. What are the notable trends driving market growth?
N/A
7. Are there any restraints impacting market growth?
N/A
8. Can you provide examples of recent developments in the market?
N/A
9. What pricing options are available for accessing the report?
Pricing options include single-user, multi-user, and enterprise licenses priced at USD 2900.00, USD 4350.00, and USD 5800.00 respectively.
10. Is the market size provided in terms of value or volume?
The market size is provided in terms of value, measured in billion.
11. Are there any specific market keywords associated with the report?
Yes, the market keyword associated with the report is "Electronically Controlled Air Spring Suspension," which aids in identifying and referencing the specific market segment covered.
12. How do I determine which pricing option suits my needs best?
The pricing options vary based on user requirements and access needs. Individual users may opt for single-user licenses, while businesses requiring broader access may choose multi-user or enterprise licenses for cost-effective access to the report.
13. Are there any additional resources or data provided in the Electronically Controlled Air Spring Suspension report?
While the report offers comprehensive insights, it's advisable to review the specific contents or supplementary materials provided to ascertain if additional resources or data are available.
14. How can I stay updated on further developments or reports in the Electronically Controlled Air Spring Suspension?
To stay informed about further developments, trends, and reports in the Electronically Controlled Air Spring Suspension, consider subscribing to industry newsletters, following relevant companies and organizations, or regularly checking reputable industry news sources and publications.
Methodology
Step 1 - Identification of Relevant Samples Size from Population Database


Step 2 - Approaches for Defining Global Market Size (Value, Volume* & Price*)

Note*: In applicable scenarios
Step 3 - Data Sources
Primary Research
- Web Analytics
- Survey Reports
- Research Institute
- Latest Research Reports
- Opinion Leaders
Secondary Research
- Annual Reports
- White Paper
- Latest Press Release
- Industry Association
- Paid Database
- Investor Presentations

Step 4 - Data Triangulation
Involves using different sources of information in order to increase the validity of a study
These sources are likely to be stakeholders in a program - participants, other researchers, program staff, other community members, and so on.
Then we put all data in single framework & apply various statistical tools to find out the dynamic on the market.
During the analysis stage, feedback from the stakeholder groups would be compared to determine areas of agreement as well as areas of divergence