

Key Insights
The global engine-driven railcar mover market is projected for substantial expansion, propelled by the increasing need for efficient railcar handling across diverse industrial sectors. Key growth drivers include the rising adoption of intermodal transportation, the imperative for enhanced logistics efficiency in manufacturing and mining, and continuous investment in global railway infrastructure modernization. The market is segmented by mover type, application, and region. The market size was estimated at $10.3 billion in the base year of 2025, with a projected compound annual growth rate (CAGR) of 12.31%. Growth is anticipated to be consistent across major regions, with North America and Europe potentially exhibiting accelerated adoption due to established rail networks and ongoing infrastructure development.
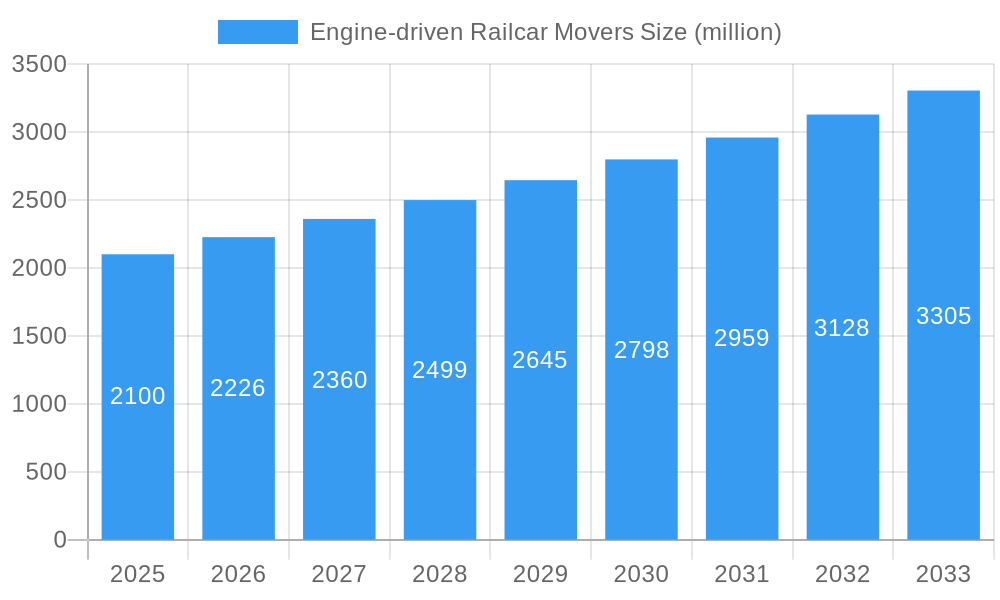
Engine-driven Railcar Movers Market Size (In Billion)
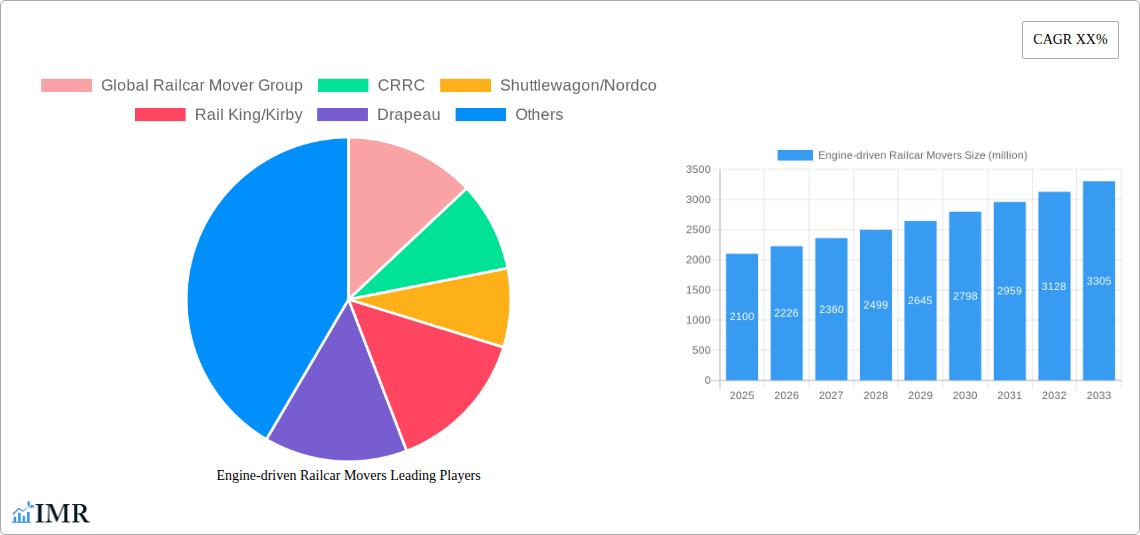
However, fluctuating fuel prices and potential emission-related regulatory challenges may present obstacles to sustained market growth. The engine-driven railcar mover market features a moderately fragmented competitive landscape, with leading companies including Global Railcar Mover Group, CRRC, and Shuttlewagon/Nordco. The growing demand for eco-friendly and technologically advanced movers is stimulating innovation, leading to the development of more fuel-efficient and automated solutions. Continued emphasis on operational safety and efficiency is expected to drive demand for advanced features like remote control capabilities and improved safety systems.
Engine-driven Railcar Movers Company Market Share
Engine-Driven Railcar Movers Market Report: 2019-2033
This comprehensive report provides an in-depth analysis of the global engine-driven railcar movers market, encompassing historical data (2019-2024), current estimates (2025), and future projections (2025-2033). The report segments the market by key players, regions, and applications, offering invaluable insights for industry professionals, investors, and strategic decision-makers. With a focus on market size (in million units), growth trends, technological advancements, and competitive dynamics, this report is a crucial resource for navigating the complexities of this dynamic sector. Parent market: Rail Transportation; Child market: Railway Equipment.
Engine-driven Railcar Movers Market Dynamics & Structure
This section analyzes the market structure, competition, and influencing factors. We examine market concentration, revealing the share held by key players like Global Railcar Mover Group, CRRC, and Shuttlewagon/Nordco. Technological innovations, such as advancements in engine efficiency and automation, are assessed, along with their impact on market growth. Regulatory frameworks and their influence on market accessibility are also explored. Furthermore, the report analyzes competitive substitutes, end-user demographics (e.g., freight companies, mining operations), and M&A activity within the industry.
- Market Concentration: The market is moderately concentrated, with the top 5 players holding approximately xx% of the market share in 2025.
- Technological Innovation: Advancements in engine technology (e.g., hybrid and electric) are driving efficiency improvements. The adoption of automation and remote control systems is also impacting the market.
- Regulatory Landscape: Stringent safety regulations and environmental standards are shaping market dynamics.
- M&A Activity: The past 5 years witnessed xx M&A deals, primarily focused on consolidating market share and expanding technological capabilities. The average deal value was approximately xx million units.
- Innovation Barriers: High R&D costs and the need for specialized engineering expertise pose significant barriers to entry.
Engine-driven Railcar Movers Growth Trends & Insights
This section leverages detailed market research to provide a comprehensive analysis of the engine-driven railcar movers market's growth trajectory. We delve into historical market size evolution, tracing the growth from xx million units in 2019 to an estimated xx million units in 2025. The report projects a Compound Annual Growth Rate (CAGR) of xx% during the forecast period (2025-2033), reaching a projected size of xx million units by 2033. We examine factors driving adoption rates, including infrastructure development in emerging economies and the increasing demand for efficient freight transportation. Technological disruptions, such as the introduction of autonomous systems, are analyzed for their influence on market growth and consumer behavior shifts.
Dominant Regions, Countries, or Segments in Engine-driven Railcar Movers
This section identifies the leading regions and segments driving market growth. Analysis reveals that [Region Name] currently holds the largest market share, driven by robust infrastructure investment and a growing industrial sector. [Country Name] is a key contributor within this region, showcasing strong growth potential due to [specific reasons, e.g., government incentives, expanding rail networks].
- Key Drivers in [Region Name]:
- Significant investments in railway infrastructure modernization.
- Expanding industrial and mining sectors demanding efficient railcar movement.
- Favorable government policies supporting the adoption of advanced rail technologies.
- Dominance Factors: High demand for rail freight transportation and the presence of major industry players.
- Growth Potential: Continued infrastructure development and rising industrial activity contribute to substantial growth potential.
Engine-driven Railcar Movers Product Landscape
Engine-driven railcar movers are evolving, incorporating advancements in engine technology, automation, and remote control capabilities. New models emphasize improved fuel efficiency, reduced emissions, and enhanced operational safety. Key features include advanced diagnostics, remote monitoring, and increased payload capacities. These innovations cater to the growing need for efficient and environmentally conscious freight transportation solutions.
Key Drivers, Barriers & Challenges in Engine-driven Railcar Movers
Key Drivers: The increasing demand for efficient freight transportation, particularly in the mining, manufacturing, and logistics sectors, is a major driver. Investments in railway infrastructure development across various regions contribute significantly to market growth. Technological advancements leading to improved fuel efficiency and operational safety further boost market demand.
Key Challenges & Restraints: High initial investment costs and the complexities of integrating new technologies into existing rail systems pose challenges. Supply chain disruptions related to component sourcing and manufacturing can hinder market growth. Stringent safety regulations and environmental compliance requirements also create hurdles. Intense competition from established and new players further intensifies the market dynamics.
Emerging Opportunities in Engine-driven Railcar Movers
Emerging opportunities lie in expanding into untapped markets, particularly in developing economies with growing infrastructure needs. The integration of advanced technologies, such as autonomous systems and predictive maintenance, presents lucrative opportunities. Developing customized solutions for specific industry needs, such as specialized railcar movers for hazardous materials, further expands market potential. Focus on environmentally friendly technologies, like electric or hybrid railcar movers, aligns with global sustainability goals, creating new growth avenues.
Growth Accelerators in the Engine-driven Railcar Movers Industry
Long-term growth in the engine-driven railcar movers market will be fueled by technological breakthroughs, particularly in automation and electrification. Strategic partnerships between manufacturers and railway operators will enhance market penetration. Expansive infrastructure development projects, both in developed and developing countries, will create substantial demand. A focus on sustainable and efficient solutions will further drive market expansion.
Key Players Shaping the Engine-driven Railcar Movers Market
- Global Railcar Mover Group
- CRRC
- Shuttlewagon/Nordco
- Rail King/Kirby
- Drapeau
- Colmar Technik
- Unilokomotive
- BOSS RCM
- Brandt Group
- Dongda Power
- G. Zwiehoff
- UROMAC SYSTEMS
- Tietong
Notable Milestones in Engine-driven Railcar Movers Sector
- 2022: Global Railcar Mover Group launched its new line of hybrid railcar movers.
- 2023: CRRC announced a major contract for the supply of automated railcar movers to a large mining company.
- 2024: Shuttlewagon/Nordco unveiled a new remote control system for its railcar movers.
- (Add more milestones as available)
In-Depth Engine-driven Railcar Movers Market Outlook
The engine-driven railcar movers market is poised for continued growth, driven by technological innovation, infrastructure development, and increasing demand for efficient freight transportation. Strategic opportunities exist for companies focusing on sustainable solutions, automation, and customized offerings. The market's future is bright, with significant potential for expansion in both developed and developing economies.
Engine-driven Railcar Movers Segmentation
-
1. Application
- 1.1. Public Railway
- 1.2. Industrial Railway
-
2. Types
- 2.1. Single Coupled
- 2.2. Double Coupled
Engine-driven Railcar Movers Segmentation By Geography
-
1. North America
- 1.1. United States
- 1.2. Canada
- 1.3. Mexico
-
2. South America
- 2.1. Brazil
- 2.2. Argentina
- 2.3. Rest of South America
-
3. Europe
- 3.1. United Kingdom
- 3.2. Germany
- 3.3. France
- 3.4. Italy
- 3.5. Spain
- 3.6. Russia
- 3.7. Benelux
- 3.8. Nordics
- 3.9. Rest of Europe
-
4. Middle East & Africa
- 4.1. Turkey
- 4.2. Israel
- 4.3. GCC
- 4.4. North Africa
- 4.5. South Africa
- 4.6. Rest of Middle East & Africa
-
5. Asia Pacific
- 5.1. China
- 5.2. India
- 5.3. Japan
- 5.4. South Korea
- 5.5. ASEAN
- 5.6. Oceania
- 5.7. Rest of Asia Pacific
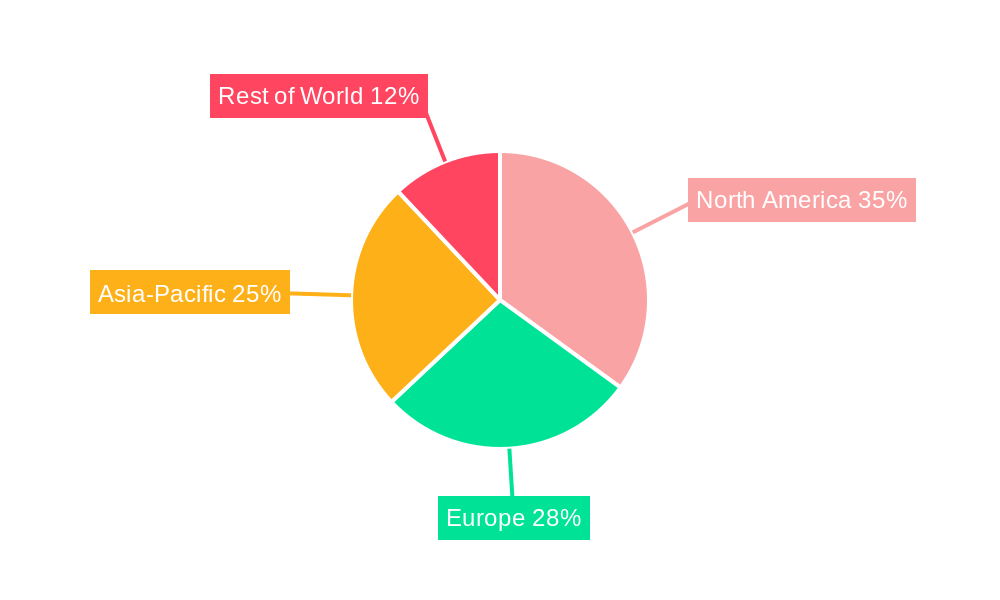
Engine-driven Railcar Movers Regional Market Share
Geographic Coverage of Engine-driven Railcar Movers
Engine-driven Railcar Movers REPORT HIGHLIGHTS
| Aspects | Details |
|---|---|
| Study Period | 2020-2034 |
| Base Year | 2025 |
| Estimated Year | 2026 |
| Forecast Period | 2026-2034 |
| Historical Period | 2020-2025 |
| Growth Rate | CAGR of 12.31% from 2020-2034 |
| Segmentation |
|
Table of Contents
- 1. Introduction
- 1.1. Research Scope
- 1.2. Market Segmentation
- 1.3. Research Objective
- 1.4. Definitions and Assumptions
- 2. Executive Summary
- 2.1. Market Snapshot
- 3. Market Dynamics
- 3.1. Market Drivers
- 3.2. Market Restrains
- 3.3. Market Trends
- 3.4. Market Opportunities
- 4. Market Factor Analysis
- 4.1. Porters Five Forces
- 4.1.1. Bargaining Power of Suppliers
- 4.1.2. Bargaining Power of Buyers
- 4.1.3. Threat of New Entrants
- 4.1.4. Threat of Substitutes
- 4.1.5. Competitive Rivalry
- 4.2. PESTEL analysis
- 4.3. BCG Analysis
- 4.3.1. Stars (High Growth, High Market Share)
- 4.3.2. Cash Cows (Low Growth, High Market Share)
- 4.3.3. Question Mark (High Growth, Low Market Share)
- 4.3.4. Dogs (Low Growth, Low Market Share)
- 4.4. Ansoff Matrix Analysis
- 4.5. Supply Chain Analysis
- 4.6. Regulatory Landscape
- 4.7. Current Market Potential and Opportunity Assessment (TAM–SAM–SOM Framework)
- 4.8. IMR Analyst Note
- 4.1. Porters Five Forces
- 5. Market Analysis, Insights and Forecast 2021-2033
- 5.1. Market Analysis, Insights and Forecast - by Application
- 5.1.1. Public Railway
- 5.1.2. Industrial Railway
- 5.2. Market Analysis, Insights and Forecast - by Types
- 5.2.1. Single Coupled
- 5.2.2. Double Coupled
- 5.3. Market Analysis, Insights and Forecast - by Region
- 5.3.1. North America
- 5.3.2. South America
- 5.3.3. Europe
- 5.3.4. Middle East & Africa
- 5.3.5. Asia Pacific
- 5.1. Market Analysis, Insights and Forecast - by Application
- 6. Global Engine-driven Railcar Movers Analysis, Insights and Forecast, 2021-2033
- 6.1. Market Analysis, Insights and Forecast - by Application
- 6.1.1. Public Railway
- 6.1.2. Industrial Railway
- 6.2. Market Analysis, Insights and Forecast - by Types
- 6.2.1. Single Coupled
- 6.2.2. Double Coupled
- 6.1. Market Analysis, Insights and Forecast - by Application
- 7. North America Engine-driven Railcar Movers Analysis, Insights and Forecast, 2020-2032
- 7.1. Market Analysis, Insights and Forecast - by Application
- 7.1.1. Public Railway
- 7.1.2. Industrial Railway
- 7.2. Market Analysis, Insights and Forecast - by Types
- 7.2.1. Single Coupled
- 7.2.2. Double Coupled
- 7.1. Market Analysis, Insights and Forecast - by Application
- 8. South America Engine-driven Railcar Movers Analysis, Insights and Forecast, 2020-2032
- 8.1. Market Analysis, Insights and Forecast - by Application
- 8.1.1. Public Railway
- 8.1.2. Industrial Railway
- 8.2. Market Analysis, Insights and Forecast - by Types
- 8.2.1. Single Coupled
- 8.2.2. Double Coupled
- 8.1. Market Analysis, Insights and Forecast - by Application
- 9. Europe Engine-driven Railcar Movers Analysis, Insights and Forecast, 2020-2032
- 9.1. Market Analysis, Insights and Forecast - by Application
- 9.1.1. Public Railway
- 9.1.2. Industrial Railway
- 9.2. Market Analysis, Insights and Forecast - by Types
- 9.2.1. Single Coupled
- 9.2.2. Double Coupled
- 9.1. Market Analysis, Insights and Forecast - by Application
- 10. Middle East & Africa Engine-driven Railcar Movers Analysis, Insights and Forecast, 2020-2032
- 10.1. Market Analysis, Insights and Forecast - by Application
- 10.1.1. Public Railway
- 10.1.2. Industrial Railway
- 10.2. Market Analysis, Insights and Forecast - by Types
- 10.2.1. Single Coupled
- 10.2.2. Double Coupled
- 10.1. Market Analysis, Insights and Forecast - by Application
- 11. Asia Pacific Engine-driven Railcar Movers Analysis, Insights and Forecast, 2020-2032
- 11.1. Market Analysis, Insights and Forecast - by Application
- 11.1.1. Public Railway
- 11.1.2. Industrial Railway
- 11.2. Market Analysis, Insights and Forecast - by Types
- 11.2.1. Single Coupled
- 11.2.2. Double Coupled
- 11.1. Market Analysis, Insights and Forecast - by Application
- 12. Competitive Analysis
- 12.1. Company Profiles
- 12.1.1 Global Railcar Mover Group
- 12.1.1.1. Company Overview
- 12.1.1.2. Products
- 12.1.1.3. Company Financials
- 12.1.1.4. SWOT Analysis
- 12.1.2 CRRC
- 12.1.2.1. Company Overview
- 12.1.2.2. Products
- 12.1.2.3. Company Financials
- 12.1.2.4. SWOT Analysis
- 12.1.3 Shuttlewagon/Nordco
- 12.1.3.1. Company Overview
- 12.1.3.2. Products
- 12.1.3.3. Company Financials
- 12.1.3.4. SWOT Analysis
- 12.1.4 Rail King/Kirby
- 12.1.4.1. Company Overview
- 12.1.4.2. Products
- 12.1.4.3. Company Financials
- 12.1.4.4. SWOT Analysis
- 12.1.5 Drapeau
- 12.1.5.1. Company Overview
- 12.1.5.2. Products
- 12.1.5.3. Company Financials
- 12.1.5.4. SWOT Analysis
- 12.1.6 Colmar Technik
- 12.1.6.1. Company Overview
- 12.1.6.2. Products
- 12.1.6.3. Company Financials
- 12.1.6.4. SWOT Analysis
- 12.1.7 Unilokomotive
- 12.1.7.1. Company Overview
- 12.1.7.2. Products
- 12.1.7.3. Company Financials
- 12.1.7.4. SWOT Analysis
- 12.1.8 BOSS RCM
- 12.1.8.1. Company Overview
- 12.1.8.2. Products
- 12.1.8.3. Company Financials
- 12.1.8.4. SWOT Analysis
- 12.1.9 Brandt Group
- 12.1.9.1. Company Overview
- 12.1.9.2. Products
- 12.1.9.3. Company Financials
- 12.1.9.4. SWOT Analysis
- 12.1.10 Dongda Power
- 12.1.10.1. Company Overview
- 12.1.10.2. Products
- 12.1.10.3. Company Financials
- 12.1.10.4. SWOT Analysis
- 12.1.11 G. Zwiehoff
- 12.1.11.1. Company Overview
- 12.1.11.2. Products
- 12.1.11.3. Company Financials
- 12.1.11.4. SWOT Analysis
- 12.1.12 UROMAC SYSTEMS
- 12.1.12.1. Company Overview
- 12.1.12.2. Products
- 12.1.12.3. Company Financials
- 12.1.12.4. SWOT Analysis
- 12.1.13 Tietong
- 12.1.13.1. Company Overview
- 12.1.13.2. Products
- 12.1.13.3. Company Financials
- 12.1.13.4. SWOT Analysis
- 12.1.1 Global Railcar Mover Group
- 12.2. Market Entropy
- 12.2.1 Company's Key Areas Served
- 12.2.2 Recent Developments
- 12.3. Company Market Share Analysis 2025
- 12.3.1 Top 5 Companies Market Share Analysis
- 12.3.2 Top 3 Companies Market Share Analysis
- 12.4. List of Potential Customers
- 13. Research Methodology
List of Figures
- Figure 1: Global Engine-driven Railcar Movers Revenue Breakdown (billion, %) by Region 2025 & 2033
- Figure 2: North America Engine-driven Railcar Movers Revenue (billion), by Application 2025 & 2033
- Figure 3: North America Engine-driven Railcar Movers Revenue Share (%), by Application 2025 & 2033
- Figure 4: North America Engine-driven Railcar Movers Revenue (billion), by Types 2025 & 2033
- Figure 5: North America Engine-driven Railcar Movers Revenue Share (%), by Types 2025 & 2033
- Figure 6: North America Engine-driven Railcar Movers Revenue (billion), by Country 2025 & 2033
- Figure 7: North America Engine-driven Railcar Movers Revenue Share (%), by Country 2025 & 2033
- Figure 8: South America Engine-driven Railcar Movers Revenue (billion), by Application 2025 & 2033
- Figure 9: South America Engine-driven Railcar Movers Revenue Share (%), by Application 2025 & 2033
- Figure 10: South America Engine-driven Railcar Movers Revenue (billion), by Types 2025 & 2033
- Figure 11: South America Engine-driven Railcar Movers Revenue Share (%), by Types 2025 & 2033
- Figure 12: South America Engine-driven Railcar Movers Revenue (billion), by Country 2025 & 2033
- Figure 13: South America Engine-driven Railcar Movers Revenue Share (%), by Country 2025 & 2033
- Figure 14: Europe Engine-driven Railcar Movers Revenue (billion), by Application 2025 & 2033
- Figure 15: Europe Engine-driven Railcar Movers Revenue Share (%), by Application 2025 & 2033
- Figure 16: Europe Engine-driven Railcar Movers Revenue (billion), by Types 2025 & 2033
- Figure 17: Europe Engine-driven Railcar Movers Revenue Share (%), by Types 2025 & 2033
- Figure 18: Europe Engine-driven Railcar Movers Revenue (billion), by Country 2025 & 2033
- Figure 19: Europe Engine-driven Railcar Movers Revenue Share (%), by Country 2025 & 2033
- Figure 20: Middle East & Africa Engine-driven Railcar Movers Revenue (billion), by Application 2025 & 2033
- Figure 21: Middle East & Africa Engine-driven Railcar Movers Revenue Share (%), by Application 2025 & 2033
- Figure 22: Middle East & Africa Engine-driven Railcar Movers Revenue (billion), by Types 2025 & 2033
- Figure 23: Middle East & Africa Engine-driven Railcar Movers Revenue Share (%), by Types 2025 & 2033
- Figure 24: Middle East & Africa Engine-driven Railcar Movers Revenue (billion), by Country 2025 & 2033
- Figure 25: Middle East & Africa Engine-driven Railcar Movers Revenue Share (%), by Country 2025 & 2033
- Figure 26: Asia Pacific Engine-driven Railcar Movers Revenue (billion), by Application 2025 & 2033
- Figure 27: Asia Pacific Engine-driven Railcar Movers Revenue Share (%), by Application 2025 & 2033
- Figure 28: Asia Pacific Engine-driven Railcar Movers Revenue (billion), by Types 2025 & 2033
- Figure 29: Asia Pacific Engine-driven Railcar Movers Revenue Share (%), by Types 2025 & 2033
- Figure 30: Asia Pacific Engine-driven Railcar Movers Revenue (billion), by Country 2025 & 2033
- Figure 31: Asia Pacific Engine-driven Railcar Movers Revenue Share (%), by Country 2025 & 2033
List of Tables
- Table 1: Global Engine-driven Railcar Movers Revenue billion Forecast, by Application 2020 & 2033
- Table 2: Global Engine-driven Railcar Movers Revenue billion Forecast, by Types 2020 & 2033
- Table 3: Global Engine-driven Railcar Movers Revenue billion Forecast, by Region 2020 & 2033
- Table 4: Global Engine-driven Railcar Movers Revenue billion Forecast, by Application 2020 & 2033
- Table 5: Global Engine-driven Railcar Movers Revenue billion Forecast, by Types 2020 & 2033
- Table 6: Global Engine-driven Railcar Movers Revenue billion Forecast, by Country 2020 & 2033
- Table 7: United States Engine-driven Railcar Movers Revenue (billion) Forecast, by Application 2020 & 2033
- Table 8: Canada Engine-driven Railcar Movers Revenue (billion) Forecast, by Application 2020 & 2033
- Table 9: Mexico Engine-driven Railcar Movers Revenue (billion) Forecast, by Application 2020 & 2033
- Table 10: Global Engine-driven Railcar Movers Revenue billion Forecast, by Application 2020 & 2033
- Table 11: Global Engine-driven Railcar Movers Revenue billion Forecast, by Types 2020 & 2033
- Table 12: Global Engine-driven Railcar Movers Revenue billion Forecast, by Country 2020 & 2033
- Table 13: Brazil Engine-driven Railcar Movers Revenue (billion) Forecast, by Application 2020 & 2033
- Table 14: Argentina Engine-driven Railcar Movers Revenue (billion) Forecast, by Application 2020 & 2033
- Table 15: Rest of South America Engine-driven Railcar Movers Revenue (billion) Forecast, by Application 2020 & 2033
- Table 16: Global Engine-driven Railcar Movers Revenue billion Forecast, by Application 2020 & 2033
- Table 17: Global Engine-driven Railcar Movers Revenue billion Forecast, by Types 2020 & 2033
- Table 18: Global Engine-driven Railcar Movers Revenue billion Forecast, by Country 2020 & 2033
- Table 19: United Kingdom Engine-driven Railcar Movers Revenue (billion) Forecast, by Application 2020 & 2033
- Table 20: Germany Engine-driven Railcar Movers Revenue (billion) Forecast, by Application 2020 & 2033
- Table 21: France Engine-driven Railcar Movers Revenue (billion) Forecast, by Application 2020 & 2033
- Table 22: Italy Engine-driven Railcar Movers Revenue (billion) Forecast, by Application 2020 & 2033
- Table 23: Spain Engine-driven Railcar Movers Revenue (billion) Forecast, by Application 2020 & 2033
- Table 24: Russia Engine-driven Railcar Movers Revenue (billion) Forecast, by Application 2020 & 2033
- Table 25: Benelux Engine-driven Railcar Movers Revenue (billion) Forecast, by Application 2020 & 2033
- Table 26: Nordics Engine-driven Railcar Movers Revenue (billion) Forecast, by Application 2020 & 2033
- Table 27: Rest of Europe Engine-driven Railcar Movers Revenue (billion) Forecast, by Application 2020 & 2033
- Table 28: Global Engine-driven Railcar Movers Revenue billion Forecast, by Application 2020 & 2033
- Table 29: Global Engine-driven Railcar Movers Revenue billion Forecast, by Types 2020 & 2033
- Table 30: Global Engine-driven Railcar Movers Revenue billion Forecast, by Country 2020 & 2033
- Table 31: Turkey Engine-driven Railcar Movers Revenue (billion) Forecast, by Application 2020 & 2033
- Table 32: Israel Engine-driven Railcar Movers Revenue (billion) Forecast, by Application 2020 & 2033
- Table 33: GCC Engine-driven Railcar Movers Revenue (billion) Forecast, by Application 2020 & 2033
- Table 34: North Africa Engine-driven Railcar Movers Revenue (billion) Forecast, by Application 2020 & 2033
- Table 35: South Africa Engine-driven Railcar Movers Revenue (billion) Forecast, by Application 2020 & 2033
- Table 36: Rest of Middle East & Africa Engine-driven Railcar Movers Revenue (billion) Forecast, by Application 2020 & 2033
- Table 37: Global Engine-driven Railcar Movers Revenue billion Forecast, by Application 2020 & 2033
- Table 38: Global Engine-driven Railcar Movers Revenue billion Forecast, by Types 2020 & 2033
- Table 39: Global Engine-driven Railcar Movers Revenue billion Forecast, by Country 2020 & 2033
- Table 40: China Engine-driven Railcar Movers Revenue (billion) Forecast, by Application 2020 & 2033
- Table 41: India Engine-driven Railcar Movers Revenue (billion) Forecast, by Application 2020 & 2033
- Table 42: Japan Engine-driven Railcar Movers Revenue (billion) Forecast, by Application 2020 & 2033
- Table 43: South Korea Engine-driven Railcar Movers Revenue (billion) Forecast, by Application 2020 & 2033
- Table 44: ASEAN Engine-driven Railcar Movers Revenue (billion) Forecast, by Application 2020 & 2033
- Table 45: Oceania Engine-driven Railcar Movers Revenue (billion) Forecast, by Application 2020 & 2033
- Table 46: Rest of Asia Pacific Engine-driven Railcar Movers Revenue (billion) Forecast, by Application 2020 & 2033
Frequently Asked Questions
1. What is the projected Compound Annual Growth Rate (CAGR) of the Engine-driven Railcar Movers?
The projected CAGR is approximately 12.31%.
2. Which companies are prominent players in the Engine-driven Railcar Movers?
Key companies in the market include Global Railcar Mover Group, CRRC, Shuttlewagon/Nordco, Rail King/Kirby, Drapeau, Colmar Technik, Unilokomotive, BOSS RCM, Brandt Group, Dongda Power, G. Zwiehoff, UROMAC SYSTEMS, Tietong.
3. What are the main segments of the Engine-driven Railcar Movers?
The market segments include Application, Types.
4. Can you provide details about the market size?
The market size is estimated to be USD 10.3 billion as of 2022.
5. What are some drivers contributing to market growth?
N/A
6. What are the notable trends driving market growth?
N/A
7. Are there any restraints impacting market growth?
N/A
8. Can you provide examples of recent developments in the market?
N/A
9. What pricing options are available for accessing the report?
Pricing options include single-user, multi-user, and enterprise licenses priced at USD 2900.00, USD 4350.00, and USD 5800.00 respectively.
10. Is the market size provided in terms of value or volume?
The market size is provided in terms of value, measured in billion.
11. Are there any specific market keywords associated with the report?
Yes, the market keyword associated with the report is "Engine-driven Railcar Movers," which aids in identifying and referencing the specific market segment covered.
12. How do I determine which pricing option suits my needs best?
The pricing options vary based on user requirements and access needs. Individual users may opt for single-user licenses, while businesses requiring broader access may choose multi-user or enterprise licenses for cost-effective access to the report.
13. Are there any additional resources or data provided in the Engine-driven Railcar Movers report?
While the report offers comprehensive insights, it's advisable to review the specific contents or supplementary materials provided to ascertain if additional resources or data are available.
14. How can I stay updated on further developments or reports in the Engine-driven Railcar Movers?
To stay informed about further developments, trends, and reports in the Engine-driven Railcar Movers, consider subscribing to industry newsletters, following relevant companies and organizations, or regularly checking reputable industry news sources and publications.
Methodology
Step 1 - Identification of Relevant Samples Size from Population Database


Step 2 - Approaches for Defining Global Market Size (Value, Volume* & Price*)

Note*: In applicable scenarios
Step 3 - Data Sources
Primary Research
- Web Analytics
- Survey Reports
- Research Institute
- Latest Research Reports
- Opinion Leaders
Secondary Research
- Annual Reports
- White Paper
- Latest Press Release
- Industry Association
- Paid Database
- Investor Presentations

Step 4 - Data Triangulation
Involves using different sources of information in order to increase the validity of a study
These sources are likely to be stakeholders in a program - participants, other researchers, program staff, other community members, and so on.
Then we put all data in single framework & apply various statistical tools to find out the dynamic on the market.
During the analysis stage, feedback from the stakeholder groups would be compared to determine areas of agreement as well as areas of divergence