

Key Insights
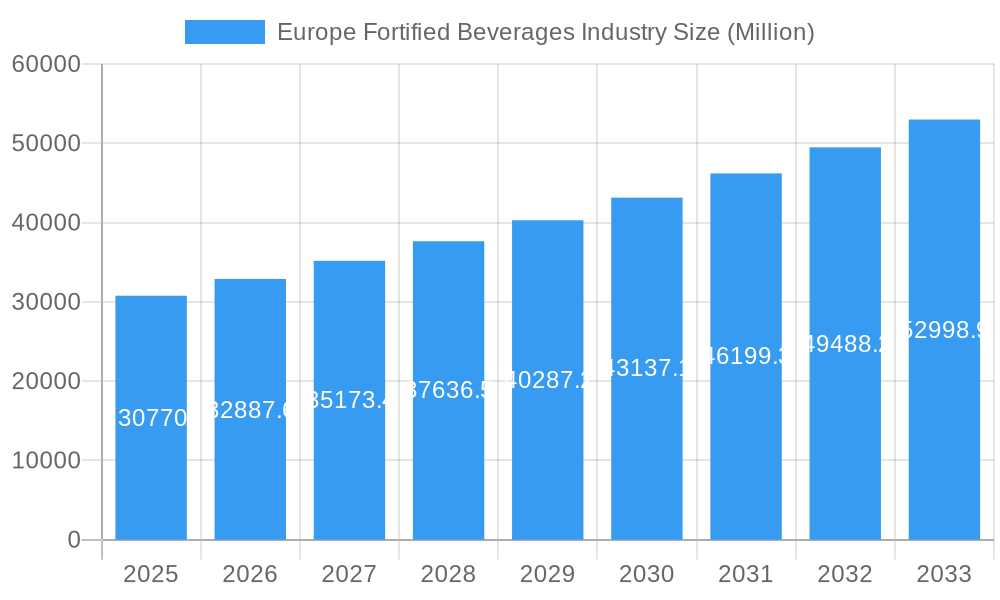
The European fortified beverages market, valued at €30.77 billion in 2025, is projected to experience robust growth, driven by a rising health-conscious consumer base seeking functional beverages. A compound annual growth rate (CAGR) of 6.78% is anticipated from 2025 to 2033, indicating a significant market expansion. Key drivers include increasing awareness of the benefits of vitamin and mineral fortification, coupled with a growing preference for convenient and nutritious options. The market is segmented by beverage type (energy drinks, sports drinks, fortified juices, dairy and dairy alternatives, and others), and distribution channels (supermarkets/hypermarkets, health stores, convenience stores, online retail stores, and others). Germany, the United Kingdom, France, Italy, and Spain represent the largest national markets within Europe, reflecting higher consumer spending and established distribution networks. Competition is fierce, with major players like Nestlé SA, PepsiCo Inc., Red Bull GmbH, and The Coca-Cola Company vying for market share through product innovation, brand building, and strategic partnerships. Growth is further fueled by evolving consumer trends, including increasing demand for natural and organic fortified beverages and a growing preference for personalized nutrition. However, challenges remain, including fluctuating raw material prices and stringent regulations concerning fortification claims and health benefits.
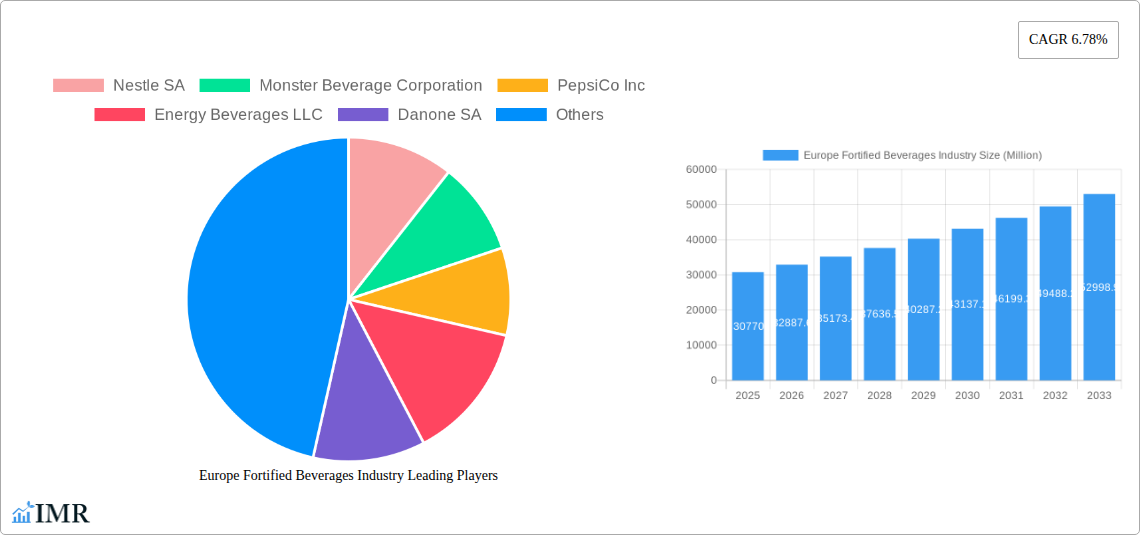
Europe Fortified Beverages Industry Market Size (In Billion)
The significant growth trajectory is underpinned by several factors. The increasing prevalence of health-conscious lifestyles and the growing demand for functional foods and beverages contribute substantially to the market’s expansion. Furthermore, the proliferation of online retail channels provides increased accessibility and convenience for consumers, boosting sales. Product diversification within the fortified beverage category – including innovative flavors, formats, and functional benefits – continues to attract new customer segments and drive sales. The anticipated growth rate will likely be influenced by economic conditions across Europe, with stronger growth anticipated in markets experiencing robust economic performance. However, the market’s overall growth forecast remains positive, reflecting the enduring consumer demand for convenient, healthy, and functional beverages.
Europe Fortified Beverages Industry Company Market Share
Europe Fortified Beverages Industry: A Comprehensive Market Report (2019-2033)
This comprehensive report provides an in-depth analysis of the European fortified beverages market, offering valuable insights for industry professionals, investors, and strategic decision-makers. The study covers the period from 2019 to 2033, with 2025 serving as the base and estimated year. The report meticulously examines market dynamics, growth trends, regional dominance, product landscape, key challenges and opportunities, and the role of leading players. The total market size is projected to reach xx Million units by 2033, presenting significant growth opportunities across various segments.
Europe Fortified Beverages Industry Market Dynamics & Structure
This section analyzes the competitive landscape, technological advancements, regulatory environment, and market trends within the European fortified beverages industry. We delve into market concentration, identifying key players and their market shares. The report also examines the impact of M&A activities, technological innovations (e.g., functional ingredients, sustainable packaging), and evolving consumer preferences on market structure. Regulatory frameworks and their influence on product development and market access are also explored. Furthermore, the report considers the impact of substitute products and the demographics of end-users on market dynamics.
- Market Concentration: The European fortified beverage market exhibits a moderately concentrated structure, with key players like Nestle SA, PepsiCo Inc., and Red Bull GmbH holding significant market share (xx%). However, smaller niche players and private labels also contribute significantly.
- Technological Innovation: Advancements in functional ingredients, natural sweeteners, and sustainable packaging are driving innovation. However, regulatory hurdles and high R&D costs present barriers.
- Regulatory Framework: EU regulations regarding food labeling, health claims, and additives significantly impact product formulation and marketing.
- Competitive Substitutes: Other beverage categories, including plain water, juices, and soft drinks, pose competition.
- M&A Activity: The past five years have witnessed xx M&A deals, primarily focused on expanding product portfolios and geographic reach.
- End-User Demographics: The market is driven by health-conscious consumers seeking functional benefits, convenience, and diverse flavors.
Europe Fortified Beverages Industry Growth Trends & Insights
This section details the historical and projected growth of the European fortified beverages market. We use comprehensive data analysis (XXX) to trace market size evolution, adoption rates across various segments, and analyze the impact of technological disruptions and shifting consumer behavior. The report provides detailed CAGR projections and penetration rates for different product types and distribution channels.
(600-word analysis focusing on market size evolution, adoption rates, technological disruptions, and consumer behavior shifts. Include specific metrics (e.g., CAGR, market penetration) for deeper insights. This section would contain detailed paragraphs and would incorporate specific data.)
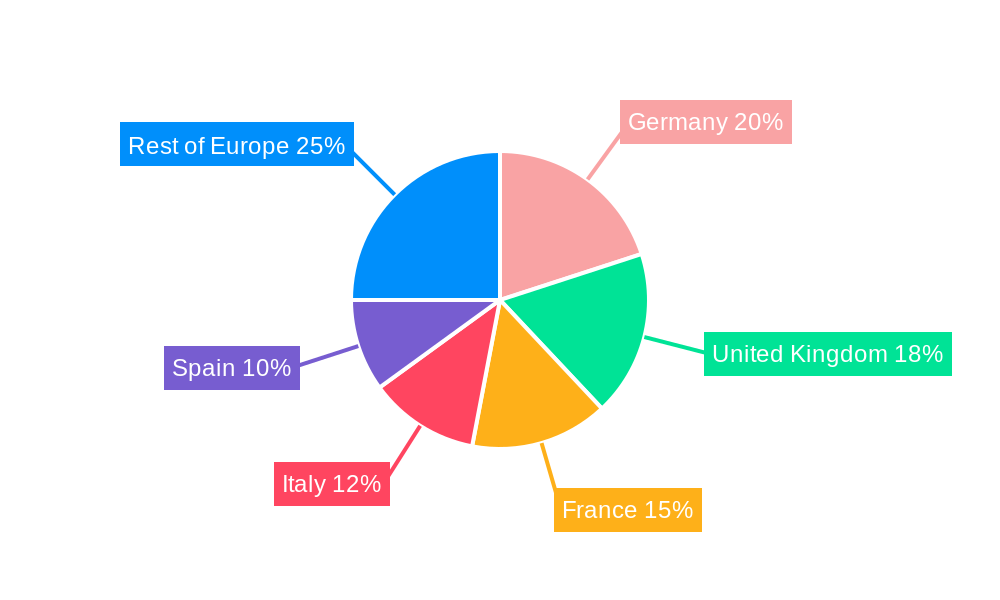
Dominant Regions, Countries, or Segments in Europe Fortified Beverages Industry
This section pinpoints the leading regions, countries, and segments (by type and distribution channel) driving market growth in Europe. We analyze the factors contributing to their dominance, including market size, growth rate, economic conditions, and consumer preferences. The analysis will highlight key market drivers for each region/segment.
- Leading Region: Germany and the UK currently lead the market due to high consumer spending and established distribution networks.
- Leading Country (by Type): Germany dominates the Energy Drink segment, while the UK leads in Sports Drinks.
- Leading Segment (by Distribution): Supermarkets/Hypermarkets hold the largest market share, but online retail is experiencing rapid growth. (Detailed 600-word analysis with bullet points highlighting key drivers and paragraphs analyzing dominance factors, including market share and growth potential for each region/country/segment.)
Europe Fortified Beverages Industry Product Landscape
This section describes the current product landscape, highlighting key product innovations, applications, and performance metrics. We analyze unique selling propositions (USPs) and technological advancements driving product differentiation. The focus will be on functional benefits, ingredient innovation, and packaging advancements.
(100-150-word paragraph detailing product innovations, applications, and performance metrics. Highlight unique selling propositions and technological advancements.)
Key Drivers, Barriers & Challenges in Europe Fortified Beverages Industry
This section outlines the key drivers and challenges shaping the European fortified beverages market.
Key Drivers:
- Increasing health consciousness among consumers.
- Growing demand for convenient and functional beverages.
- Expansion of online retail channels.
- Technological advancements leading to product innovation.
Challenges & Restraints:
- Stringent regulatory requirements regarding health claims and ingredients.
- Intense competition from established beverage companies.
- Fluctuating raw material prices.
- Growing concerns about added sugar and artificial ingredients.
(150 words for each – drivers and challenges – using paragraphs or lists. Address supply chain issues, regulatory hurdles, and competitive pressures with quantifiable impacts where possible.)
Emerging Opportunities in Europe Fortified Beverages Industry
This section highlights emerging trends and opportunities, focusing on untapped market segments, innovative applications, and evolving consumer preferences.
- Growing demand for plant-based and organic fortified beverages.
- Increasing focus on personalized nutrition and functional benefits.
- Expansion into emerging markets within Europe.
- Development of new product formats and packaging solutions.
(150 words using paragraphs or lists.)
Growth Accelerators in the Europe Fortified Beverages Industry Industry
This section discusses the catalysts for long-term growth, emphasizing technological breakthroughs, strategic partnerships, and market expansion strategies.
(150-word paragraph emphasizing technological breakthroughs, strategic partnerships, or market expansion strategies. )
Key Players Shaping the Europe Fortified Beverages Industry Market
- Nestle SA
- Monster Beverage Corporation
- PepsiCo Inc
- Energy Beverages LLC
- Danone SA
- Keurig Dr Pepper Inc
- Red Bull GmbH
- Rockstar Inc
- The Coca-Cola Company
- Fonterra Co-operative Group
Notable Milestones in Europe Fortified Beverages Industry Sector
(This section requires specific data on notable developments with year/month and their impact on market dynamics. Replace this placeholder with specific examples.)
In-Depth Europe Fortified Beverages Industry Market Outlook
The European fortified beverages market presents significant growth potential driven by increasing health consciousness, innovation, and expanding distribution channels. Strategic opportunities exist in developing innovative products, targeting niche segments, and leveraging technological advancements. The market is poised for continued expansion, presenting attractive prospects for established players and new entrants alike.
(150-word paragraph summarizing growth accelerators, focusing on future market potential and strategic opportunities.)
Europe Fortified Beverages Industry Segmentation
-
1. Type
- 1.1. Energy Drinks
- 1.2. Sports Drinks
- 1.3. Fortified Juice
- 1.4. Dairy and Dairy Alternative Drinks
- 1.5. Other Types
-
2. Distribution Channel
- 2.1. Supermarkets/Hypermarkets
- 2.2. Health Stores
- 2.3. Convenience Stores
- 2.4. Online Retail Stores
- 2.5. Other Distribution Channels
Europe Fortified Beverages Industry Segmentation By Geography
-
1. Europe
- 1.1. United Kingdom
- 1.2. Germany
- 1.3. France
- 1.4. Italy
- 1.5. Spain
- 1.6. Netherlands
- 1.7. Belgium
- 1.8. Sweden
- 1.9. Norway
- 1.10. Poland
- 1.11. Denmark
Europe Fortified Beverages Industry Regional Market Share
Geographic Coverage of Europe Fortified Beverages Industry
Europe Fortified Beverages Industry REPORT HIGHLIGHTS
| Aspects | Details |
|---|---|
| Study Period | 2020-2034 |
| Base Year | 2025 |
| Estimated Year | 2026 |
| Forecast Period | 2026-2034 |
| Historical Period | 2020-2025 |
| Growth Rate | CAGR of 6.78% from 2020-2034 |
| Segmentation |
|
Table of Contents
- 1. Introduction
- 1.1. Research Scope
- 1.2. Market Segmentation
- 1.3. Research Objective
- 1.4. Definitions and Assumptions
- 2. Executive Summary
- 2.1. Market Snapshot
- 3. Market Dynamics
- 3.1. Market Drivers
- 3.2. Market Restrains
- 3.3. Market Trends
- 3.4. Market Opportunities
- 4. Market Factor Analysis
- 4.1. Porters Five Forces
- 4.1.1. Bargaining Power of Suppliers
- 4.1.2. Bargaining Power of Buyers
- 4.1.3. Threat of New Entrants
- 4.1.4. Threat of Substitutes
- 4.1.5. Competitive Rivalry
- 4.2. PESTEL analysis
- 4.3. BCG Analysis
- 4.3.1. Stars (High Growth, High Market Share)
- 4.3.2. Cash Cows (Low Growth, High Market Share)
- 4.3.3. Question Mark (High Growth, Low Market Share)
- 4.3.4. Dogs (Low Growth, Low Market Share)
- 4.4. Ansoff Matrix Analysis
- 4.5. Supply Chain Analysis
- 4.6. Regulatory Landscape
- 4.7. Current Market Potential and Opportunity Assessment (TAM–SAM–SOM Framework)
- 4.8. IMR Analyst Note
- 4.1. Porters Five Forces
- 5. Market Analysis, Insights and Forecast 2021-2033
- 5.1. Market Analysis, Insights and Forecast - by Type
- 5.1.1. Energy Drinks
- 5.1.2. Sports Drinks
- 5.1.3. Fortified Juice
- 5.1.4. Dairy and Dairy Alternative Drinks
- 5.1.5. Other Types
- 5.2. Market Analysis, Insights and Forecast - by Distribution Channel
- 5.2.1. Supermarkets/Hypermarkets
- 5.2.2. Health Stores
- 5.2.3. Convenience Stores
- 5.2.4. Online Retail Stores
- 5.2.5. Other Distribution Channels
- 5.3. Market Analysis, Insights and Forecast - by Region
- 5.3.1. Europe
- 5.1. Market Analysis, Insights and Forecast - by Type
- 6. Europe Fortified Beverages Industry Analysis, Insights and Forecast, 2021-2033
- 6.1. Market Analysis, Insights and Forecast - by Type
- 6.1.1. Energy Drinks
- 6.1.2. Sports Drinks
- 6.1.3. Fortified Juice
- 6.1.4. Dairy and Dairy Alternative Drinks
- 6.1.5. Other Types
- 6.2. Market Analysis, Insights and Forecast - by Distribution Channel
- 6.2.1. Supermarkets/Hypermarkets
- 6.2.2. Health Stores
- 6.2.3. Convenience Stores
- 6.2.4. Online Retail Stores
- 6.2.5. Other Distribution Channels
- 6.1. Market Analysis, Insights and Forecast - by Type
- 7. Competitive Analysis
- 7.1. Company Profiles
- 7.1.1 Nestle SA
- 7.1.1.1. Company Overview
- 7.1.1.2. Products
- 7.1.1.3. Company Financials
- 7.1.1.4. SWOT Analysis
- 7.1.2 Monster Beverage Corporation
- 7.1.2.1. Company Overview
- 7.1.2.2. Products
- 7.1.2.3. Company Financials
- 7.1.2.4. SWOT Analysis
- 7.1.3 PepsiCo Inc
- 7.1.3.1. Company Overview
- 7.1.3.2. Products
- 7.1.3.3. Company Financials
- 7.1.3.4. SWOT Analysis
- 7.1.4 Energy Beverages LLC
- 7.1.4.1. Company Overview
- 7.1.4.2. Products
- 7.1.4.3. Company Financials
- 7.1.4.4. SWOT Analysis
- 7.1.5 Danone SA
- 7.1.5.1. Company Overview
- 7.1.5.2. Products
- 7.1.5.3. Company Financials
- 7.1.5.4. SWOT Analysis
- 7.1.6 Keurig Dr Pepper Inc
- 7.1.6.1. Company Overview
- 7.1.6.2. Products
- 7.1.6.3. Company Financials
- 7.1.6.4. SWOT Analysis
- 7.1.7 Red Bull GmbH
- 7.1.7.1. Company Overview
- 7.1.7.2. Products
- 7.1.7.3. Company Financials
- 7.1.7.4. SWOT Analysis
- 7.1.8 Rockstar Inc *List Not Exhaustive
- 7.1.8.1. Company Overview
- 7.1.8.2. Products
- 7.1.8.3. Company Financials
- 7.1.8.4. SWOT Analysis
- 7.1.9 The Coca-Cola Company
- 7.1.9.1. Company Overview
- 7.1.9.2. Products
- 7.1.9.3. Company Financials
- 7.1.9.4. SWOT Analysis
- 7.1.10 Fonterra Co-operative Group
- 7.1.10.1. Company Overview
- 7.1.10.2. Products
- 7.1.10.3. Company Financials
- 7.1.10.4. SWOT Analysis
- 7.1.1 Nestle SA
- 7.2. Market Entropy
- 7.2.1 Company's Key Areas Served
- 7.2.2 Recent Developments
- 7.3. Company Market Share Analysis 2025
- 7.3.1 Top 5 Companies Market Share Analysis
- 7.3.2 Top 3 Companies Market Share Analysis
- 7.4. List of Potential Customers
- 8. Research Methodology
List of Figures
- Figure 1: Europe Fortified Beverages Industry Revenue Breakdown (Million, %) by Product 2025 & 2033
- Figure 2: Europe Fortified Beverages Industry Share (%) by Company 2025
List of Tables
- Table 1: Europe Fortified Beverages Industry Revenue Million Forecast, by Type 2020 & 2033
- Table 2: Europe Fortified Beverages Industry Revenue Million Forecast, by Distribution Channel 2020 & 2033
- Table 3: Europe Fortified Beverages Industry Revenue Million Forecast, by Region 2020 & 2033
- Table 4: Europe Fortified Beverages Industry Revenue Million Forecast, by Type 2020 & 2033
- Table 5: Europe Fortified Beverages Industry Revenue Million Forecast, by Distribution Channel 2020 & 2033
- Table 6: Europe Fortified Beverages Industry Revenue Million Forecast, by Country 2020 & 2033
- Table 7: United Kingdom Europe Fortified Beverages Industry Revenue (Million) Forecast, by Application 2020 & 2033
- Table 8: Germany Europe Fortified Beverages Industry Revenue (Million) Forecast, by Application 2020 & 2033
- Table 9: France Europe Fortified Beverages Industry Revenue (Million) Forecast, by Application 2020 & 2033
- Table 10: Italy Europe Fortified Beverages Industry Revenue (Million) Forecast, by Application 2020 & 2033
- Table 11: Spain Europe Fortified Beverages Industry Revenue (Million) Forecast, by Application 2020 & 2033
- Table 12: Netherlands Europe Fortified Beverages Industry Revenue (Million) Forecast, by Application 2020 & 2033
- Table 13: Belgium Europe Fortified Beverages Industry Revenue (Million) Forecast, by Application 2020 & 2033
- Table 14: Sweden Europe Fortified Beverages Industry Revenue (Million) Forecast, by Application 2020 & 2033
- Table 15: Norway Europe Fortified Beverages Industry Revenue (Million) Forecast, by Application 2020 & 2033
- Table 16: Poland Europe Fortified Beverages Industry Revenue (Million) Forecast, by Application 2020 & 2033
- Table 17: Denmark Europe Fortified Beverages Industry Revenue (Million) Forecast, by Application 2020 & 2033
Frequently Asked Questions
1. What is the projected Compound Annual Growth Rate (CAGR) of the Europe Fortified Beverages Industry?
The projected CAGR is approximately 6.78%.
2. Which companies are prominent players in the Europe Fortified Beverages Industry?
Key companies in the market include Nestle SA, Monster Beverage Corporation, PepsiCo Inc, Energy Beverages LLC, Danone SA, Keurig Dr Pepper Inc, Red Bull GmbH, Rockstar Inc *List Not Exhaustive, The Coca-Cola Company, Fonterra Co-operative Group.
3. What are the main segments of the Europe Fortified Beverages Industry?
The market segments include Type, Distribution Channel.
4. Can you provide details about the market size?
The market size is estimated to be USD 30.77 Million as of 2022.
5. What are some drivers contributing to market growth?
Growing Consumer Inclination Toward Low-sugar/Sugar-free Beverages; Expenditure on Advertisement and Promotional Activities.
6. What are the notable trends driving market growth?
Flavor Innovations Leading to Market Growth.
7. Are there any restraints impacting market growth?
Concerns Over Health Issues Associated with Functional Beverages.
8. Can you provide examples of recent developments in the market?
N/A
9. What pricing options are available for accessing the report?
Pricing options include single-user, multi-user, and enterprise licenses priced at USD 4750, USD 4950, and USD 6800 respectively.
10. Is the market size provided in terms of value or volume?
The market size is provided in terms of value, measured in Million.
11. Are there any specific market keywords associated with the report?
Yes, the market keyword associated with the report is "Europe Fortified Beverages Industry," which aids in identifying and referencing the specific market segment covered.
12. How do I determine which pricing option suits my needs best?
The pricing options vary based on user requirements and access needs. Individual users may opt for single-user licenses, while businesses requiring broader access may choose multi-user or enterprise licenses for cost-effective access to the report.
13. Are there any additional resources or data provided in the Europe Fortified Beverages Industry report?
While the report offers comprehensive insights, it's advisable to review the specific contents or supplementary materials provided to ascertain if additional resources or data are available.
14. How can I stay updated on further developments or reports in the Europe Fortified Beverages Industry?
To stay informed about further developments, trends, and reports in the Europe Fortified Beverages Industry, consider subscribing to industry newsletters, following relevant companies and organizations, or regularly checking reputable industry news sources and publications.
Methodology
Step 1 - Identification of Relevant Samples Size from Population Database


Step 2 - Approaches for Defining Global Market Size (Value, Volume* & Price*)

Note*: In applicable scenarios
Step 3 - Data Sources
Primary Research
- Web Analytics
- Survey Reports
- Research Institute
- Latest Research Reports
- Opinion Leaders
Secondary Research
- Annual Reports
- White Paper
- Latest Press Release
- Industry Association
- Paid Database
- Investor Presentations

Step 4 - Data Triangulation
Involves using different sources of information in order to increase the validity of a study
These sources are likely to be stakeholders in a program - participants, other researchers, program staff, other community members, and so on.
Then we put all data in single framework & apply various statistical tools to find out the dynamic on the market.
During the analysis stage, feedback from the stakeholder groups would be compared to determine areas of agreement as well as areas of divergence