

Key Insights
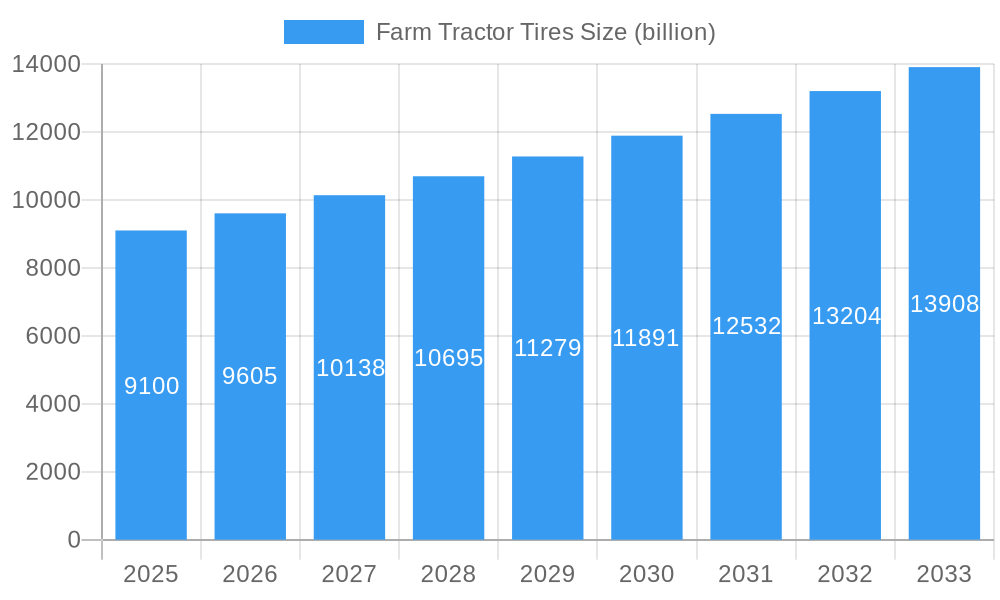
The global Farm Tractor Tires market is poised for significant expansion, projected to reach an estimated $9.1 billion by 2025, exhibiting a robust Compound Annual Growth Rate (CAGR) of 5.5% during the forecast period of 2025-2033. This growth is primarily propelled by the increasing demand for advanced agricultural machinery, driven by the global need to enhance food production and efficiency to feed a growing population. Modern farming practices, characterized by precision agriculture and the adoption of larger, more powerful tractors, necessitate high-performance tires capable of delivering superior traction, durability, and fuel efficiency. The replacement segment is expected to remain a substantial contributor, as farmers prioritize maintaining their existing fleets with reliable tire solutions. Furthermore, the ongoing technological advancements in tire manufacturing, focusing on improved tread patterns, material science, and reinforced sidewalls, are contributing to enhanced product offerings that meet the evolving demands of the agricultural sector.
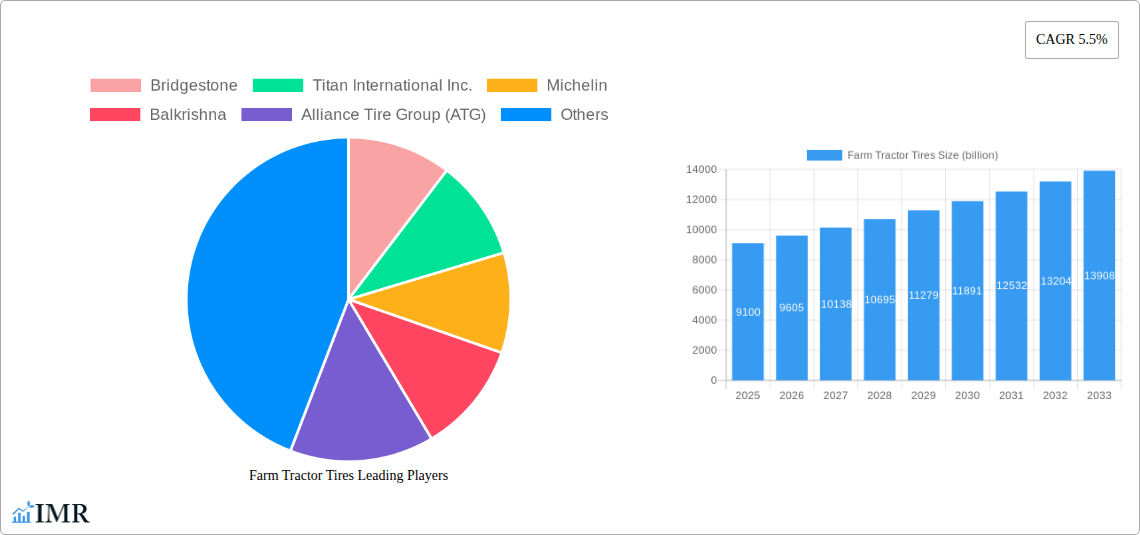
Farm Tractor Tires Market Size (In Billion)
The market dynamics are further shaped by an interplay of growth drivers and restraining factors. Key growth drivers include government initiatives promoting agricultural mechanization and the increasing adoption of radial-ply tires over traditional bias-ply tires, owing to their superior performance characteristics such as reduced soil compaction and enhanced longevity. Emerging economies, particularly in the Asia Pacific region, are presenting significant growth opportunities due to expanding arable land and a rising emphasis on modernizing farming techniques. However, the market also faces challenges such as fluctuating raw material prices, particularly for natural and synthetic rubber, which can impact production costs and ultimately tire pricing. Intense competition among established global players and the presence of regional manufacturers also contribute to market complexities. Despite these restraints, the overarching trend towards sustainable agriculture and the continuous innovation in tire technology are expected to sustain the positive trajectory of the Farm Tractor Tires market.
Farm Tractor Tires Company Market Share
Unlock the future of agricultural mobility with this in-depth analysis of the Global Farm Tractor Tires Market. This report provides a definitive roadmap for industry stakeholders, offering unparalleled insights into market dynamics, growth trajectories, and competitive landscapes. With a meticulous study period spanning 2019–2033 and a base year of 2025, this report delivers actionable intelligence for strategic decision-making, from OEM manufacturers to replacement part distributors and tire innovators. Dive into a comprehensive exploration of parent and child market segments, ensuring you grasp the full spectrum of opportunities and challenges.
Farm Tractor Tires Market Dynamics & Structure
The global farm tractor tires market exhibits a moderately concentrated structure, with key players like Bridgestone, Titan International Inc., Michelin, and Balkrishna holding significant market share. Technological innovation is a primary driver, with continuous advancements in tire tread design, material science (e.g., advanced rubber compounds), and manufacturing processes enhancing durability, fuel efficiency, and soil protection. Regulatory frameworks, particularly those concerning environmental impact and safety standards, are increasingly influencing product development and market entry. Competitive product substitutes, while limited in the core farm tractor tire segment, can include advancements in tractor technology that reduce tire wear or alternative agricultural machinery configurations. End-user demographics are shifting, with a growing demand for advanced tires from larger, technologically adept farming operations alongside the continued need for cost-effective solutions in smaller-scale agriculture. Mergers and acquisitions (M&A) trends are evident as larger players seek to consolidate market position and expand their product portfolios. For instance, recent M&A activity has seen an estimated XX billion units in deal volume over the past five years, aimed at acquiring specialized tire technologies or expanding geographical reach. Barriers to innovation include high R&D costs, stringent testing requirements, and the long product lifecycle of agricultural machinery, necessitating robust and reliable tire solutions.
- Market Concentration: Moderate to high concentration with prominent global manufacturers.
- Technological Innovation: Focus on enhanced durability, fuel efficiency, and reduced soil compaction.
- Regulatory Frameworks: Increasing importance of environmental compliance and safety certifications.
- Competitive Landscape: Driven by established players and niche technology providers.
- End-User Demographics: Evolving needs from large-scale commercial farms to smaller agricultural holdings.
- M&A Trends: Strategic consolidation for market share and technology acquisition, with an estimated XX billion units in deal volume historically.
- Innovation Barriers: High capital investment, rigorous testing, and long product adoption cycles.
Farm Tractor Tires Growth Trends & Insights
The global farm tractor tires market is poised for robust growth, projected to reach an estimated XX billion units by 2033, with a CAGR of XX% during the forecast period (2025–2033). This expansion is underpinned by several critical growth trends and insights. The increasing global population and the subsequent demand for food security are directly driving the need for enhanced agricultural productivity, necessitating modern and efficient farming equipment, including advanced tractor tires. The adoption rate of radial-ply tires, offering superior performance and longevity compared to bias-ply alternatives, is steadily increasing across all farming segments. This shift is further propelled by the growing awareness among farmers of the long-term cost savings associated with these advanced tire technologies, including reduced fuel consumption and minimized soil degradation. Technological disruptions are continuously shaping the market, with innovations in self-inflating tires, intelligent tire monitoring systems, and eco-friendly materials gaining traction. These advancements aim to optimize tire performance in real-time, provide predictive maintenance insights, and reduce the environmental footprint of agricultural operations. Consumer behavior shifts are also playing a significant role. Farmers are increasingly prioritizing tires that offer not just durability but also contribute to operational efficiency, reduced environmental impact, and improved operator comfort. This has led to a greater demand for specialized tires tailored to specific soil types, climatic conditions, and farming practices. The replacement market, driven by the natural wear and tear of existing tires on a large installed base of tractors, continues to be a substantial contributor to market revenue, estimated at XX billion units in 2025. The OEM segment, while influenced by new tractor sales cycles, is also witnessing an upward trend due to the increasing sophistication of new tractor models demanding higher-performance tire solutions. The historical period (2019–2024) laid the groundwork for this growth, with steady increases in tire production and adoption, reflecting the ongoing mechanization of agriculture globally.
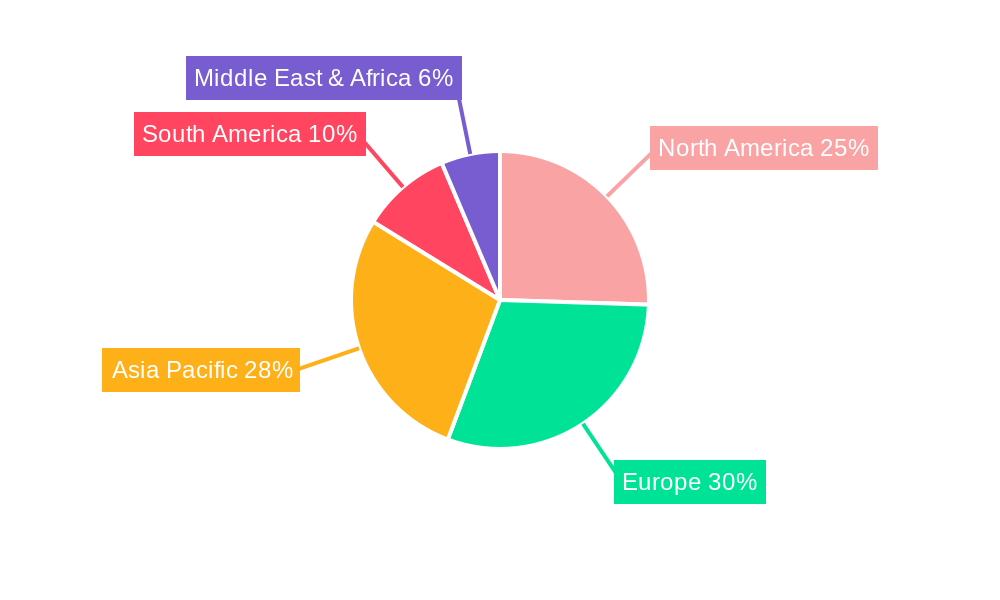
Dominant Regions, Countries, or Segments in Farm Tractor Tires
The Replacement Application segment is identified as a dominant force driving growth in the global farm tractor tires market, projected to account for over XX% of the market share in 2025 and continue its lead through 2033. This dominance stems from the sheer volume of agricultural machinery in operation worldwide, necessitating regular tire replacements due to wear and tear. Key drivers for the replacement segment's growth include the aging tractor fleet in many developed economies and the continuous need for maintaining optimal operational efficiency. Economic policies aimed at supporting agricultural sectors, such as subsidies for farm machinery upgrades and maintenance, further bolster the demand for replacement tires.
North America, particularly the United States, stands out as a dominant country within the farm tractor tires market. This is attributed to its vast agricultural landholdings, highly mechanized farming practices, and the presence of a significant number of large-scale commercial farms. The economic policies in North America often favor agricultural innovation and productivity, directly translating into robust demand for high-performance tractor tires. Infrastructure supporting agricultural logistics and distribution further facilitates the widespread availability and adoption of various tire types. The market share for North America in 2025 is estimated at XX billion units.
From a Types perspective, Radial-ply Tires are increasingly dominating the market over Bias-ply Tires, capturing an estimated XX% of the market share in 2025 and projected to grow at a faster CAGR. Radial tires offer superior benefits such as reduced soil compaction, improved fuel efficiency, enhanced traction, and longer service life, making them the preferred choice for modern, high-horsepower tractors and precision agriculture practices. The shift towards radial-ply tires is a significant trend across all major agricultural regions, driven by both performance advantages and a growing farmer awareness of their long-term economic and environmental benefits.
- Dominant Segment (Application): Replacement Market (XX% market share in 2025).
- Key Drivers: Aging tractor fleets, continuous need for operational efficiency, support for farm machinery maintenance.
- Dominant Region/Country: North America, specifically the United States (XX billion units market share in 2025).
- Drivers: Large agricultural landholdings, advanced mechanization, favorable economic policies, robust logistics.
- Dominant Segment (Type): Radial-ply Tires (XX% market share in 2025).
- Drivers: Superior performance (reduced soil compaction, fuel efficiency, traction), longer lifespan, precision agriculture adoption.
Farm Tractor Tires Product Landscape
The farm tractor tires product landscape is characterized by continuous innovation focused on enhancing performance, durability, and sustainability. Manufacturers are introducing tires with advanced tread patterns optimized for specific soil conditions, offering superior grip and reduced slippage, leading to significant improvements in traction and fuel efficiency. The development of new rubber compounds that resist wear and damage from harsh agricultural environments is a key focus, extending tire lifespan and reducing replacement costs. Unique selling propositions include tires designed for low soil compaction, crucial for preserving soil health and maximizing crop yields. Technological advancements such as reinforced sidewalls for increased puncture resistance and integrated sensors for real-time pressure and temperature monitoring are becoming more prevalent, offering farmers greater control and predictive maintenance capabilities.
Key Drivers, Barriers & Challenges in Farm Tractor Tires
Key Drivers: The farm tractor tires market is propelled by several critical drivers. The increasing global demand for food, driven by population growth, necessitates higher agricultural productivity, directly influencing the need for efficient and reliable farm machinery and their tires. Technological advancements in tractor design, demanding higher-performance tires, and government initiatives promoting agricultural mechanization further fuel market expansion. The ongoing transition towards precision agriculture practices, where tire performance significantly impacts crop yields, also acts as a significant growth catalyst.
Key Barriers & Challenges: Supply chain disruptions, exacerbated by geopolitical factors and material shortages, pose a significant challenge, impacting production timelines and costs, with an estimated XX% increase in raw material costs over the past year. Regulatory hurdles related to environmental impact and tire disposal add complexity to manufacturing and product development. Intense competitive pressures among established global players and emerging regional manufacturers can lead to price wars, impacting profit margins. The high capital investment required for developing and manufacturing advanced tire technologies, coupled with the long product lifecycles of tractors, presents financial challenges for some manufacturers. The threat of counterfeit products in certain markets also erodes market share and brand reputation.
Emerging Opportunities in Farm Tractor Tires
Emerging opportunities in the farm tractor tires market lie in the development and adoption of smart tire technologies. This includes sensors that monitor tire pressure, temperature, and wear in real-time, providing valuable data for optimizing field operations and predictive maintenance, potentially reducing downtime by an estimated XX%. The growing demand for sustainable and eco-friendly agricultural practices is creating a market for tires made from recycled materials or those with a reduced environmental footprint during manufacturing and disposal. Untapped markets in developing economies with increasing agricultural mechanization present significant expansion potential. Furthermore, the development of specialized tires for niche applications, such as autonomous farming equipment or specialized crop harvesting machinery, offers avenues for innovation and market differentiation.
Growth Accelerators in the Farm Tractor Tires Industry
Long-term growth in the farm tractor tires industry will be significantly accelerated by several factors. Continuous technological breakthroughs in material science, leading to lighter, stronger, and more durable tire compounds, will enhance performance and reduce operational costs for farmers. Strategic partnerships between tire manufacturers and tractor OEMs will ensure seamless integration of advanced tire solutions with new machinery, fostering innovation and market penetration. Furthermore, global market expansion strategies, focusing on emerging agricultural economies and addressing their specific needs, will unlock substantial growth potential. The increasing focus on R&D for tires that minimize soil compaction and optimize fuel efficiency will drive adoption among environmentally conscious and efficiency-focused farmers.
Key Players Shaping the Farm Tractor Tires Market
- Bridgestone
- Titan International Inc.
- Michelin
- Balkrishna Industries Limited
- Alliance Tire Group (ATG)
- Continental Industrial Tires
- Kramer-Werke GmbH
- Nokian Heavy Tyres
- Trelleborg Wheel Systems
- Mitas
Notable Milestones in Farm Tractor Tires Sector
- 2020: Launch of advanced tread patterns for reduced soil compaction by major manufacturers.
- 2021: Increased focus on sustainability with R&D into eco-friendly rubber compounds.
- 2022: Introduction of smart tire monitoring systems for enhanced operational efficiency.
- 2023: Significant M&A activity aimed at market consolidation and technology acquisition, with an estimated XX billion units in deal volume.
- 2024: Growing adoption of radial-ply tires across developing agricultural economies.
In-Depth Farm Tractor Tires Market Outlook
The farm tractor tires market outlook remains exceptionally positive, driven by an confluence of technological advancements, increasing global food demand, and a growing emphasis on agricultural efficiency and sustainability. The continued evolution of smart tire technologies and eco-friendly materials will not only enhance performance but also create new revenue streams. Strategic collaborations between tire manufacturers and tractor producers are expected to accelerate the adoption of cutting-edge solutions, while expansion into nascent agricultural markets will provide substantial growth catalysts. Farmers' increasing awareness of the long-term economic and environmental benefits of high-performance tires will continue to shape purchasing decisions, solidifying the trajectory for sustained market growth.
Farm Tractor Tires Segmentation
-
1. Application
- 1.1. OEM
- 1.2. Replacement
-
2. Types
- 2.1. Bias-ply Tires
- 2.2. Radial-ply Tires
Farm Tractor Tires Segmentation By Geography
-
1. North America
- 1.1. United States
- 1.2. Canada
- 1.3. Mexico
-
2. South America
- 2.1. Brazil
- 2.2. Argentina
- 2.3. Rest of South America
-
3. Europe
- 3.1. United Kingdom
- 3.2. Germany
- 3.3. France
- 3.4. Italy
- 3.5. Spain
- 3.6. Russia
- 3.7. Benelux
- 3.8. Nordics
- 3.9. Rest of Europe
-
4. Middle East & Africa
- 4.1. Turkey
- 4.2. Israel
- 4.3. GCC
- 4.4. North Africa
- 4.5. South Africa
- 4.6. Rest of Middle East & Africa
-
5. Asia Pacific
- 5.1. China
- 5.2. India
- 5.3. Japan
- 5.4. South Korea
- 5.5. ASEAN
- 5.6. Oceania
- 5.7. Rest of Asia Pacific
Farm Tractor Tires Regional Market Share
Geographic Coverage of Farm Tractor Tires
Farm Tractor Tires REPORT HIGHLIGHTS
| Aspects | Details |
|---|---|
| Study Period | 2020-2034 |
| Base Year | 2025 |
| Estimated Year | 2026 |
| Forecast Period | 2026-2034 |
| Historical Period | 2020-2025 |
| Growth Rate | CAGR of 5.5% from 2020-2034 |
| Segmentation |
|
Table of Contents
- 1. Introduction
- 1.1. Research Scope
- 1.2. Market Segmentation
- 1.3. Research Objective
- 1.4. Definitions and Assumptions
- 2. Executive Summary
- 2.1. Market Snapshot
- 3. Market Dynamics
- 3.1. Market Drivers
- 3.2. Market Restrains
- 3.3. Market Trends
- 3.4. Market Opportunities
- 4. Market Factor Analysis
- 4.1. Porters Five Forces
- 4.1.1. Bargaining Power of Suppliers
- 4.1.2. Bargaining Power of Buyers
- 4.1.3. Threat of New Entrants
- 4.1.4. Threat of Substitutes
- 4.1.5. Competitive Rivalry
- 4.2. PESTEL analysis
- 4.3. BCG Analysis
- 4.3.1. Stars (High Growth, High Market Share)
- 4.3.2. Cash Cows (Low Growth, High Market Share)
- 4.3.3. Question Mark (High Growth, Low Market Share)
- 4.3.4. Dogs (Low Growth, Low Market Share)
- 4.4. Ansoff Matrix Analysis
- 4.5. Supply Chain Analysis
- 4.6. Regulatory Landscape
- 4.7. Current Market Potential and Opportunity Assessment (TAM–SAM–SOM Framework)
- 4.8. IMR Analyst Note
- 4.1. Porters Five Forces
- 5. Market Analysis, Insights and Forecast 2021-2033
- 5.1. Market Analysis, Insights and Forecast - by Application
- 5.1.1. OEM
- 5.1.2. Replacement
- 5.2. Market Analysis, Insights and Forecast - by Types
- 5.2.1. Bias-ply Tires
- 5.2.2. Radial-ply Tires
- 5.3. Market Analysis, Insights and Forecast - by Region
- 5.3.1. North America
- 5.3.2. South America
- 5.3.3. Europe
- 5.3.4. Middle East & Africa
- 5.3.5. Asia Pacific
- 5.1. Market Analysis, Insights and Forecast - by Application
- 6. Global Farm Tractor Tires Analysis, Insights and Forecast, 2021-2033
- 6.1. Market Analysis, Insights and Forecast - by Application
- 6.1.1. OEM
- 6.1.2. Replacement
- 6.2. Market Analysis, Insights and Forecast - by Types
- 6.2.1. Bias-ply Tires
- 6.2.2. Radial-ply Tires
- 6.1. Market Analysis, Insights and Forecast - by Application
- 7. North America Farm Tractor Tires Analysis, Insights and Forecast, 2020-2032
- 7.1. Market Analysis, Insights and Forecast - by Application
- 7.1.1. OEM
- 7.1.2. Replacement
- 7.2. Market Analysis, Insights and Forecast - by Types
- 7.2.1. Bias-ply Tires
- 7.2.2. Radial-ply Tires
- 7.1. Market Analysis, Insights and Forecast - by Application
- 8. South America Farm Tractor Tires Analysis, Insights and Forecast, 2020-2032
- 8.1. Market Analysis, Insights and Forecast - by Application
- 8.1.1. OEM
- 8.1.2. Replacement
- 8.2. Market Analysis, Insights and Forecast - by Types
- 8.2.1. Bias-ply Tires
- 8.2.2. Radial-ply Tires
- 8.1. Market Analysis, Insights and Forecast - by Application
- 9. Europe Farm Tractor Tires Analysis, Insights and Forecast, 2020-2032
- 9.1. Market Analysis, Insights and Forecast - by Application
- 9.1.1. OEM
- 9.1.2. Replacement
- 9.2. Market Analysis, Insights and Forecast - by Types
- 9.2.1. Bias-ply Tires
- 9.2.2. Radial-ply Tires
- 9.1. Market Analysis, Insights and Forecast - by Application
- 10. Middle East & Africa Farm Tractor Tires Analysis, Insights and Forecast, 2020-2032
- 10.1. Market Analysis, Insights and Forecast - by Application
- 10.1.1. OEM
- 10.1.2. Replacement
- 10.2. Market Analysis, Insights and Forecast - by Types
- 10.2.1. Bias-ply Tires
- 10.2.2. Radial-ply Tires
- 10.1. Market Analysis, Insights and Forecast - by Application
- 11. Asia Pacific Farm Tractor Tires Analysis, Insights and Forecast, 2020-2032
- 11.1. Market Analysis, Insights and Forecast - by Application
- 11.1.1. OEM
- 11.1.2. Replacement
- 11.2. Market Analysis, Insights and Forecast - by Types
- 11.2.1. Bias-ply Tires
- 11.2.2. Radial-ply Tires
- 11.1. Market Analysis, Insights and Forecast - by Application
- 12. Competitive Analysis
- 12.1. Company Profiles
- 12.1.1 Bridgestone
- 12.1.1.1. Company Overview
- 12.1.1.2. Products
- 12.1.1.3. Company Financials
- 12.1.1.4. SWOT Analysis
- 12.1.2 Titan International Inc.
- 12.1.2.1. Company Overview
- 12.1.2.2. Products
- 12.1.2.3. Company Financials
- 12.1.2.4. SWOT Analysis
- 12.1.3 Michelin
- 12.1.3.1. Company Overview
- 12.1.3.2. Products
- 12.1.3.3. Company Financials
- 12.1.3.4. SWOT Analysis
- 12.1.4 Balkrishna
- 12.1.4.1. Company Overview
- 12.1.4.2. Products
- 12.1.4.3. Company Financials
- 12.1.4.4. SWOT Analysis
- 12.1.5 Alliance Tire Group (ATG)
- 12.1.5.1. Company Overview
- 12.1.5.2. Products
- 12.1.5.3. Company Financials
- 12.1.5.4. SWOT Analysis
- 12.1.6 Continental Industrial Tires
- 12.1.6.1. Company Overview
- 12.1.6.2. Products
- 12.1.6.3. Company Financials
- 12.1.6.4. SWOT Analysis
- 12.1.7 Kramer-Werke GmbH
- 12.1.7.1. Company Overview
- 12.1.7.2. Products
- 12.1.7.3. Company Financials
- 12.1.7.4. SWOT Analysis
- 12.1.8 Nokian Heavy Tyres
- 12.1.8.1. Company Overview
- 12.1.8.2. Products
- 12.1.8.3. Company Financials
- 12.1.8.4. SWOT Analysis
- 12.1.9 Trelleborg Wheel Systems
- 12.1.9.1. Company Overview
- 12.1.9.2. Products
- 12.1.9.3. Company Financials
- 12.1.9.4. SWOT Analysis
- 12.1.10 Mitas
- 12.1.10.1. Company Overview
- 12.1.10.2. Products
- 12.1.10.3. Company Financials
- 12.1.10.4. SWOT Analysis
- 12.1.11 Balkrishna
- 12.1.11.1. Company Overview
- 12.1.11.2. Products
- 12.1.11.3. Company Financials
- 12.1.11.4. SWOT Analysis
- 12.1.1 Bridgestone
- 12.2. Market Entropy
- 12.2.1 Company's Key Areas Served
- 12.2.2 Recent Developments
- 12.3. Company Market Share Analysis 2025
- 12.3.1 Top 5 Companies Market Share Analysis
- 12.3.2 Top 3 Companies Market Share Analysis
- 12.4. List of Potential Customers
- 13. Research Methodology
List of Figures
- Figure 1: Global Farm Tractor Tires Revenue Breakdown (billion, %) by Region 2025 & 2033
- Figure 2: Global Farm Tractor Tires Volume Breakdown (K, %) by Region 2025 & 2033
- Figure 3: North America Farm Tractor Tires Revenue (billion), by Application 2025 & 2033
- Figure 4: North America Farm Tractor Tires Volume (K), by Application 2025 & 2033
- Figure 5: North America Farm Tractor Tires Revenue Share (%), by Application 2025 & 2033
- Figure 6: North America Farm Tractor Tires Volume Share (%), by Application 2025 & 2033
- Figure 7: North America Farm Tractor Tires Revenue (billion), by Types 2025 & 2033
- Figure 8: North America Farm Tractor Tires Volume (K), by Types 2025 & 2033
- Figure 9: North America Farm Tractor Tires Revenue Share (%), by Types 2025 & 2033
- Figure 10: North America Farm Tractor Tires Volume Share (%), by Types 2025 & 2033
- Figure 11: North America Farm Tractor Tires Revenue (billion), by Country 2025 & 2033
- Figure 12: North America Farm Tractor Tires Volume (K), by Country 2025 & 2033
- Figure 13: North America Farm Tractor Tires Revenue Share (%), by Country 2025 & 2033
- Figure 14: North America Farm Tractor Tires Volume Share (%), by Country 2025 & 2033
- Figure 15: South America Farm Tractor Tires Revenue (billion), by Application 2025 & 2033
- Figure 16: South America Farm Tractor Tires Volume (K), by Application 2025 & 2033
- Figure 17: South America Farm Tractor Tires Revenue Share (%), by Application 2025 & 2033
- Figure 18: South America Farm Tractor Tires Volume Share (%), by Application 2025 & 2033
- Figure 19: South America Farm Tractor Tires Revenue (billion), by Types 2025 & 2033
- Figure 20: South America Farm Tractor Tires Volume (K), by Types 2025 & 2033
- Figure 21: South America Farm Tractor Tires Revenue Share (%), by Types 2025 & 2033
- Figure 22: South America Farm Tractor Tires Volume Share (%), by Types 2025 & 2033
- Figure 23: South America Farm Tractor Tires Revenue (billion), by Country 2025 & 2033
- Figure 24: South America Farm Tractor Tires Volume (K), by Country 2025 & 2033
- Figure 25: South America Farm Tractor Tires Revenue Share (%), by Country 2025 & 2033
- Figure 26: South America Farm Tractor Tires Volume Share (%), by Country 2025 & 2033
- Figure 27: Europe Farm Tractor Tires Revenue (billion), by Application 2025 & 2033
- Figure 28: Europe Farm Tractor Tires Volume (K), by Application 2025 & 2033
- Figure 29: Europe Farm Tractor Tires Revenue Share (%), by Application 2025 & 2033
- Figure 30: Europe Farm Tractor Tires Volume Share (%), by Application 2025 & 2033
- Figure 31: Europe Farm Tractor Tires Revenue (billion), by Types 2025 & 2033
- Figure 32: Europe Farm Tractor Tires Volume (K), by Types 2025 & 2033
- Figure 33: Europe Farm Tractor Tires Revenue Share (%), by Types 2025 & 2033
- Figure 34: Europe Farm Tractor Tires Volume Share (%), by Types 2025 & 2033
- Figure 35: Europe Farm Tractor Tires Revenue (billion), by Country 2025 & 2033
- Figure 36: Europe Farm Tractor Tires Volume (K), by Country 2025 & 2033
- Figure 37: Europe Farm Tractor Tires Revenue Share (%), by Country 2025 & 2033
- Figure 38: Europe Farm Tractor Tires Volume Share (%), by Country 2025 & 2033
- Figure 39: Middle East & Africa Farm Tractor Tires Revenue (billion), by Application 2025 & 2033
- Figure 40: Middle East & Africa Farm Tractor Tires Volume (K), by Application 2025 & 2033
- Figure 41: Middle East & Africa Farm Tractor Tires Revenue Share (%), by Application 2025 & 2033
- Figure 42: Middle East & Africa Farm Tractor Tires Volume Share (%), by Application 2025 & 2033
- Figure 43: Middle East & Africa Farm Tractor Tires Revenue (billion), by Types 2025 & 2033
- Figure 44: Middle East & Africa Farm Tractor Tires Volume (K), by Types 2025 & 2033
- Figure 45: Middle East & Africa Farm Tractor Tires Revenue Share (%), by Types 2025 & 2033
- Figure 46: Middle East & Africa Farm Tractor Tires Volume Share (%), by Types 2025 & 2033
- Figure 47: Middle East & Africa Farm Tractor Tires Revenue (billion), by Country 2025 & 2033
- Figure 48: Middle East & Africa Farm Tractor Tires Volume (K), by Country 2025 & 2033
- Figure 49: Middle East & Africa Farm Tractor Tires Revenue Share (%), by Country 2025 & 2033
- Figure 50: Middle East & Africa Farm Tractor Tires Volume Share (%), by Country 2025 & 2033
- Figure 51: Asia Pacific Farm Tractor Tires Revenue (billion), by Application 2025 & 2033
- Figure 52: Asia Pacific Farm Tractor Tires Volume (K), by Application 2025 & 2033
- Figure 53: Asia Pacific Farm Tractor Tires Revenue Share (%), by Application 2025 & 2033
- Figure 54: Asia Pacific Farm Tractor Tires Volume Share (%), by Application 2025 & 2033
- Figure 55: Asia Pacific Farm Tractor Tires Revenue (billion), by Types 2025 & 2033
- Figure 56: Asia Pacific Farm Tractor Tires Volume (K), by Types 2025 & 2033
- Figure 57: Asia Pacific Farm Tractor Tires Revenue Share (%), by Types 2025 & 2033
- Figure 58: Asia Pacific Farm Tractor Tires Volume Share (%), by Types 2025 & 2033
- Figure 59: Asia Pacific Farm Tractor Tires Revenue (billion), by Country 2025 & 2033
- Figure 60: Asia Pacific Farm Tractor Tires Volume (K), by Country 2025 & 2033
- Figure 61: Asia Pacific Farm Tractor Tires Revenue Share (%), by Country 2025 & 2033
- Figure 62: Asia Pacific Farm Tractor Tires Volume Share (%), by Country 2025 & 2033
List of Tables
- Table 1: Global Farm Tractor Tires Revenue billion Forecast, by Application 2020 & 2033
- Table 2: Global Farm Tractor Tires Volume K Forecast, by Application 2020 & 2033
- Table 3: Global Farm Tractor Tires Revenue billion Forecast, by Types 2020 & 2033
- Table 4: Global Farm Tractor Tires Volume K Forecast, by Types 2020 & 2033
- Table 5: Global Farm Tractor Tires Revenue billion Forecast, by Region 2020 & 2033
- Table 6: Global Farm Tractor Tires Volume K Forecast, by Region 2020 & 2033
- Table 7: Global Farm Tractor Tires Revenue billion Forecast, by Application 2020 & 2033
- Table 8: Global Farm Tractor Tires Volume K Forecast, by Application 2020 & 2033
- Table 9: Global Farm Tractor Tires Revenue billion Forecast, by Types 2020 & 2033
- Table 10: Global Farm Tractor Tires Volume K Forecast, by Types 2020 & 2033
- Table 11: Global Farm Tractor Tires Revenue billion Forecast, by Country 2020 & 2033
- Table 12: Global Farm Tractor Tires Volume K Forecast, by Country 2020 & 2033
- Table 13: United States Farm Tractor Tires Revenue (billion) Forecast, by Application 2020 & 2033
- Table 14: United States Farm Tractor Tires Volume (K) Forecast, by Application 2020 & 2033
- Table 15: Canada Farm Tractor Tires Revenue (billion) Forecast, by Application 2020 & 2033
- Table 16: Canada Farm Tractor Tires Volume (K) Forecast, by Application 2020 & 2033
- Table 17: Mexico Farm Tractor Tires Revenue (billion) Forecast, by Application 2020 & 2033
- Table 18: Mexico Farm Tractor Tires Volume (K) Forecast, by Application 2020 & 2033
- Table 19: Global Farm Tractor Tires Revenue billion Forecast, by Application 2020 & 2033
- Table 20: Global Farm Tractor Tires Volume K Forecast, by Application 2020 & 2033
- Table 21: Global Farm Tractor Tires Revenue billion Forecast, by Types 2020 & 2033
- Table 22: Global Farm Tractor Tires Volume K Forecast, by Types 2020 & 2033
- Table 23: Global Farm Tractor Tires Revenue billion Forecast, by Country 2020 & 2033
- Table 24: Global Farm Tractor Tires Volume K Forecast, by Country 2020 & 2033
- Table 25: Brazil Farm Tractor Tires Revenue (billion) Forecast, by Application 2020 & 2033
- Table 26: Brazil Farm Tractor Tires Volume (K) Forecast, by Application 2020 & 2033
- Table 27: Argentina Farm Tractor Tires Revenue (billion) Forecast, by Application 2020 & 2033
- Table 28: Argentina Farm Tractor Tires Volume (K) Forecast, by Application 2020 & 2033
- Table 29: Rest of South America Farm Tractor Tires Revenue (billion) Forecast, by Application 2020 & 2033
- Table 30: Rest of South America Farm Tractor Tires Volume (K) Forecast, by Application 2020 & 2033
- Table 31: Global Farm Tractor Tires Revenue billion Forecast, by Application 2020 & 2033
- Table 32: Global Farm Tractor Tires Volume K Forecast, by Application 2020 & 2033
- Table 33: Global Farm Tractor Tires Revenue billion Forecast, by Types 2020 & 2033
- Table 34: Global Farm Tractor Tires Volume K Forecast, by Types 2020 & 2033
- Table 35: Global Farm Tractor Tires Revenue billion Forecast, by Country 2020 & 2033
- Table 36: Global Farm Tractor Tires Volume K Forecast, by Country 2020 & 2033
- Table 37: United Kingdom Farm Tractor Tires Revenue (billion) Forecast, by Application 2020 & 2033
- Table 38: United Kingdom Farm Tractor Tires Volume (K) Forecast, by Application 2020 & 2033
- Table 39: Germany Farm Tractor Tires Revenue (billion) Forecast, by Application 2020 & 2033
- Table 40: Germany Farm Tractor Tires Volume (K) Forecast, by Application 2020 & 2033
- Table 41: France Farm Tractor Tires Revenue (billion) Forecast, by Application 2020 & 2033
- Table 42: France Farm Tractor Tires Volume (K) Forecast, by Application 2020 & 2033
- Table 43: Italy Farm Tractor Tires Revenue (billion) Forecast, by Application 2020 & 2033
- Table 44: Italy Farm Tractor Tires Volume (K) Forecast, by Application 2020 & 2033
- Table 45: Spain Farm Tractor Tires Revenue (billion) Forecast, by Application 2020 & 2033
- Table 46: Spain Farm Tractor Tires Volume (K) Forecast, by Application 2020 & 2033
- Table 47: Russia Farm Tractor Tires Revenue (billion) Forecast, by Application 2020 & 2033
- Table 48: Russia Farm Tractor Tires Volume (K) Forecast, by Application 2020 & 2033
- Table 49: Benelux Farm Tractor Tires Revenue (billion) Forecast, by Application 2020 & 2033
- Table 50: Benelux Farm Tractor Tires Volume (K) Forecast, by Application 2020 & 2033
- Table 51: Nordics Farm Tractor Tires Revenue (billion) Forecast, by Application 2020 & 2033
- Table 52: Nordics Farm Tractor Tires Volume (K) Forecast, by Application 2020 & 2033
- Table 53: Rest of Europe Farm Tractor Tires Revenue (billion) Forecast, by Application 2020 & 2033
- Table 54: Rest of Europe Farm Tractor Tires Volume (K) Forecast, by Application 2020 & 2033
- Table 55: Global Farm Tractor Tires Revenue billion Forecast, by Application 2020 & 2033
- Table 56: Global Farm Tractor Tires Volume K Forecast, by Application 2020 & 2033
- Table 57: Global Farm Tractor Tires Revenue billion Forecast, by Types 2020 & 2033
- Table 58: Global Farm Tractor Tires Volume K Forecast, by Types 2020 & 2033
- Table 59: Global Farm Tractor Tires Revenue billion Forecast, by Country 2020 & 2033
- Table 60: Global Farm Tractor Tires Volume K Forecast, by Country 2020 & 2033
- Table 61: Turkey Farm Tractor Tires Revenue (billion) Forecast, by Application 2020 & 2033
- Table 62: Turkey Farm Tractor Tires Volume (K) Forecast, by Application 2020 & 2033
- Table 63: Israel Farm Tractor Tires Revenue (billion) Forecast, by Application 2020 & 2033
- Table 64: Israel Farm Tractor Tires Volume (K) Forecast, by Application 2020 & 2033
- Table 65: GCC Farm Tractor Tires Revenue (billion) Forecast, by Application 2020 & 2033
- Table 66: GCC Farm Tractor Tires Volume (K) Forecast, by Application 2020 & 2033
- Table 67: North Africa Farm Tractor Tires Revenue (billion) Forecast, by Application 2020 & 2033
- Table 68: North Africa Farm Tractor Tires Volume (K) Forecast, by Application 2020 & 2033
- Table 69: South Africa Farm Tractor Tires Revenue (billion) Forecast, by Application 2020 & 2033
- Table 70: South Africa Farm Tractor Tires Volume (K) Forecast, by Application 2020 & 2033
- Table 71: Rest of Middle East & Africa Farm Tractor Tires Revenue (billion) Forecast, by Application 2020 & 2033
- Table 72: Rest of Middle East & Africa Farm Tractor Tires Volume (K) Forecast, by Application 2020 & 2033
- Table 73: Global Farm Tractor Tires Revenue billion Forecast, by Application 2020 & 2033
- Table 74: Global Farm Tractor Tires Volume K Forecast, by Application 2020 & 2033
- Table 75: Global Farm Tractor Tires Revenue billion Forecast, by Types 2020 & 2033
- Table 76: Global Farm Tractor Tires Volume K Forecast, by Types 2020 & 2033
- Table 77: Global Farm Tractor Tires Revenue billion Forecast, by Country 2020 & 2033
- Table 78: Global Farm Tractor Tires Volume K Forecast, by Country 2020 & 2033
- Table 79: China Farm Tractor Tires Revenue (billion) Forecast, by Application 2020 & 2033
- Table 80: China Farm Tractor Tires Volume (K) Forecast, by Application 2020 & 2033
- Table 81: India Farm Tractor Tires Revenue (billion) Forecast, by Application 2020 & 2033
- Table 82: India Farm Tractor Tires Volume (K) Forecast, by Application 2020 & 2033
- Table 83: Japan Farm Tractor Tires Revenue (billion) Forecast, by Application 2020 & 2033
- Table 84: Japan Farm Tractor Tires Volume (K) Forecast, by Application 2020 & 2033
- Table 85: South Korea Farm Tractor Tires Revenue (billion) Forecast, by Application 2020 & 2033
- Table 86: South Korea Farm Tractor Tires Volume (K) Forecast, by Application 2020 & 2033
- Table 87: ASEAN Farm Tractor Tires Revenue (billion) Forecast, by Application 2020 & 2033
- Table 88: ASEAN Farm Tractor Tires Volume (K) Forecast, by Application 2020 & 2033
- Table 89: Oceania Farm Tractor Tires Revenue (billion) Forecast, by Application 2020 & 2033
- Table 90: Oceania Farm Tractor Tires Volume (K) Forecast, by Application 2020 & 2033
- Table 91: Rest of Asia Pacific Farm Tractor Tires Revenue (billion) Forecast, by Application 2020 & 2033
- Table 92: Rest of Asia Pacific Farm Tractor Tires Volume (K) Forecast, by Application 2020 & 2033
Frequently Asked Questions
1. What is the projected Compound Annual Growth Rate (CAGR) of the Farm Tractor Tires?
The projected CAGR is approximately 5.5%.
2. Which companies are prominent players in the Farm Tractor Tires?
Key companies in the market include Bridgestone, Titan International Inc., Michelin, Balkrishna, Alliance Tire Group (ATG), Continental Industrial Tires, Kramer-Werke GmbH, Nokian Heavy Tyres, Trelleborg Wheel Systems, Mitas, Balkrishna.
3. What are the main segments of the Farm Tractor Tires?
The market segments include Application, Types.
4. Can you provide details about the market size?
The market size is estimated to be USD 9.1 billion as of 2022.
5. What are some drivers contributing to market growth?
N/A
6. What are the notable trends driving market growth?
N/A
7. Are there any restraints impacting market growth?
N/A
8. Can you provide examples of recent developments in the market?
N/A
9. What pricing options are available for accessing the report?
Pricing options include single-user, multi-user, and enterprise licenses priced at USD 3350.00, USD 5025.00, and USD 6700.00 respectively.
10. Is the market size provided in terms of value or volume?
The market size is provided in terms of value, measured in billion and volume, measured in K.
11. Are there any specific market keywords associated with the report?
Yes, the market keyword associated with the report is "Farm Tractor Tires," which aids in identifying and referencing the specific market segment covered.
12. How do I determine which pricing option suits my needs best?
The pricing options vary based on user requirements and access needs. Individual users may opt for single-user licenses, while businesses requiring broader access may choose multi-user or enterprise licenses for cost-effective access to the report.
13. Are there any additional resources or data provided in the Farm Tractor Tires report?
While the report offers comprehensive insights, it's advisable to review the specific contents or supplementary materials provided to ascertain if additional resources or data are available.
14. How can I stay updated on further developments or reports in the Farm Tractor Tires?
To stay informed about further developments, trends, and reports in the Farm Tractor Tires, consider subscribing to industry newsletters, following relevant companies and organizations, or regularly checking reputable industry news sources and publications.
Methodology
Step 1 - Identification of Relevant Samples Size from Population Database


Step 2 - Approaches for Defining Global Market Size (Value, Volume* & Price*)

Note*: In applicable scenarios
Step 3 - Data Sources
Primary Research
- Web Analytics
- Survey Reports
- Research Institute
- Latest Research Reports
- Opinion Leaders
Secondary Research
- Annual Reports
- White Paper
- Latest Press Release
- Industry Association
- Paid Database
- Investor Presentations

Step 4 - Data Triangulation
Involves using different sources of information in order to increase the validity of a study
These sources are likely to be stakeholders in a program - participants, other researchers, program staff, other community members, and so on.
Then we put all data in single framework & apply various statistical tools to find out the dynamic on the market.
During the analysis stage, feedback from the stakeholder groups would be compared to determine areas of agreement as well as areas of divergence