

Key Insights
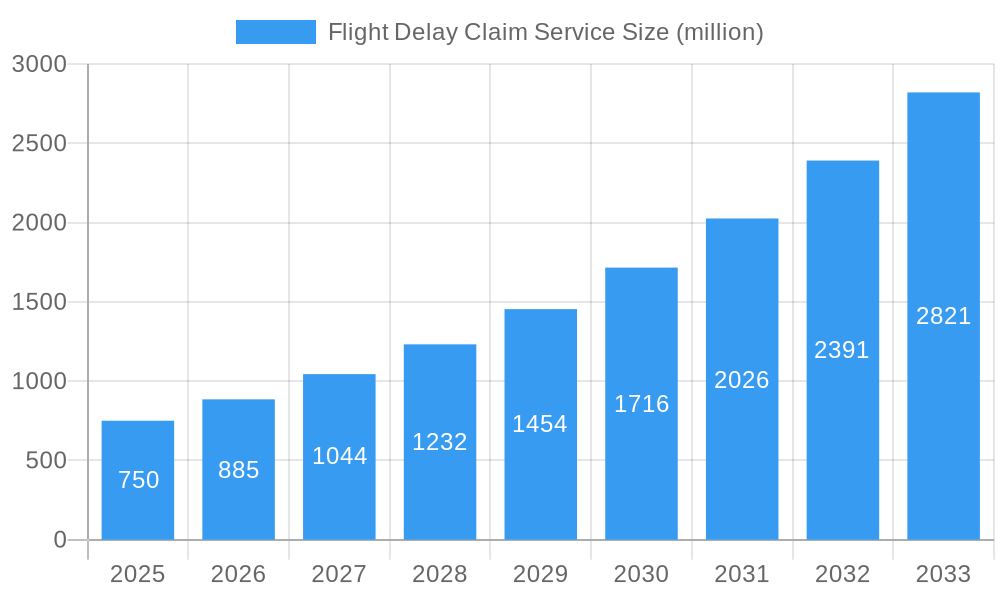
The global Flight Delay Claim Service market is experiencing robust growth, projected to reach an estimated market size of USD 750 million in 2025, with a significant Compound Annual Growth Rate (CAGR) of 18% expected between 2025 and 2033. This expansion is primarily fueled by increasing passenger awareness regarding their rights in case of flight disruptions and the growing complexity of air travel regulations, which often necessitate expert assistance for claiming compensation. The market is further propelled by the proliferation of specialized service providers, who leverage technology and legal expertise to streamline the claim process, making it more accessible and efficient for travelers. The rise in air passenger traffic, especially for both leisure and business purposes, naturally leads to a higher incidence of flight delays and cancellations, thereby creating a consistent demand for these services.
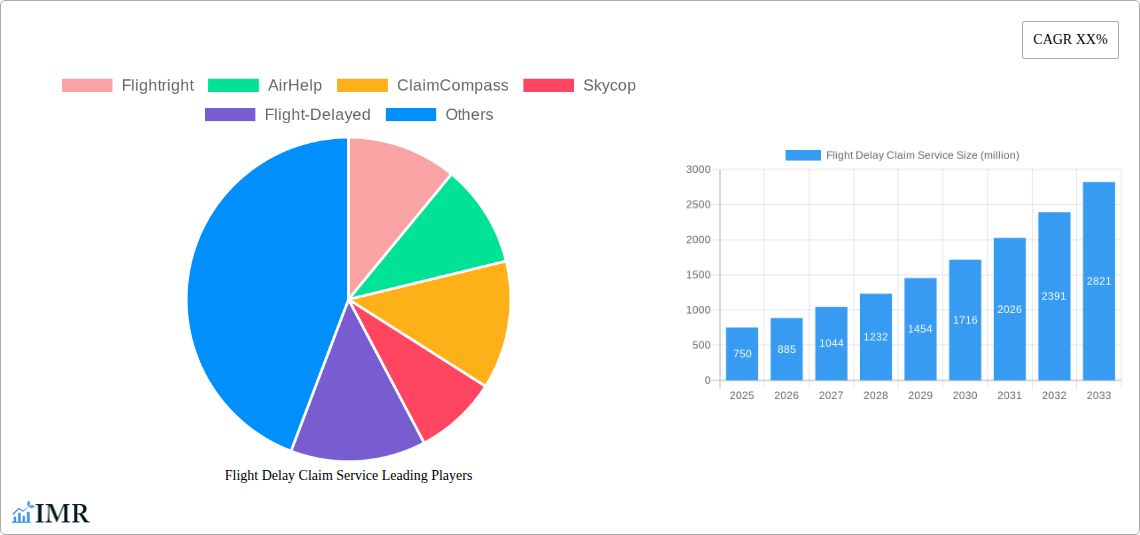
Flight Delay Claim Service Market Size (In Million)
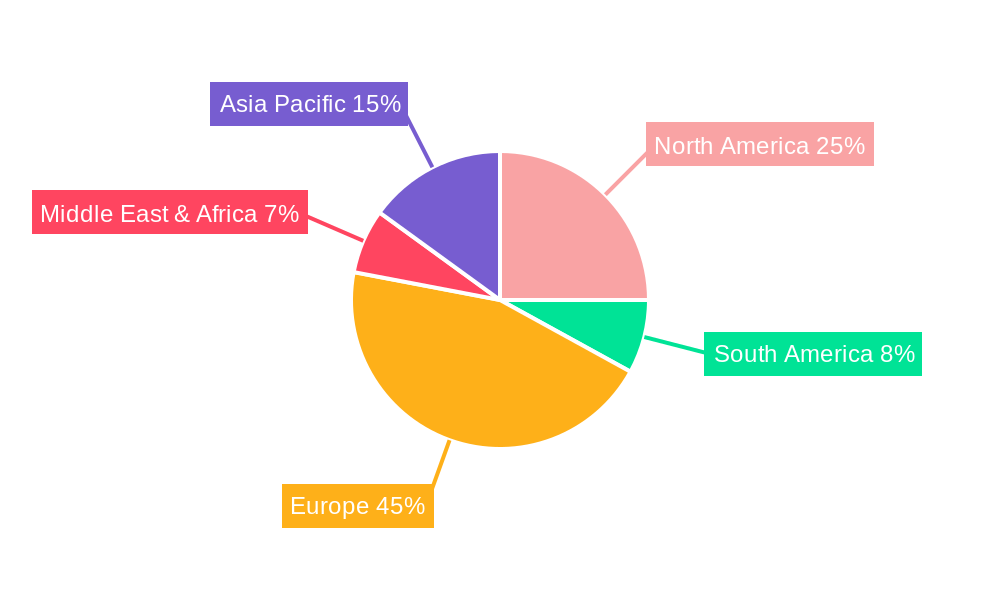
The market segmentation reveals a strong emphasis on Tourist Passengers as the largest application segment, driven by the sheer volume of leisure travel. However, the Business Passenger segment is also a significant contributor, as timely compensation can mitigate financial losses and reputational damage for corporations. In terms of types, Long Trips represent a substantial portion due to the increased likelihood of encountering significant disruptions and the higher potential compensation amounts. Key market players, including established entities like Flightright and AirHelp, alongside a host of emerging startups and legal firms, are actively innovating with digital platforms, AI-powered claim assessment, and transparent fee structures to capture market share. Geographically, Europe is anticipated to dominate the market, owing to its stringent passenger rights regulations (EC 261/2004) and a highly aware consumer base, followed by North America and the Asia Pacific region, which is exhibiting the fastest growth trajectory due to increasing air travel and evolving passenger protection laws.
Flight Delay Claim Service Company Market Share
This comprehensive report delves into the dynamic Flight Delay Claim Service market, analyzing its structure, growth trajectory, key players, and future outlook. Covering the period from 2019 to 2033, with a base year of 2025, this analysis provides invaluable insights for industry professionals, investors, and stakeholders.
Flight Delay Claim Service Market Dynamics & Structure
The global flight delay claim service market exhibits a moderately concentrated structure, characterized by the presence of both established global players and emerging regional specialists. Technological innovation, particularly in AI-powered claim processing and customer communication platforms, serves as a primary driver, streamlining operations and enhancing user experience. Regulatory frameworks across different jurisdictions, such as EU Regulation 261/2004 and its global counterparts, significantly influence claim eligibility and payout percentages, creating complex compliance landscapes. Competitive product substitutes include direct airline compensation, travel insurance policies, and the DIY approach to filing claims. End-user demographics span Tourist Passengers (approximately 65% of the market), Business Passengers (approximately 30%), and Others (approximately 5%), each with varying expectations regarding service speed and complexity. Mergers and acquisitions (M&A) are a growing trend, as larger entities seek to expand their geographical reach and technological capabilities, with an estimated 5-7 significant M&A deals predicted annually within the forecast period. Barriers to innovation include the high cost of developing sophisticated data analytics and the need for legal expertise to navigate diverse international regulations.
- Market Concentration: Moderately concentrated with key players like Flightright, AirHelp, and ClaimCompass holding significant market shares.
- Technological Innovation: Driven by AI for claim assessment, automated communication, and data analytics.
- Regulatory Frameworks: EU261 and similar regulations are pivotal, impacting claim validity and processing.
- Competitive Substitutes: Direct airline offers, travel insurance, and self-filing.
- End-User Demographics: Predominantly Tourist Passengers, followed by Business Passengers.
- M&A Trends: Increasing consolidation to gain market share and technological advantages.
- Innovation Barriers: High R&D costs, regulatory complexity, and data privacy concerns.
Flight Delay Claim Service Growth Trends & Insights
The flight delay claim service market is poised for substantial growth, driven by increasing passenger awareness of their rights and a continuous surge in air travel. The market size is projected to expand from an estimated $4,500 million in 2019 to a projected $15,000 million by 2033, demonstrating a robust Compound Annual Growth Rate (CAGR) of approximately 10.5%. Adoption rates for these services are steadily rising, particularly among frequent travelers and those who have previously experienced lengthy delays. Technological disruptions are a significant factor, with advancements in machine learning and natural language processing enabling more efficient claim assessment and a higher success rate. Consumer behavior is shifting towards seeking convenient, automated solutions for compensation, moving away from the time-consuming manual claims process. Market penetration is expected to grow from approximately 15% in 2019 to an estimated 45% by 2033. The increasing volume of air passengers globally, despite occasional disruptions, ensures a consistently large pool of potential claimants.
Dominant Regions, Countries, or Segments in Flight Delay Claim Service
The Tourist Passenger segment, particularly for Long Trips, is the dominant force driving growth in the flight delay claim service market. This segment's dominance is fueled by a confluence of factors, including higher average ticket values leading to more substantial potential compensation, and a greater propensity for delays impacting longer journeys. Economically, regions with high outbound tourism and well-established air travel infrastructure, such as Europe and North America, consistently lead in claim volumes. Within Europe, countries like the United Kingdom, Germany, France, and Spain are paramount due to the comprehensive passenger rights regulations like EC 261/2004, which offers strong protections and clear compensation guidelines.
- Dominant Segment: Tourist Passengers undertaking Long Trips.
- Market Share: Estimated at over 55% of total claims processed.
- Drivers: Higher potential claim values, extended travel durations increasing delay probability, and greater awareness of rights.
- Dominant Region: Europe.
- Key Countries: United Kingdom, Germany, France, Spain, Italy.
- Drivers: Robust passenger rights legislation (e.g., EC 261/2004), high volume of intra-European and long-haul travel, and a well-developed ecosystem of claim service providers.
- Market Share: Accounts for an estimated 40% of global claim volumes.
- Emerging Dominant Segments: Business Passenger for Short Trips is showing significant growth due to increased business travel frequency and the direct financial impact of delays.
- Growth Potential: Projected to see a CAGR of 12-15% in the next five years.
Flight Delay Claim Service Product Landscape
The product landscape is characterized by a spectrum of service offerings, from fully automated online platforms to comprehensive legal support. Key innovations include AI-driven eligibility checkers that provide instant assessments, secure online portals for document submission, and proactive notification systems for flight changes. Performance metrics are increasingly focused on claim success rates, average payout amounts, and processing times, with leading providers achieving success rates exceeding 80% and average processing times of 2-6 weeks for straightforward claims. Many services, like those offered by AirHelp and Flightright, differentiate themselves through their transparent fee structures, often a percentage of the recovered compensation, and dedicated customer support channels.
Key Drivers, Barriers & Challenges in Flight Delay Claim Service
Key Drivers:
- Increasing Passenger Awareness: Global campaigns and media attention have significantly educated travelers about their rights.
- Robust Regulatory Frameworks: Legislation like EU261 provides a strong legal basis for claims.
- Technological Advancements: AI and data analytics streamline claim processing and increase success rates.
- Growth in Air Travel: A consistently increasing global passenger volume ensures a large potential customer base.
Barriers & Challenges:
- Airline Resistance: Airlines may contest claims, leading to protracted legal battles and lower net payouts.
- Regulatory Complexity: Navigating different national and international aviation laws presents a significant hurdle.
- Data Accuracy and Verification: Ensuring the accuracy of flight data and claimant information is crucial but challenging.
- Market Saturation and Competition: Intense competition can lead to price wars and margin erosion, with players like Bott and Co and FairPlane vying for market share.
- Supply Chain Issues: Inconsistent airline data availability can delay claim processing.
- Customer Acquisition Costs: Reaching and educating potential customers in a crowded market is expensive.
Emerging Opportunities in Flight Delay Claim Service
Emerging opportunities lie in leveraging blockchain technology for secure and transparent claim verification, enhancing trust between passengers, service providers, and airlines. The expansion into under-served markets with developing aviation sectors and nascent passenger rights awareness presents a significant growth avenue. Developing specialized claim services for niche markets, such as frequent flyer programs or specific airline alliances, could capture dedicated customer bases. Furthermore, integrating predictive analytics to proactively alert passengers about potential delays and their eligibility could revolutionize the proactive service model. The increasing complexity of flight disruptions, including those caused by weather and operational issues, creates a sustained demand for expert claim resolution.
Growth Accelerators in the Flight Delay Claim Service Industry
Long-term growth is being accelerated by the continuous evolution of AI and machine learning algorithms, enabling more sophisticated claim analysis and predictive modeling. Strategic partnerships between claim service providers, travel agencies, and loyalty programs are crucial for expanding customer reach and simplifying claim initiation. Market expansion strategies involving localized service offerings and multilingual support will be vital for penetrating diverse global markets. The increasing adoption of mobile-first strategies, with user-friendly apps from companies like Skycop and AirAdvisor, ensures accessibility and convenience for a tech-savvy consumer base. Furthermore, the growing trend of airlines recognizing the value of third-party claim processors in managing claim volumes efficiently is a significant growth catalyst.
Key Players Shaping the Flight Delay Claim Service Market
- Flightright
- AirHelp
- ClaimCompass
- Skycop
- Flight-Delayed
- Bott and Co
- FairPlane
- Flight Delay Pay
- Click3Refund
- Aireclaim
- TravelRefund
- Visymo
- Resolver
- MYFLYRIGHT
- Refundmore
- ClaimFlights
- AirAdvisor
- ClaimAir
- Versus Law
- Optimal Solicitors
- Sarah Waddington Solicitors
- easyJet
- Eurowings
- Norton Rose Fulbright
- Vueling
- Icelandair
- R&A Solicitors
- SkyRefund
- Traficom
Notable Milestones in Flight Delay Claim Service Sector
- 2019 (Ongoing): Increased regulatory scrutiny and enforcement of passenger rights across major aviation hubs.
- 2020 (Q1): Initial impact of COVID-19 on air travel, leading to a surge in cancellations and refund/compensation claims, highlighting the need for efficient claim services.
- 2021 (Q2): Introduction of advanced AI tools by companies like AirHelp for automated claim processing and eligibility checks.
- 2022 (Q4): Significant growth in M&A activity as larger players acquire smaller competitors to expand market share.
- 2023 (Q3): Launch of specialized claim resolution services targeting business travelers, by firms like Versus Law.
- 2024 (Q1): Increased adoption of blockchain technology for transparent claim management by a few innovative startups.
- 2024 (Q2): Major airlines begin partnering with third-party claim services to manage their claim volumes more efficiently.
In-Depth Flight Delay Claim Service Market Outlook
The flight delay claim service market is set for sustained and robust growth, driven by an ever-expanding air travel industry and increasingly informed passengers. Strategic opportunities lie in technological integration, such as the use of predictive analytics to preemptively identify and address potential claims, alongside AI for faster, more accurate claim assessments. Expansion into emerging markets with evolving aviation infrastructure and regulatory frameworks presents substantial untapped potential. The increasing reliance on mobile applications for all aspects of travel will necessitate user-friendly, intuitive claim platforms. As airlines continue to face operational challenges and disruptions, the demand for specialized, efficient, and trustworthy flight delay claim services will only intensify, solidifying their crucial role in passenger rights advocacy and the broader travel ecosystem.
Flight Delay Claim Service Segmentation
-
1. Application
- 1.1. Tourist Passengers
- 1.2. Business Passenger
- 1.3. Others
-
2. Types
- 2.1. Long Trip
- 2.2. Short Trip
Flight Delay Claim Service Segmentation By Geography
-
1. North America
- 1.1. United States
- 1.2. Canada
- 1.3. Mexico
-
2. South America
- 2.1. Brazil
- 2.2. Argentina
- 2.3. Rest of South America
-
3. Europe
- 3.1. United Kingdom
- 3.2. Germany
- 3.3. France
- 3.4. Italy
- 3.5. Spain
- 3.6. Russia
- 3.7. Benelux
- 3.8. Nordics
- 3.9. Rest of Europe
-
4. Middle East & Africa
- 4.1. Turkey
- 4.2. Israel
- 4.3. GCC
- 4.4. North Africa
- 4.5. South Africa
- 4.6. Rest of Middle East & Africa
-
5. Asia Pacific
- 5.1. China
- 5.2. India
- 5.3. Japan
- 5.4. South Korea
- 5.5. ASEAN
- 5.6. Oceania
- 5.7. Rest of Asia Pacific
Flight Delay Claim Service Regional Market Share
Geographic Coverage of Flight Delay Claim Service
Flight Delay Claim Service REPORT HIGHLIGHTS
| Aspects | Details |
|---|---|
| Study Period | 2020-2034 |
| Base Year | 2025 |
| Estimated Year | 2026 |
| Forecast Period | 2026-2034 |
| Historical Period | 2020-2025 |
| Growth Rate | CAGR of 9.2% from 2020-2034 |
| Segmentation |
|
Table of Contents
- 1. Introduction
- 1.1. Research Scope
- 1.2. Market Segmentation
- 1.3. Research Objective
- 1.4. Definitions and Assumptions
- 2. Executive Summary
- 2.1. Market Snapshot
- 3. Market Dynamics
- 3.1. Market Drivers
- 3.2. Market Restrains
- 3.3. Market Trends
- 3.4. Market Opportunities
- 4. Market Factor Analysis
- 4.1. Porters Five Forces
- 4.1.1. Bargaining Power of Suppliers
- 4.1.2. Bargaining Power of Buyers
- 4.1.3. Threat of New Entrants
- 4.1.4. Threat of Substitutes
- 4.1.5. Competitive Rivalry
- 4.2. PESTEL analysis
- 4.3. BCG Analysis
- 4.3.1. Stars (High Growth, High Market Share)
- 4.3.2. Cash Cows (Low Growth, High Market Share)
- 4.3.3. Question Mark (High Growth, Low Market Share)
- 4.3.4. Dogs (Low Growth, Low Market Share)
- 4.4. Ansoff Matrix Analysis
- 4.5. Supply Chain Analysis
- 4.6. Regulatory Landscape
- 4.7. Current Market Potential and Opportunity Assessment (TAM–SAM–SOM Framework)
- 4.8. IMR Analyst Note
- 4.1. Porters Five Forces
- 5. Market Analysis, Insights and Forecast 2021-2033
- 5.1. Market Analysis, Insights and Forecast - by Application
- 5.1.1. Tourist Passengers
- 5.1.2. Business Passenger
- 5.1.3. Others
- 5.2. Market Analysis, Insights and Forecast - by Types
- 5.2.1. Long Trip
- 5.2.2. Short Trip
- 5.3. Market Analysis, Insights and Forecast - by Region
- 5.3.1. North America
- 5.3.2. South America
- 5.3.3. Europe
- 5.3.4. Middle East & Africa
- 5.3.5. Asia Pacific
- 5.1. Market Analysis, Insights and Forecast - by Application
- 6. Global Flight Delay Claim Service Analysis, Insights and Forecast, 2021-2033
- 6.1. Market Analysis, Insights and Forecast - by Application
- 6.1.1. Tourist Passengers
- 6.1.2. Business Passenger
- 6.1.3. Others
- 6.2. Market Analysis, Insights and Forecast - by Types
- 6.2.1. Long Trip
- 6.2.2. Short Trip
- 6.1. Market Analysis, Insights and Forecast - by Application
- 7. North America Flight Delay Claim Service Analysis, Insights and Forecast, 2020-2032
- 7.1. Market Analysis, Insights and Forecast - by Application
- 7.1.1. Tourist Passengers
- 7.1.2. Business Passenger
- 7.1.3. Others
- 7.2. Market Analysis, Insights and Forecast - by Types
- 7.2.1. Long Trip
- 7.2.2. Short Trip
- 7.1. Market Analysis, Insights and Forecast - by Application
- 8. South America Flight Delay Claim Service Analysis, Insights and Forecast, 2020-2032
- 8.1. Market Analysis, Insights and Forecast - by Application
- 8.1.1. Tourist Passengers
- 8.1.2. Business Passenger
- 8.1.3. Others
- 8.2. Market Analysis, Insights and Forecast - by Types
- 8.2.1. Long Trip
- 8.2.2. Short Trip
- 8.1. Market Analysis, Insights and Forecast - by Application
- 9. Europe Flight Delay Claim Service Analysis, Insights and Forecast, 2020-2032
- 9.1. Market Analysis, Insights and Forecast - by Application
- 9.1.1. Tourist Passengers
- 9.1.2. Business Passenger
- 9.1.3. Others
- 9.2. Market Analysis, Insights and Forecast - by Types
- 9.2.1. Long Trip
- 9.2.2. Short Trip
- 9.1. Market Analysis, Insights and Forecast - by Application
- 10. Middle East & Africa Flight Delay Claim Service Analysis, Insights and Forecast, 2020-2032
- 10.1. Market Analysis, Insights and Forecast - by Application
- 10.1.1. Tourist Passengers
- 10.1.2. Business Passenger
- 10.1.3. Others
- 10.2. Market Analysis, Insights and Forecast - by Types
- 10.2.1. Long Trip
- 10.2.2. Short Trip
- 10.1. Market Analysis, Insights and Forecast - by Application
- 11. Asia Pacific Flight Delay Claim Service Analysis, Insights and Forecast, 2020-2032
- 11.1. Market Analysis, Insights and Forecast - by Application
- 11.1.1. Tourist Passengers
- 11.1.2. Business Passenger
- 11.1.3. Others
- 11.2. Market Analysis, Insights and Forecast - by Types
- 11.2.1. Long Trip
- 11.2.2. Short Trip
- 11.1. Market Analysis, Insights and Forecast - by Application
- 12. Competitive Analysis
- 12.1. Company Profiles
- 12.1.1 Flightright
- 12.1.1.1. Company Overview
- 12.1.1.2. Products
- 12.1.1.3. Company Financials
- 12.1.1.4. SWOT Analysis
- 12.1.2 AirHelp
- 12.1.2.1. Company Overview
- 12.1.2.2. Products
- 12.1.2.3. Company Financials
- 12.1.2.4. SWOT Analysis
- 12.1.3 ClaimCompass
- 12.1.3.1. Company Overview
- 12.1.3.2. Products
- 12.1.3.3. Company Financials
- 12.1.3.4. SWOT Analysis
- 12.1.4 Skycop
- 12.1.4.1. Company Overview
- 12.1.4.2. Products
- 12.1.4.3. Company Financials
- 12.1.4.4. SWOT Analysis
- 12.1.5 Flight-Delayed
- 12.1.5.1. Company Overview
- 12.1.5.2. Products
- 12.1.5.3. Company Financials
- 12.1.5.4. SWOT Analysis
- 12.1.6 Bott and Co
- 12.1.6.1. Company Overview
- 12.1.6.2. Products
- 12.1.6.3. Company Financials
- 12.1.6.4. SWOT Analysis
- 12.1.7 FairPlane
- 12.1.7.1. Company Overview
- 12.1.7.2. Products
- 12.1.7.3. Company Financials
- 12.1.7.4. SWOT Analysis
- 12.1.8 Flight Delay Pay
- 12.1.8.1. Company Overview
- 12.1.8.2. Products
- 12.1.8.3. Company Financials
- 12.1.8.4. SWOT Analysis
- 12.1.9 Click3Refund
- 12.1.9.1. Company Overview
- 12.1.9.2. Products
- 12.1.9.3. Company Financials
- 12.1.9.4. SWOT Analysis
- 12.1.10 Aireclaim
- 12.1.10.1. Company Overview
- 12.1.10.2. Products
- 12.1.10.3. Company Financials
- 12.1.10.4. SWOT Analysis
- 12.1.11 TravelRefund
- 12.1.11.1. Company Overview
- 12.1.11.2. Products
- 12.1.11.3. Company Financials
- 12.1.11.4. SWOT Analysis
- 12.1.12 Visymo
- 12.1.12.1. Company Overview
- 12.1.12.2. Products
- 12.1.12.3. Company Financials
- 12.1.12.4. SWOT Analysis
- 12.1.13 Resolver
- 12.1.13.1. Company Overview
- 12.1.13.2. Products
- 12.1.13.3. Company Financials
- 12.1.13.4. SWOT Analysis
- 12.1.14 MYFLYRIGHT
- 12.1.14.1. Company Overview
- 12.1.14.2. Products
- 12.1.14.3. Company Financials
- 12.1.14.4. SWOT Analysis
- 12.1.15 Refundmore
- 12.1.15.1. Company Overview
- 12.1.15.2. Products
- 12.1.15.3. Company Financials
- 12.1.15.4. SWOT Analysis
- 12.1.16 ClaimFlights
- 12.1.16.1. Company Overview
- 12.1.16.2. Products
- 12.1.16.3. Company Financials
- 12.1.16.4. SWOT Analysis
- 12.1.17 AirAdvisor
- 12.1.17.1. Company Overview
- 12.1.17.2. Products
- 12.1.17.3. Company Financials
- 12.1.17.4. SWOT Analysis
- 12.1.18 ClaimAir
- 12.1.18.1. Company Overview
- 12.1.18.2. Products
- 12.1.18.3. Company Financials
- 12.1.18.4. SWOT Analysis
- 12.1.19 Versus Law
- 12.1.19.1. Company Overview
- 12.1.19.2. Products
- 12.1.19.3. Company Financials
- 12.1.19.4. SWOT Analysis
- 12.1.20 Optimal Solicitors
- 12.1.20.1. Company Overview
- 12.1.20.2. Products
- 12.1.20.3. Company Financials
- 12.1.20.4. SWOT Analysis
- 12.1.21 Sarah Waddington Solicitors
- 12.1.21.1. Company Overview
- 12.1.21.2. Products
- 12.1.21.3. Company Financials
- 12.1.21.4. SWOT Analysis
- 12.1.22 easyJet
- 12.1.22.1. Company Overview
- 12.1.22.2. Products
- 12.1.22.3. Company Financials
- 12.1.22.4. SWOT Analysis
- 12.1.23 Eurowings
- 12.1.23.1. Company Overview
- 12.1.23.2. Products
- 12.1.23.3. Company Financials
- 12.1.23.4. SWOT Analysis
- 12.1.24 Norton Rose Fulbright
- 12.1.24.1. Company Overview
- 12.1.24.2. Products
- 12.1.24.3. Company Financials
- 12.1.24.4. SWOT Analysis
- 12.1.25 Vueling
- 12.1.25.1. Company Overview
- 12.1.25.2. Products
- 12.1.25.3. Company Financials
- 12.1.25.4. SWOT Analysis
- 12.1.26 Icelandair
- 12.1.26.1. Company Overview
- 12.1.26.2. Products
- 12.1.26.3. Company Financials
- 12.1.26.4. SWOT Analysis
- 12.1.27 R&A Solicitors
- 12.1.27.1. Company Overview
- 12.1.27.2. Products
- 12.1.27.3. Company Financials
- 12.1.27.4. SWOT Analysis
- 12.1.28 SkyRefund
- 12.1.28.1. Company Overview
- 12.1.28.2. Products
- 12.1.28.3. Company Financials
- 12.1.28.4. SWOT Analysis
- 12.1.29 Traficom
- 12.1.29.1. Company Overview
- 12.1.29.2. Products
- 12.1.29.3. Company Financials
- 12.1.29.4. SWOT Analysis
- 12.1.1 Flightright
- 12.2. Market Entropy
- 12.2.1 Company's Key Areas Served
- 12.2.2 Recent Developments
- 12.3. Company Market Share Analysis 2025
- 12.3.1 Top 5 Companies Market Share Analysis
- 12.3.2 Top 3 Companies Market Share Analysis
- 12.4. List of Potential Customers
- 13. Research Methodology
List of Figures
- Figure 1: Global Flight Delay Claim Service Revenue Breakdown (billion, %) by Region 2025 & 2033
- Figure 2: North America Flight Delay Claim Service Revenue (billion), by Application 2025 & 2033
- Figure 3: North America Flight Delay Claim Service Revenue Share (%), by Application 2025 & 2033
- Figure 4: North America Flight Delay Claim Service Revenue (billion), by Types 2025 & 2033
- Figure 5: North America Flight Delay Claim Service Revenue Share (%), by Types 2025 & 2033
- Figure 6: North America Flight Delay Claim Service Revenue (billion), by Country 2025 & 2033
- Figure 7: North America Flight Delay Claim Service Revenue Share (%), by Country 2025 & 2033
- Figure 8: South America Flight Delay Claim Service Revenue (billion), by Application 2025 & 2033
- Figure 9: South America Flight Delay Claim Service Revenue Share (%), by Application 2025 & 2033
- Figure 10: South America Flight Delay Claim Service Revenue (billion), by Types 2025 & 2033
- Figure 11: South America Flight Delay Claim Service Revenue Share (%), by Types 2025 & 2033
- Figure 12: South America Flight Delay Claim Service Revenue (billion), by Country 2025 & 2033
- Figure 13: South America Flight Delay Claim Service Revenue Share (%), by Country 2025 & 2033
- Figure 14: Europe Flight Delay Claim Service Revenue (billion), by Application 2025 & 2033
- Figure 15: Europe Flight Delay Claim Service Revenue Share (%), by Application 2025 & 2033
- Figure 16: Europe Flight Delay Claim Service Revenue (billion), by Types 2025 & 2033
- Figure 17: Europe Flight Delay Claim Service Revenue Share (%), by Types 2025 & 2033
- Figure 18: Europe Flight Delay Claim Service Revenue (billion), by Country 2025 & 2033
- Figure 19: Europe Flight Delay Claim Service Revenue Share (%), by Country 2025 & 2033
- Figure 20: Middle East & Africa Flight Delay Claim Service Revenue (billion), by Application 2025 & 2033
- Figure 21: Middle East & Africa Flight Delay Claim Service Revenue Share (%), by Application 2025 & 2033
- Figure 22: Middle East & Africa Flight Delay Claim Service Revenue (billion), by Types 2025 & 2033
- Figure 23: Middle East & Africa Flight Delay Claim Service Revenue Share (%), by Types 2025 & 2033
- Figure 24: Middle East & Africa Flight Delay Claim Service Revenue (billion), by Country 2025 & 2033
- Figure 25: Middle East & Africa Flight Delay Claim Service Revenue Share (%), by Country 2025 & 2033
- Figure 26: Asia Pacific Flight Delay Claim Service Revenue (billion), by Application 2025 & 2033
- Figure 27: Asia Pacific Flight Delay Claim Service Revenue Share (%), by Application 2025 & 2033
- Figure 28: Asia Pacific Flight Delay Claim Service Revenue (billion), by Types 2025 & 2033
- Figure 29: Asia Pacific Flight Delay Claim Service Revenue Share (%), by Types 2025 & 2033
- Figure 30: Asia Pacific Flight Delay Claim Service Revenue (billion), by Country 2025 & 2033
- Figure 31: Asia Pacific Flight Delay Claim Service Revenue Share (%), by Country 2025 & 2033
List of Tables
- Table 1: Global Flight Delay Claim Service Revenue billion Forecast, by Application 2020 & 2033
- Table 2: Global Flight Delay Claim Service Revenue billion Forecast, by Types 2020 & 2033
- Table 3: Global Flight Delay Claim Service Revenue billion Forecast, by Region 2020 & 2033
- Table 4: Global Flight Delay Claim Service Revenue billion Forecast, by Application 2020 & 2033
- Table 5: Global Flight Delay Claim Service Revenue billion Forecast, by Types 2020 & 2033
- Table 6: Global Flight Delay Claim Service Revenue billion Forecast, by Country 2020 & 2033
- Table 7: United States Flight Delay Claim Service Revenue (billion) Forecast, by Application 2020 & 2033
- Table 8: Canada Flight Delay Claim Service Revenue (billion) Forecast, by Application 2020 & 2033
- Table 9: Mexico Flight Delay Claim Service Revenue (billion) Forecast, by Application 2020 & 2033
- Table 10: Global Flight Delay Claim Service Revenue billion Forecast, by Application 2020 & 2033
- Table 11: Global Flight Delay Claim Service Revenue billion Forecast, by Types 2020 & 2033
- Table 12: Global Flight Delay Claim Service Revenue billion Forecast, by Country 2020 & 2033
- Table 13: Brazil Flight Delay Claim Service Revenue (billion) Forecast, by Application 2020 & 2033
- Table 14: Argentina Flight Delay Claim Service Revenue (billion) Forecast, by Application 2020 & 2033
- Table 15: Rest of South America Flight Delay Claim Service Revenue (billion) Forecast, by Application 2020 & 2033
- Table 16: Global Flight Delay Claim Service Revenue billion Forecast, by Application 2020 & 2033
- Table 17: Global Flight Delay Claim Service Revenue billion Forecast, by Types 2020 & 2033
- Table 18: Global Flight Delay Claim Service Revenue billion Forecast, by Country 2020 & 2033
- Table 19: United Kingdom Flight Delay Claim Service Revenue (billion) Forecast, by Application 2020 & 2033
- Table 20: Germany Flight Delay Claim Service Revenue (billion) Forecast, by Application 2020 & 2033
- Table 21: France Flight Delay Claim Service Revenue (billion) Forecast, by Application 2020 & 2033
- Table 22: Italy Flight Delay Claim Service Revenue (billion) Forecast, by Application 2020 & 2033
- Table 23: Spain Flight Delay Claim Service Revenue (billion) Forecast, by Application 2020 & 2033
- Table 24: Russia Flight Delay Claim Service Revenue (billion) Forecast, by Application 2020 & 2033
- Table 25: Benelux Flight Delay Claim Service Revenue (billion) Forecast, by Application 2020 & 2033
- Table 26: Nordics Flight Delay Claim Service Revenue (billion) Forecast, by Application 2020 & 2033
- Table 27: Rest of Europe Flight Delay Claim Service Revenue (billion) Forecast, by Application 2020 & 2033
- Table 28: Global Flight Delay Claim Service Revenue billion Forecast, by Application 2020 & 2033
- Table 29: Global Flight Delay Claim Service Revenue billion Forecast, by Types 2020 & 2033
- Table 30: Global Flight Delay Claim Service Revenue billion Forecast, by Country 2020 & 2033
- Table 31: Turkey Flight Delay Claim Service Revenue (billion) Forecast, by Application 2020 & 2033
- Table 32: Israel Flight Delay Claim Service Revenue (billion) Forecast, by Application 2020 & 2033
- Table 33: GCC Flight Delay Claim Service Revenue (billion) Forecast, by Application 2020 & 2033
- Table 34: North Africa Flight Delay Claim Service Revenue (billion) Forecast, by Application 2020 & 2033
- Table 35: South Africa Flight Delay Claim Service Revenue (billion) Forecast, by Application 2020 & 2033
- Table 36: Rest of Middle East & Africa Flight Delay Claim Service Revenue (billion) Forecast, by Application 2020 & 2033
- Table 37: Global Flight Delay Claim Service Revenue billion Forecast, by Application 2020 & 2033
- Table 38: Global Flight Delay Claim Service Revenue billion Forecast, by Types 2020 & 2033
- Table 39: Global Flight Delay Claim Service Revenue billion Forecast, by Country 2020 & 2033
- Table 40: China Flight Delay Claim Service Revenue (billion) Forecast, by Application 2020 & 2033
- Table 41: India Flight Delay Claim Service Revenue (billion) Forecast, by Application 2020 & 2033
- Table 42: Japan Flight Delay Claim Service Revenue (billion) Forecast, by Application 2020 & 2033
- Table 43: South Korea Flight Delay Claim Service Revenue (billion) Forecast, by Application 2020 & 2033
- Table 44: ASEAN Flight Delay Claim Service Revenue (billion) Forecast, by Application 2020 & 2033
- Table 45: Oceania Flight Delay Claim Service Revenue (billion) Forecast, by Application 2020 & 2033
- Table 46: Rest of Asia Pacific Flight Delay Claim Service Revenue (billion) Forecast, by Application 2020 & 2033
Frequently Asked Questions
1. What is the projected Compound Annual Growth Rate (CAGR) of the Flight Delay Claim Service?
The projected CAGR is approximately 9.2%.
2. Which companies are prominent players in the Flight Delay Claim Service?
Key companies in the market include Flightright, AirHelp, ClaimCompass, Skycop, Flight-Delayed, Bott and Co, FairPlane, Flight Delay Pay, Click3Refund, Aireclaim, TravelRefund, Visymo, Resolver, MYFLYRIGHT, Refundmore, ClaimFlights, AirAdvisor, ClaimAir, Versus Law, Optimal Solicitors, Sarah Waddington Solicitors, easyJet, Eurowings, Norton Rose Fulbright, Vueling, Icelandair, R&A Solicitors, SkyRefund, Traficom.
3. What are the main segments of the Flight Delay Claim Service?
The market segments include Application, Types.
4. Can you provide details about the market size?
The market size is estimated to be USD 8.4 billion as of 2022.
5. What are some drivers contributing to market growth?
N/A
6. What are the notable trends driving market growth?
N/A
7. Are there any restraints impacting market growth?
N/A
8. Can you provide examples of recent developments in the market?
N/A
9. What pricing options are available for accessing the report?
Pricing options include single-user, multi-user, and enterprise licenses priced at USD 3350.00, USD 5025.00, and USD 6700.00 respectively.
10. Is the market size provided in terms of value or volume?
The market size is provided in terms of value, measured in billion.
11. Are there any specific market keywords associated with the report?
Yes, the market keyword associated with the report is "Flight Delay Claim Service," which aids in identifying and referencing the specific market segment covered.
12. How do I determine which pricing option suits my needs best?
The pricing options vary based on user requirements and access needs. Individual users may opt for single-user licenses, while businesses requiring broader access may choose multi-user or enterprise licenses for cost-effective access to the report.
13. Are there any additional resources or data provided in the Flight Delay Claim Service report?
While the report offers comprehensive insights, it's advisable to review the specific contents or supplementary materials provided to ascertain if additional resources or data are available.
14. How can I stay updated on further developments or reports in the Flight Delay Claim Service?
To stay informed about further developments, trends, and reports in the Flight Delay Claim Service, consider subscribing to industry newsletters, following relevant companies and organizations, or regularly checking reputable industry news sources and publications.
Methodology
Step 1 - Identification of Relevant Samples Size from Population Database


Step 2 - Approaches for Defining Global Market Size (Value, Volume* & Price*)

Note*: In applicable scenarios
Step 3 - Data Sources
Primary Research
- Web Analytics
- Survey Reports
- Research Institute
- Latest Research Reports
- Opinion Leaders
Secondary Research
- Annual Reports
- White Paper
- Latest Press Release
- Industry Association
- Paid Database
- Investor Presentations

Step 4 - Data Triangulation
Involves using different sources of information in order to increase the validity of a study
These sources are likely to be stakeholders in a program - participants, other researchers, program staff, other community members, and so on.
Then we put all data in single framework & apply various statistical tools to find out the dynamic on the market.
During the analysis stage, feedback from the stakeholder groups would be compared to determine areas of agreement as well as areas of divergence