

Key Insights
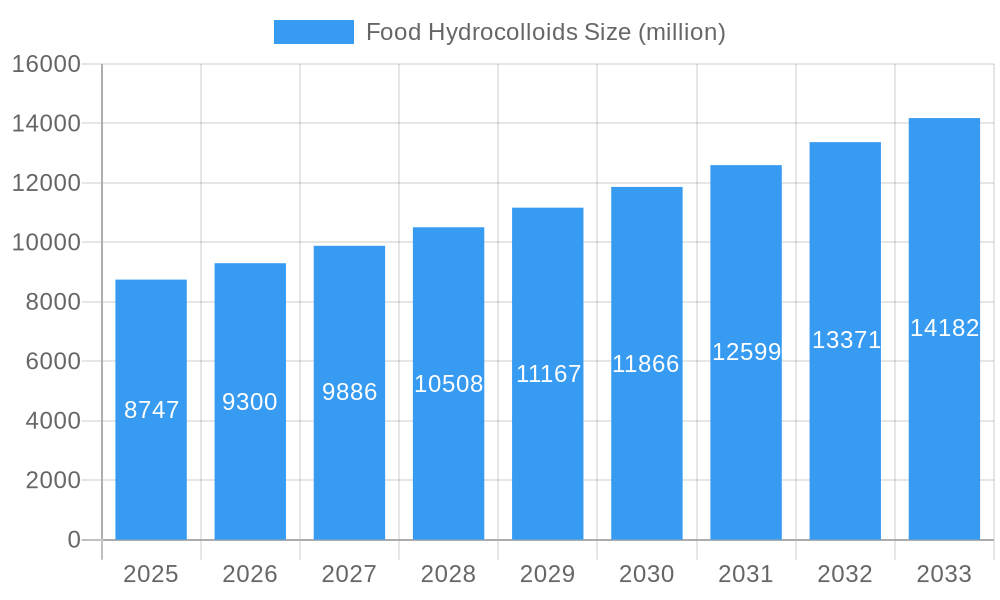
The global food hydrocolloids market is projected to reach $2760.8 million by 2025, expanding at a compound annual growth rate (CAGR) of 3.3% from 2025 to 2033. This growth is propelled by escalating demand for convenient and functional processed foods, with hydrocolloids crucial for texture, stabilization, and gelling. The consumer shift towards clean-label and natural ingredients also drives demand for plant-derived hydrocolloids. Innovations in plant-based foods and novel textures further stimulate market expansion. Despite challenges from raw material price volatility and regulatory hurdles, the market shows strong potential, particularly in regions with developing food processing industries and rising consumer spending.
Food Hydrocolloids Market Size (In Billion)
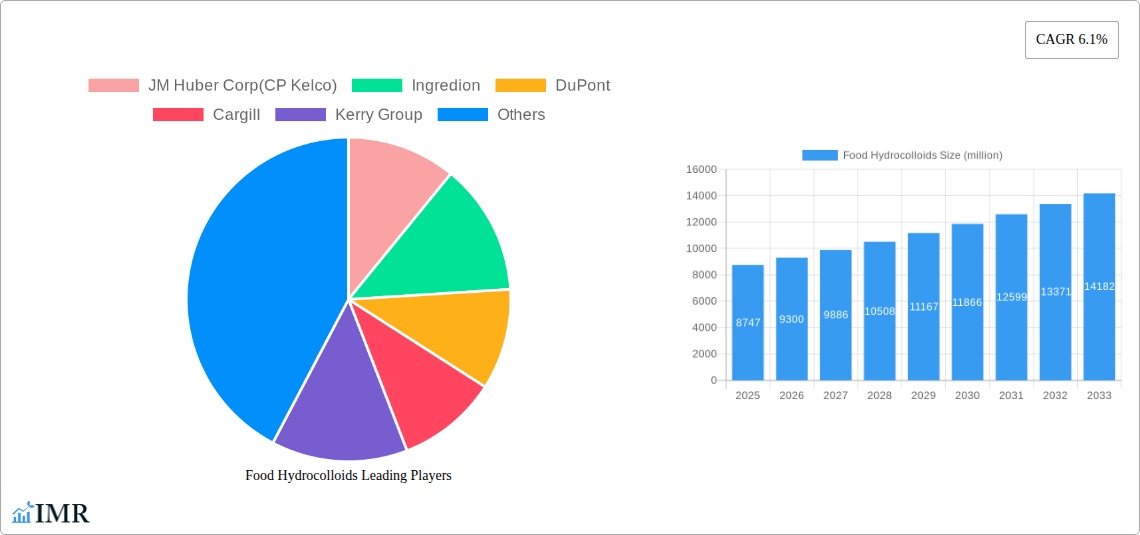
Market segmentation highlights diverse hydrocolloid types serving specific food applications. Leading companies including JM Huber Corp (CP Kelco), Ingredion, DuPont, and Cargill are prominent, supported by robust manufacturing and distribution. The Asia-Pacific region is expected to experience accelerated growth due to its expanding food processing sector and substantial consumer base. The competitive environment is shaped by continuous research and development focused on innovative, functional, and cost-effective hydrocolloid solutions. Future trends emphasize sustainability, traceability, and the utilization of renewable hydrocolloid sources.
Food Hydrocolloids Company Market Share
Food Hydrocolloids Market Report: 2019-2033
This comprehensive report provides an in-depth analysis of the global Food Hydrocolloids market, offering invaluable insights for industry professionals, investors, and strategic decision-makers. The study covers the period 2019-2033, with a base year of 2025 and a forecast period of 2025-2033. The report meticulously analyzes market dynamics, growth trends, key players, and emerging opportunities, leveraging rigorous data analysis and expert insights to provide a clear and actionable understanding of this dynamic sector. Parent market (Food Additives) and child markets (Bakery, Dairy, Confectionery, etc.) are analyzed to provide a holistic perspective.
Estimated market size for 2025: xx million
Food Hydrocolloids Market Dynamics & Structure
This section delves into the intricate structure of the Food Hydrocolloids market, examining market concentration, technological advancements, regulatory landscapes, competitive substitutions, end-user demographics, and merger & acquisition (M&A) trends. Quantitative data, such as market share percentages and M&A deal volumes, are coupled with qualitative analyses to present a nuanced understanding of the market's dynamics.
- Market Concentration: The market exhibits a moderately concentrated structure, with the top five players accounting for approximately xx% of the market share in 2025. This concentration is driven by economies of scale and significant investments in R&D.
- Technological Innovation: Continuous innovation in hydrocolloid extraction and modification techniques drives market growth. The development of novel hydrocolloids with enhanced functionalities (e.g., improved texture, stability, and health benefits) fuels product diversification.
- Regulatory Frameworks: Stringent food safety regulations and labeling requirements influence market dynamics, especially concerning the use of specific hydrocolloids in different food applications. Compliance costs can impact smaller players disproportionately.
- Competitive Product Substitutes: The Food Hydrocolloids market faces competition from other food additives and stabilizers, including synthetic polymers. Price fluctuations and consumer preference for natural ingredients influence competitive dynamics.
- End-User Demographics: The growth of the food processing industry and evolving consumer preferences (e.g., demand for healthier and convenient food products) positively impacts market demand. Changing dietary habits and health consciousness in various geographic regions play a significant role.
- M&A Trends: The Food Hydrocolloids market has witnessed a moderate level of M&A activity in recent years, with larger players acquiring smaller companies to expand their product portfolios and market reach. An estimated xx M&A deals were recorded between 2019 and 2024.
Food Hydrocolloids Growth Trends & Insights
This section provides a comprehensive analysis of the Food Hydrocolloids market's growth trajectory, encompassing market size evolution, adoption rates across various applications, technological disruptions influencing the industry, and shifts in consumer behavior. Specific metrics, such as compound annual growth rate (CAGR) and market penetration rates, are included to provide a precise understanding of the market's growth dynamics. (Detailed analysis with specific numbers and insights based on XXX data). The CAGR for the forecast period (2025-2033) is estimated at xx%. Market penetration in key segments continues to grow, driven by factors such as [Insert specific factors based on XXX data].
Dominant Regions, Countries, or Segments in Food Hydrocolloids
This section identifies the leading regions, countries, or segments driving market growth. Key drivers are highlighted using bullet points, and dominance factors are analyzed in detail, considering factors such as market share and growth potential. Detailed country-specific analysis and segmentation data would be presented here. [Detailed analysis of dominant regions/countries, including market size, growth drivers, and future outlook]. For example, [Region X] is projected to hold the largest market share due to [Reason 1] and [Reason 2].
- Economic Policies: Favorable government policies supporting the food processing industry in specific regions.
- Infrastructure: Robust infrastructure facilitating efficient food production and distribution networks.
- Consumer Preferences: Growing preference for specific food products containing hydrocolloids in targeted regions.
Food Hydrocolloids Product Landscape
This section details product innovations, applications, and performance metrics in the Food Hydrocolloids market. It highlights unique selling propositions and technological advancements driving product differentiation and market expansion. The market encompasses a wide range of hydrocolloids, including [List of specific hydrocolloids] each with unique properties and applications, enabling diverse functionalities in various food products. Recent technological advancements have led to the development of [Mention specific examples of product innovations, e.g. modified starches, new extraction methods], leading to enhanced product quality and functionality.
Key Drivers, Barriers & Challenges in Food Hydrocolloids
This section outlines the key drivers and challenges impacting the Food Hydrocolloids market.
Key Drivers:
- Growing demand for convenient and ready-to-eat foods.
- Increasing health consciousness and demand for functional foods.
- Technological advancements in hydrocolloid production and modification.
- Expansion of the food processing industry in developing economies.
Key Challenges:
- Fluctuations in raw material prices impacting production costs.
- Stringent regulatory compliance requirements.
- Intense competition from other food additives and stabilizers.
- Supply chain disruptions causing instability in hydrocolloid availability. Estimated impact on market growth: xx%.
Emerging Opportunities in Food Hydrocolloids
This section focuses on emerging trends and opportunities in the Food Hydrocolloids market, encompassing untapped markets, innovative applications, and evolving consumer preferences. Opportunities exist in the growing plant-based food market, where hydrocolloids are crucial for replicating the texture and mouthfeel of traditional products. Furthermore, the use of hydrocolloids in emerging food applications like [specific examples] presents further potential. The increasing demand for sustainable and ethically sourced ingredients also presents opportunities for companies committed to transparency and eco-friendly practices.
Growth Accelerators in the Food Hydrocolloids Industry
Technological breakthroughs, such as advanced extraction techniques and customized hydrocolloid modifications, accelerate market growth. Strategic partnerships between hydrocolloid manufacturers and food processing companies facilitate innovation and market penetration. Furthermore, the expansion into new geographic markets with untapped potential contributes significantly to long-term market expansion.
Key Players Shaping the Food Hydrocolloids Market
- JM Huber Corp (CP Kelco)
- Ingredion
- DuPont
- Cargill
- Kerry Group
- Ashland
- Hindustan Gum & Chemicals Ltd
- Kraft Foods Group Inc.
- DSM
- Jai Bharat Gum & Chemicals Ltd
- Fufeng
- Meihua
- Caremoli Group
- Behn Meyer
- Iberagar
Notable Milestones in Food Hydrocolloids Sector
- 2020: Launch of a novel hydrocolloid with improved stability and texture by [Company Name].
- 2021: Acquisition of [Company A] by [Company B], expanding the market reach of [Company B].
- 2022: Introduction of a new regulatory framework governing the use of specific hydrocolloids in [Region].
- 2023: Significant investment in R&D by [Company Name] focused on developing sustainable hydrocolloids.
- 2024: Launch of a new plant-based hydrocolloid alternative by [Company Name].
In-Depth Food Hydrocolloids Market Outlook
The Food Hydrocolloids market is poised for continued growth driven by several factors. Technological advancements in extraction and modification techniques, along with the growing demand for healthy and convenient food products, will drive market expansion. Strategic partnerships and investments in R&D will further enhance product innovation and cater to emerging market demands. The market's future potential lies in leveraging sustainability concerns and developing innovative applications to meet the changing consumer needs and preferences, ensuring a robust and expanding market in the coming years.
Food Hydrocolloids Segmentation
-
1. Application
- 1.1. Beverage
- 1.2. Dressing or Sauce
- 1.3. Jelly or Pudding
- 1.4. Dairy Products
- 1.5. Ice Cream
- 1.6. Soup
- 1.7. Processed Meat
- 1.8. Others
-
2. Type
- 2.1. Agar
- 2.2. Alginates
- 2.3. Carboxymethylcellulose and Other Cellulose Ethers
- 2.4. Carrageenan
- 2.5. Gelatin
- 2.6. Gellan Gum
- 2.7. Guar Gum
- 2.8. Gum Acacia (Gum Arabic)
- 2.9. Locust Bean Gum
- 2.10. Others
Food Hydrocolloids Segmentation By Geography
-
1. North America
- 1.1. United States
- 1.2. Canada
- 1.3. Mexico
-
2. South America
- 2.1. Brazil
- 2.2. Argentina
- 2.3. Rest of South America
-
3. Europe
- 3.1. United Kingdom
- 3.2. Germany
- 3.3. France
- 3.4. Italy
- 3.5. Spain
- 3.6. Russia
- 3.7. Benelux
- 3.8. Nordics
- 3.9. Rest of Europe
-
4. Middle East & Africa
- 4.1. Turkey
- 4.2. Israel
- 4.3. GCC
- 4.4. North Africa
- 4.5. South Africa
- 4.6. Rest of Middle East & Africa
-
5. Asia Pacific
- 5.1. China
- 5.2. India
- 5.3. Japan
- 5.4. South Korea
- 5.5. ASEAN
- 5.6. Oceania
- 5.7. Rest of Asia Pacific
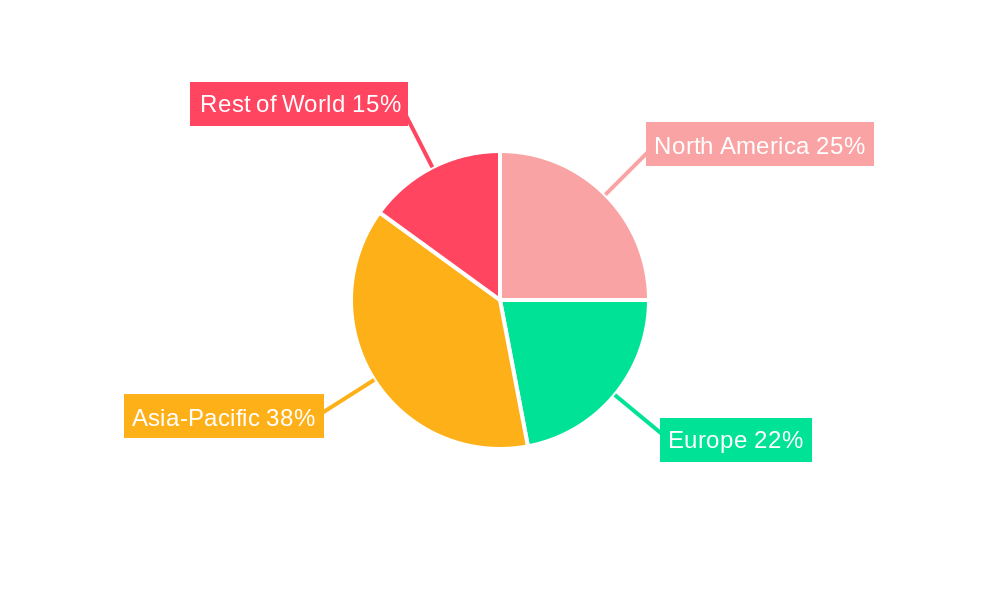
Food Hydrocolloids Regional Market Share
Geographic Coverage of Food Hydrocolloids
Food Hydrocolloids REPORT HIGHLIGHTS
| Aspects | Details |
|---|---|
| Study Period | 2020-2034 |
| Base Year | 2025 |
| Estimated Year | 2026 |
| Forecast Period | 2026-2034 |
| Historical Period | 2020-2025 |
| Growth Rate | CAGR of 3.3% from 2020-2034 |
| Segmentation |
|
Table of Contents
- 1. Introduction
- 1.1. Research Scope
- 1.2. Market Segmentation
- 1.3. Research Methodology
- 1.4. Definitions and Assumptions
- 2. Executive Summary
- 2.1. Introduction
- 3. Market Dynamics
- 3.1. Introduction
- 3.2. Market Drivers
- 3.3. Market Restrains
- 3.4. Market Trends
- 4. Market Factor Analysis
- 4.1. Porters Five Forces
- 4.2. Supply/Value Chain
- 4.3. PESTEL analysis
- 4.4. Market Entropy
- 4.5. Patent/Trademark Analysis
- 5. Global Food Hydrocolloids Analysis, Insights and Forecast, 2020-2032
- 5.1. Market Analysis, Insights and Forecast - by Application
- 5.1.1. Beverage
- 5.1.2. Dressing or Sauce
- 5.1.3. Jelly or Pudding
- 5.1.4. Dairy Products
- 5.1.5. Ice Cream
- 5.1.6. Soup
- 5.1.7. Processed Meat
- 5.1.8. Others
- 5.2. Market Analysis, Insights and Forecast - by Type
- 5.2.1. Agar
- 5.2.2. Alginates
- 5.2.3. Carboxymethylcellulose and Other Cellulose Ethers
- 5.2.4. Carrageenan
- 5.2.5. Gelatin
- 5.2.6. Gellan Gum
- 5.2.7. Guar Gum
- 5.2.8. Gum Acacia (Gum Arabic)
- 5.2.9. Locust Bean Gum
- 5.2.10. Others
- 5.3. Market Analysis, Insights and Forecast - by Region
- 5.3.1. North America
- 5.3.2. South America
- 5.3.3. Europe
- 5.3.4. Middle East & Africa
- 5.3.5. Asia Pacific
- 5.1. Market Analysis, Insights and Forecast - by Application
- 6. North America Food Hydrocolloids Analysis, Insights and Forecast, 2020-2032
- 6.1. Market Analysis, Insights and Forecast - by Application
- 6.1.1. Beverage
- 6.1.2. Dressing or Sauce
- 6.1.3. Jelly or Pudding
- 6.1.4. Dairy Products
- 6.1.5. Ice Cream
- 6.1.6. Soup
- 6.1.7. Processed Meat
- 6.1.8. Others
- 6.2. Market Analysis, Insights and Forecast - by Type
- 6.2.1. Agar
- 6.2.2. Alginates
- 6.2.3. Carboxymethylcellulose and Other Cellulose Ethers
- 6.2.4. Carrageenan
- 6.2.5. Gelatin
- 6.2.6. Gellan Gum
- 6.2.7. Guar Gum
- 6.2.8. Gum Acacia (Gum Arabic)
- 6.2.9. Locust Bean Gum
- 6.2.10. Others
- 6.1. Market Analysis, Insights and Forecast - by Application
- 7. South America Food Hydrocolloids Analysis, Insights and Forecast, 2020-2032
- 7.1. Market Analysis, Insights and Forecast - by Application
- 7.1.1. Beverage
- 7.1.2. Dressing or Sauce
- 7.1.3. Jelly or Pudding
- 7.1.4. Dairy Products
- 7.1.5. Ice Cream
- 7.1.6. Soup
- 7.1.7. Processed Meat
- 7.1.8. Others
- 7.2. Market Analysis, Insights and Forecast - by Type
- 7.2.1. Agar
- 7.2.2. Alginates
- 7.2.3. Carboxymethylcellulose and Other Cellulose Ethers
- 7.2.4. Carrageenan
- 7.2.5. Gelatin
- 7.2.6. Gellan Gum
- 7.2.7. Guar Gum
- 7.2.8. Gum Acacia (Gum Arabic)
- 7.2.9. Locust Bean Gum
- 7.2.10. Others
- 7.1. Market Analysis, Insights and Forecast - by Application
- 8. Europe Food Hydrocolloids Analysis, Insights and Forecast, 2020-2032
- 8.1. Market Analysis, Insights and Forecast - by Application
- 8.1.1. Beverage
- 8.1.2. Dressing or Sauce
- 8.1.3. Jelly or Pudding
- 8.1.4. Dairy Products
- 8.1.5. Ice Cream
- 8.1.6. Soup
- 8.1.7. Processed Meat
- 8.1.8. Others
- 8.2. Market Analysis, Insights and Forecast - by Type
- 8.2.1. Agar
- 8.2.2. Alginates
- 8.2.3. Carboxymethylcellulose and Other Cellulose Ethers
- 8.2.4. Carrageenan
- 8.2.5. Gelatin
- 8.2.6. Gellan Gum
- 8.2.7. Guar Gum
- 8.2.8. Gum Acacia (Gum Arabic)
- 8.2.9. Locust Bean Gum
- 8.2.10. Others
- 8.1. Market Analysis, Insights and Forecast - by Application
- 9. Middle East & Africa Food Hydrocolloids Analysis, Insights and Forecast, 2020-2032
- 9.1. Market Analysis, Insights and Forecast - by Application
- 9.1.1. Beverage
- 9.1.2. Dressing or Sauce
- 9.1.3. Jelly or Pudding
- 9.1.4. Dairy Products
- 9.1.5. Ice Cream
- 9.1.6. Soup
- 9.1.7. Processed Meat
- 9.1.8. Others
- 9.2. Market Analysis, Insights and Forecast - by Type
- 9.2.1. Agar
- 9.2.2. Alginates
- 9.2.3. Carboxymethylcellulose and Other Cellulose Ethers
- 9.2.4. Carrageenan
- 9.2.5. Gelatin
- 9.2.6. Gellan Gum
- 9.2.7. Guar Gum
- 9.2.8. Gum Acacia (Gum Arabic)
- 9.2.9. Locust Bean Gum
- 9.2.10. Others
- 9.1. Market Analysis, Insights and Forecast - by Application
- 10. Asia Pacific Food Hydrocolloids Analysis, Insights and Forecast, 2020-2032
- 10.1. Market Analysis, Insights and Forecast - by Application
- 10.1.1. Beverage
- 10.1.2. Dressing or Sauce
- 10.1.3. Jelly or Pudding
- 10.1.4. Dairy Products
- 10.1.5. Ice Cream
- 10.1.6. Soup
- 10.1.7. Processed Meat
- 10.1.8. Others
- 10.2. Market Analysis, Insights and Forecast - by Type
- 10.2.1. Agar
- 10.2.2. Alginates
- 10.2.3. Carboxymethylcellulose and Other Cellulose Ethers
- 10.2.4. Carrageenan
- 10.2.5. Gelatin
- 10.2.6. Gellan Gum
- 10.2.7. Guar Gum
- 10.2.8. Gum Acacia (Gum Arabic)
- 10.2.9. Locust Bean Gum
- 10.2.10. Others
- 10.1. Market Analysis, Insights and Forecast - by Application
- 11. Competitive Analysis
- 11.1. Global Market Share Analysis 2025
- 11.2. Company Profiles
- 11.2.1 JM Huber Corp(CP Kelco)
- 11.2.1.1. Overview
- 11.2.1.2. Products
- 11.2.1.3. SWOT Analysis
- 11.2.1.4. Recent Developments
- 11.2.1.5. Financials (Based on Availability)
- 11.2.2 Ingredion
- 11.2.2.1. Overview
- 11.2.2.2. Products
- 11.2.2.3. SWOT Analysis
- 11.2.2.4. Recent Developments
- 11.2.2.5. Financials (Based on Availability)
- 11.2.3 DuPont
- 11.2.3.1. Overview
- 11.2.3.2. Products
- 11.2.3.3. SWOT Analysis
- 11.2.3.4. Recent Developments
- 11.2.3.5. Financials (Based on Availability)
- 11.2.4 Cargill
- 11.2.4.1. Overview
- 11.2.4.2. Products
- 11.2.4.3. SWOT Analysis
- 11.2.4.4. Recent Developments
- 11.2.4.5. Financials (Based on Availability)
- 11.2.5 Kerry Group
- 11.2.5.1. Overview
- 11.2.5.2. Products
- 11.2.5.3. SWOT Analysis
- 11.2.5.4. Recent Developments
- 11.2.5.5. Financials (Based on Availability)
- 11.2.6 Ashland
- 11.2.6.1. Overview
- 11.2.6.2. Products
- 11.2.6.3. SWOT Analysis
- 11.2.6.4. Recent Developments
- 11.2.6.5. Financials (Based on Availability)
- 11.2.7 Hindustan Gum & Chemicals Ltd
- 11.2.7.1. Overview
- 11.2.7.2. Products
- 11.2.7.3. SWOT Analysis
- 11.2.7.4. Recent Developments
- 11.2.7.5. Financials (Based on Availability)
- 11.2.8 Kraft Foods Group Inc.
- 11.2.8.1. Overview
- 11.2.8.2. Products
- 11.2.8.3. SWOT Analysis
- 11.2.8.4. Recent Developments
- 11.2.8.5. Financials (Based on Availability)
- 11.2.9 DSM
- 11.2.9.1. Overview
- 11.2.9.2. Products
- 11.2.9.3. SWOT Analysis
- 11.2.9.4. Recent Developments
- 11.2.9.5. Financials (Based on Availability)
- 11.2.10 Jai Bharat Gum & Chemicals Ltd
- 11.2.10.1. Overview
- 11.2.10.2. Products
- 11.2.10.3. SWOT Analysis
- 11.2.10.4. Recent Developments
- 11.2.10.5. Financials (Based on Availability)
- 11.2.11 Fufeng
- 11.2.11.1. Overview
- 11.2.11.2. Products
- 11.2.11.3. SWOT Analysis
- 11.2.11.4. Recent Developments
- 11.2.11.5. Financials (Based on Availability)
- 11.2.12 Meihua
- 11.2.12.1. Overview
- 11.2.12.2. Products
- 11.2.12.3. SWOT Analysis
- 11.2.12.4. Recent Developments
- 11.2.12.5. Financials (Based on Availability)
- 11.2.13 Caremoli Group
- 11.2.13.1. Overview
- 11.2.13.2. Products
- 11.2.13.3. SWOT Analysis
- 11.2.13.4. Recent Developments
- 11.2.13.5. Financials (Based on Availability)
- 11.2.14 Behn Meyer
- 11.2.14.1. Overview
- 11.2.14.2. Products
- 11.2.14.3. SWOT Analysis
- 11.2.14.4. Recent Developments
- 11.2.14.5. Financials (Based on Availability)
- 11.2.15 Iberagar
- 11.2.15.1. Overview
- 11.2.15.2. Products
- 11.2.15.3. SWOT Analysis
- 11.2.15.4. Recent Developments
- 11.2.15.5. Financials (Based on Availability)
- 11.2.1 JM Huber Corp(CP Kelco)
List of Figures
- Figure 1: Global Food Hydrocolloids Revenue Breakdown (million, %) by Region 2025 & 2033
- Figure 2: North America Food Hydrocolloids Revenue (million), by Application 2025 & 2033
- Figure 3: North America Food Hydrocolloids Revenue Share (%), by Application 2025 & 2033
- Figure 4: North America Food Hydrocolloids Revenue (million), by Type 2025 & 2033
- Figure 5: North America Food Hydrocolloids Revenue Share (%), by Type 2025 & 2033
- Figure 6: North America Food Hydrocolloids Revenue (million), by Country 2025 & 2033
- Figure 7: North America Food Hydrocolloids Revenue Share (%), by Country 2025 & 2033
- Figure 8: South America Food Hydrocolloids Revenue (million), by Application 2025 & 2033
- Figure 9: South America Food Hydrocolloids Revenue Share (%), by Application 2025 & 2033
- Figure 10: South America Food Hydrocolloids Revenue (million), by Type 2025 & 2033
- Figure 11: South America Food Hydrocolloids Revenue Share (%), by Type 2025 & 2033
- Figure 12: South America Food Hydrocolloids Revenue (million), by Country 2025 & 2033
- Figure 13: South America Food Hydrocolloids Revenue Share (%), by Country 2025 & 2033
- Figure 14: Europe Food Hydrocolloids Revenue (million), by Application 2025 & 2033
- Figure 15: Europe Food Hydrocolloids Revenue Share (%), by Application 2025 & 2033
- Figure 16: Europe Food Hydrocolloids Revenue (million), by Type 2025 & 2033
- Figure 17: Europe Food Hydrocolloids Revenue Share (%), by Type 2025 & 2033
- Figure 18: Europe Food Hydrocolloids Revenue (million), by Country 2025 & 2033
- Figure 19: Europe Food Hydrocolloids Revenue Share (%), by Country 2025 & 2033
- Figure 20: Middle East & Africa Food Hydrocolloids Revenue (million), by Application 2025 & 2033
- Figure 21: Middle East & Africa Food Hydrocolloids Revenue Share (%), by Application 2025 & 2033
- Figure 22: Middle East & Africa Food Hydrocolloids Revenue (million), by Type 2025 & 2033
- Figure 23: Middle East & Africa Food Hydrocolloids Revenue Share (%), by Type 2025 & 2033
- Figure 24: Middle East & Africa Food Hydrocolloids Revenue (million), by Country 2025 & 2033
- Figure 25: Middle East & Africa Food Hydrocolloids Revenue Share (%), by Country 2025 & 2033
- Figure 26: Asia Pacific Food Hydrocolloids Revenue (million), by Application 2025 & 2033
- Figure 27: Asia Pacific Food Hydrocolloids Revenue Share (%), by Application 2025 & 2033
- Figure 28: Asia Pacific Food Hydrocolloids Revenue (million), by Type 2025 & 2033
- Figure 29: Asia Pacific Food Hydrocolloids Revenue Share (%), by Type 2025 & 2033
- Figure 30: Asia Pacific Food Hydrocolloids Revenue (million), by Country 2025 & 2033
- Figure 31: Asia Pacific Food Hydrocolloids Revenue Share (%), by Country 2025 & 2033
List of Tables
- Table 1: Global Food Hydrocolloids Revenue million Forecast, by Application 2020 & 2033
- Table 2: Global Food Hydrocolloids Revenue million Forecast, by Type 2020 & 2033
- Table 3: Global Food Hydrocolloids Revenue million Forecast, by Region 2020 & 2033
- Table 4: Global Food Hydrocolloids Revenue million Forecast, by Application 2020 & 2033
- Table 5: Global Food Hydrocolloids Revenue million Forecast, by Type 2020 & 2033
- Table 6: Global Food Hydrocolloids Revenue million Forecast, by Country 2020 & 2033
- Table 7: United States Food Hydrocolloids Revenue (million) Forecast, by Application 2020 & 2033
- Table 8: Canada Food Hydrocolloids Revenue (million) Forecast, by Application 2020 & 2033
- Table 9: Mexico Food Hydrocolloids Revenue (million) Forecast, by Application 2020 & 2033
- Table 10: Global Food Hydrocolloids Revenue million Forecast, by Application 2020 & 2033
- Table 11: Global Food Hydrocolloids Revenue million Forecast, by Type 2020 & 2033
- Table 12: Global Food Hydrocolloids Revenue million Forecast, by Country 2020 & 2033
- Table 13: Brazil Food Hydrocolloids Revenue (million) Forecast, by Application 2020 & 2033
- Table 14: Argentina Food Hydrocolloids Revenue (million) Forecast, by Application 2020 & 2033
- Table 15: Rest of South America Food Hydrocolloids Revenue (million) Forecast, by Application 2020 & 2033
- Table 16: Global Food Hydrocolloids Revenue million Forecast, by Application 2020 & 2033
- Table 17: Global Food Hydrocolloids Revenue million Forecast, by Type 2020 & 2033
- Table 18: Global Food Hydrocolloids Revenue million Forecast, by Country 2020 & 2033
- Table 19: United Kingdom Food Hydrocolloids Revenue (million) Forecast, by Application 2020 & 2033
- Table 20: Germany Food Hydrocolloids Revenue (million) Forecast, by Application 2020 & 2033
- Table 21: France Food Hydrocolloids Revenue (million) Forecast, by Application 2020 & 2033
- Table 22: Italy Food Hydrocolloids Revenue (million) Forecast, by Application 2020 & 2033
- Table 23: Spain Food Hydrocolloids Revenue (million) Forecast, by Application 2020 & 2033
- Table 24: Russia Food Hydrocolloids Revenue (million) Forecast, by Application 2020 & 2033
- Table 25: Benelux Food Hydrocolloids Revenue (million) Forecast, by Application 2020 & 2033
- Table 26: Nordics Food Hydrocolloids Revenue (million) Forecast, by Application 2020 & 2033
- Table 27: Rest of Europe Food Hydrocolloids Revenue (million) Forecast, by Application 2020 & 2033
- Table 28: Global Food Hydrocolloids Revenue million Forecast, by Application 2020 & 2033
- Table 29: Global Food Hydrocolloids Revenue million Forecast, by Type 2020 & 2033
- Table 30: Global Food Hydrocolloids Revenue million Forecast, by Country 2020 & 2033
- Table 31: Turkey Food Hydrocolloids Revenue (million) Forecast, by Application 2020 & 2033
- Table 32: Israel Food Hydrocolloids Revenue (million) Forecast, by Application 2020 & 2033
- Table 33: GCC Food Hydrocolloids Revenue (million) Forecast, by Application 2020 & 2033
- Table 34: North Africa Food Hydrocolloids Revenue (million) Forecast, by Application 2020 & 2033
- Table 35: South Africa Food Hydrocolloids Revenue (million) Forecast, by Application 2020 & 2033
- Table 36: Rest of Middle East & Africa Food Hydrocolloids Revenue (million) Forecast, by Application 2020 & 2033
- Table 37: Global Food Hydrocolloids Revenue million Forecast, by Application 2020 & 2033
- Table 38: Global Food Hydrocolloids Revenue million Forecast, by Type 2020 & 2033
- Table 39: Global Food Hydrocolloids Revenue million Forecast, by Country 2020 & 2033
- Table 40: China Food Hydrocolloids Revenue (million) Forecast, by Application 2020 & 2033
- Table 41: India Food Hydrocolloids Revenue (million) Forecast, by Application 2020 & 2033
- Table 42: Japan Food Hydrocolloids Revenue (million) Forecast, by Application 2020 & 2033
- Table 43: South Korea Food Hydrocolloids Revenue (million) Forecast, by Application 2020 & 2033
- Table 44: ASEAN Food Hydrocolloids Revenue (million) Forecast, by Application 2020 & 2033
- Table 45: Oceania Food Hydrocolloids Revenue (million) Forecast, by Application 2020 & 2033
- Table 46: Rest of Asia Pacific Food Hydrocolloids Revenue (million) Forecast, by Application 2020 & 2033
Frequently Asked Questions
1. What is the projected Compound Annual Growth Rate (CAGR) of the Food Hydrocolloids?
The projected CAGR is approximately 3.3%.
2. Which companies are prominent players in the Food Hydrocolloids?
Key companies in the market include JM Huber Corp(CP Kelco), Ingredion, DuPont, Cargill, Kerry Group, Ashland, Hindustan Gum & Chemicals Ltd, Kraft Foods Group Inc., DSM, Jai Bharat Gum & Chemicals Ltd, Fufeng, Meihua, Caremoli Group, Behn Meyer, Iberagar.
3. What are the main segments of the Food Hydrocolloids?
The market segments include Application, Type.
4. Can you provide details about the market size?
The market size is estimated to be USD 2760.8 million as of 2022.
5. What are some drivers contributing to market growth?
N/A
6. What are the notable trends driving market growth?
N/A
7. Are there any restraints impacting market growth?
N/A
8. Can you provide examples of recent developments in the market?
N/A
9. What pricing options are available for accessing the report?
Pricing options include single-user, multi-user, and enterprise licenses priced at USD 5900.00, USD 8850.00, and USD 11800.00 respectively.
10. Is the market size provided in terms of value or volume?
The market size is provided in terms of value, measured in million.
11. Are there any specific market keywords associated with the report?
Yes, the market keyword associated with the report is "Food Hydrocolloids," which aids in identifying and referencing the specific market segment covered.
12. How do I determine which pricing option suits my needs best?
The pricing options vary based on user requirements and access needs. Individual users may opt for single-user licenses, while businesses requiring broader access may choose multi-user or enterprise licenses for cost-effective access to the report.
13. Are there any additional resources or data provided in the Food Hydrocolloids report?
While the report offers comprehensive insights, it's advisable to review the specific contents or supplementary materials provided to ascertain if additional resources or data are available.
14. How can I stay updated on further developments or reports in the Food Hydrocolloids?
To stay informed about further developments, trends, and reports in the Food Hydrocolloids, consider subscribing to industry newsletters, following relevant companies and organizations, or regularly checking reputable industry news sources and publications.
Methodology
Step 1 - Identification of Relevant Samples Size from Population Database


Step 2 - Approaches for Defining Global Market Size (Value, Volume* & Price*)

Note*: In applicable scenarios
Step 3 - Data Sources
Primary Research
- Web Analytics
- Survey Reports
- Research Institute
- Latest Research Reports
- Opinion Leaders
Secondary Research
- Annual Reports
- White Paper
- Latest Press Release
- Industry Association
- Paid Database
- Investor Presentations

Step 4 - Data Triangulation
Involves using different sources of information in order to increase the validity of a study
These sources are likely to be stakeholders in a program - participants, other researchers, program staff, other community members, and so on.
Then we put all data in single framework & apply various statistical tools to find out the dynamic on the market.
During the analysis stage, feedback from the stakeholder groups would be compared to determine areas of agreement as well as areas of divergence