

Key Insights
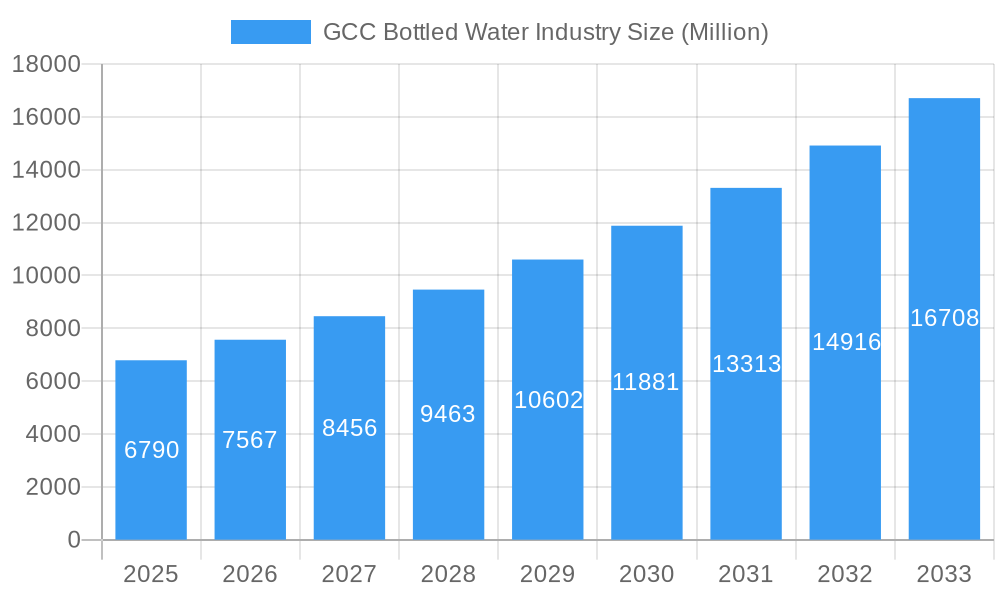
The GCC bottled water market, valued at $6.79 billion in 2025, is projected to experience robust growth, driven by rising disposable incomes, increasing health consciousness, and a preference for convenient and safe hydration options. The region's hot climate further fuels demand, particularly for still and functional waters. This market is segmented by product type (still, sparkling, functional) and distribution channels (supermarkets, convenience stores, on-trade, home delivery). Major players like Danone, Nestle, and Masafi compete fiercely, investing in innovative product offerings and expanding distribution networks to cater to evolving consumer preferences. The market's growth is expected to be influenced by factors such as government regulations on water quality, the increasing popularity of sustainable packaging, and competition from other beverage categories. Growth will likely be strongest in the functional water segment, driven by health-conscious consumers seeking added benefits. Expanding tourism and urbanization in the GCC contribute to a large and growing consumer base for bottled water. Future growth will depend on balancing price points to remain accessible while maintaining profitability. The market's sustained CAGR of 11.16% suggests significant opportunities for both established players and new entrants.
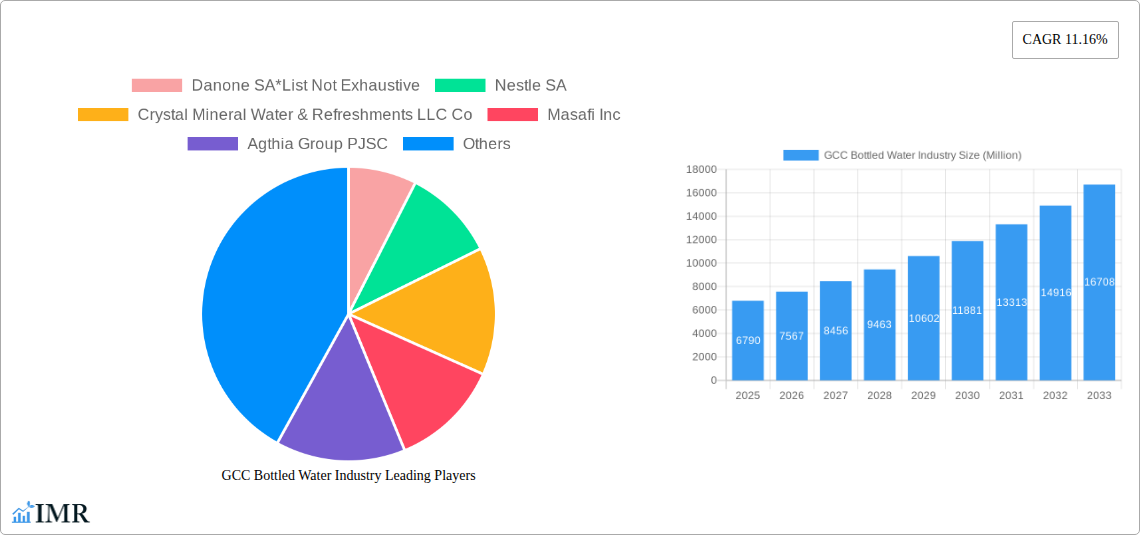
GCC Bottled Water Industry Market Size (In Billion)
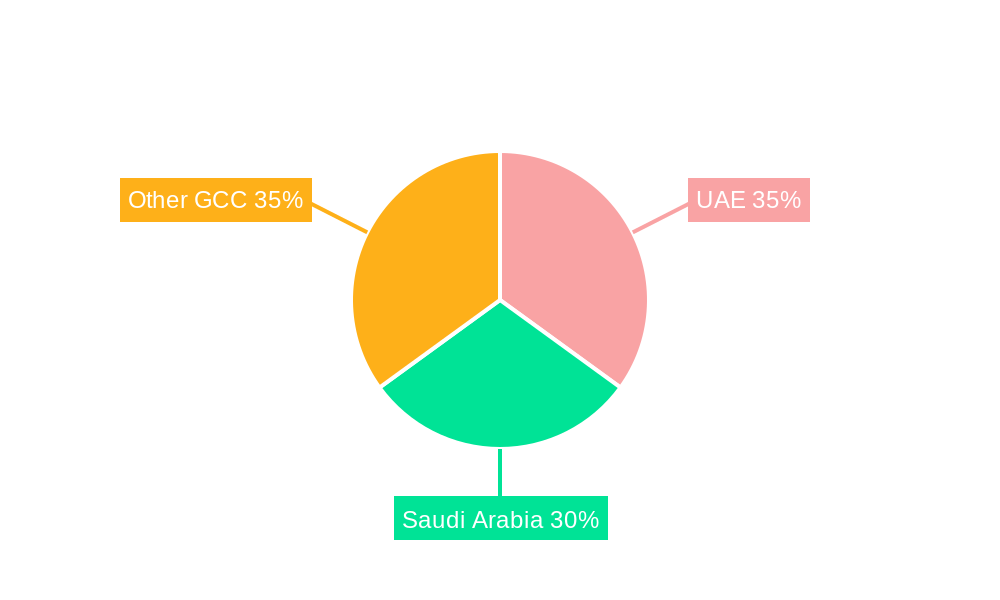
While precise regional breakdowns within the GCC are unavailable, we can project growth based on the overall CAGR. Considering the concentration of population and economic activity in certain areas, we can infer that the United Arab Emirates and Saudi Arabia will likely represent the largest segments of the market. Other countries in the region will contribute proportionately to the overall growth, fueled by similar trends such as rising incomes and health awareness. The ongoing infrastructural development and government initiatives focusing on health and wellness also positively influence the market. The competitive landscape is expected to remain dynamic, with both mergers and acquisitions, and the introduction of innovative products and packaging shaping the market's trajectory.
GCC Bottled Water Industry Company Market Share
GCC Bottled Water Industry: A Comprehensive Market Report (2019-2033)
This in-depth report provides a comprehensive analysis of the GCC bottled water industry, covering market dynamics, growth trends, competitive landscape, and future outlook. With a focus on both parent (Beverage Industry) and child (Bottled Water) markets, this report is an essential resource for industry professionals, investors, and strategic planners. The report analyzes the market from 2019 to 2024 (historical period), with a base year of 2025 and a forecast period extending to 2033. Market values are presented in million units.
Study Period: 2019–2033 Base Year: 2025 Estimated Year: 2025 Forecast Period: 2025–2033 Historical Period: 2019–2024
GCC Bottled Water Industry Market Dynamics & Structure
This section analyzes the GCC bottled water market's competitive intensity, technological advancements, regulatory landscape, substitute products, consumer demographics, and mergers and acquisitions (M&A) activity. The market is characterized by a mix of multinational corporations and local players. Market concentration is moderate, with the top five players holding approximately xx% market share in 2025. Technological innovation focuses on sustainable packaging, enhanced water purification, and functional water formulations. Regulatory frameworks vary across GCC countries, impacting product labeling, water sourcing, and distribution. Competition comes from other beverages (e.g., juices, soft drinks), while rising health consciousness fuels growth. M&A activity has been moderate in recent years, with xx deals recorded between 2019 and 2024, primarily focused on expansion and brand acquisition.
- Market Concentration: Moderate, Top 5 players hold approximately xx% market share (2025).
- Technological Drivers: Sustainable packaging, advanced filtration, functional water innovations.
- Regulatory Framework: Varies across GCC nations, influencing labeling, sourcing, and distribution.
- Competitive Substitutes: Juices, soft drinks, other beverages.
- End-User Demographics: Growing population, rising disposable incomes, health-conscious consumers.
- M&A Activity: xx deals (2019-2024), focused on expansion and brand acquisition.
GCC Bottled Water Industry Growth Trends & Insights
The GCC bottled water market has experienced steady growth over the past five years, driven by factors such as increasing population, rising disposable incomes, and changing lifestyles. The market size was valued at xx million units in 2025, with a Compound Annual Growth Rate (CAGR) of xx% during the historical period (2019-2024) and an expected CAGR of xx% during the forecast period (2025-2033). Market penetration has increased steadily, reaching approximately xx% in 2025. Technological disruptions, such as innovative packaging and smart water dispensing systems, are further fueling market expansion. Consumer behavior is shifting towards premium and functional water segments, creating new opportunities for growth.
(Detailed analysis leveraging XXX will be included in the full report)
Dominant Regions, Countries, or Segments in GCC Bottled Water Industry
The GCC bottled water market is predominantly driven by the UAE and Saudi Arabia, which collectively account for approximately xx% of the total market value in 2025. Within the product segments, Still Water remains the dominant category, capturing xx% market share, followed by Sparkling Water (xx%) and Functional Water (xx%). In terms of distribution channels, Supermarkets/Hypermarkets (xx%) and Convenience/Grocery Stores (xx%) hold the largest shares, though the On-trade channel is experiencing significant growth.
- Key Drivers: Rising population, increasing disposable incomes, urbanization, tourism, and government infrastructure development.
- UAE & Saudi Arabia Dominance: High population density, strong economic growth, and well-established retail infrastructure.
- Still Water Segment Leadership: Established consumer preference and wide availability.
- Growth Potential in On-trade Channels: Increased restaurant and hospitality sector growth.
GCC Bottled Water Industry Product Landscape
The GCC bottled water market features a wide range of products, from basic still water to enhanced and functional varieties. Innovations focus on sustainable packaging materials (e.g., recycled plastic, biodegradable options), unique flavor infusions, and added electrolytes or vitamins. Many brands emphasize source water purity and responsible sourcing practices as key selling propositions. Technological advancements in filtration and purification processes further enhance product quality and safety.
Key Drivers, Barriers & Challenges in GCC Bottled Water Industry
Key Drivers:
- Rising disposable incomes and changing lifestyles leading to increased consumption.
- Growing health awareness and preference for healthier beverages.
- Government initiatives promoting sustainable packaging and water conservation.
Key Challenges and Restraints:
- Fluctuations in raw material prices (e.g., plastic resin).
- Stringent regulatory requirements regarding water quality and labeling.
- Intense competition from both domestic and international players. This competition resulted in a price war, reducing profit margins by xx% in 2024.
Emerging Opportunities in GCC Bottled Water Industry
- Growing demand for premium and functional water varieties (e.g., alkaline water, infused waters).
- Expansion into untapped markets, particularly in smaller GCC countries.
- Increasing adoption of sustainable packaging options and eco-friendly practices.
Growth Accelerators in the GCC Bottled Water Industry Industry
Long-term growth in the GCC bottled water industry will be driven by strategic partnerships between water producers and retailers to optimize distribution and reach, along with technological breakthroughs in water purification and packaging sustainability. Moreover, market expansion into new segments (e.g., sports drinks) and leveraging e-commerce channels for efficient delivery systems are projected to accelerate future market growth.
Key Players Shaping the GCC Bottled Water Industry Market
- Danone SA
- Nestle SA
- Crystal Mineral Water & Refreshments LLC Co
- Masafi Inc
- Agthia Group PJSC
- PepsiCo Inc
- Al-Qassim Water
- New Technology Bottling Company (NTBC) KSCC
- ALGhadeer Drinking Water LLC
- Al-Rawdatain Water Bottling Co
- Al Furat Drinking Water LLC
Notable Milestones in GCC Bottled Water Industry Sector
- 2021: Introduction of a new line of eco-friendly bottled water by Masafi Inc.
- 2022: Agthia Group PJSC acquired a local bottled water company, expanding its market share.
- 2023: Implementation of stricter water quality regulations across the GCC.
- (Further milestones to be included in the full report)
In-Depth GCC Bottled Water Industry Market Outlook
The GCC bottled water market is poised for continued growth throughout the forecast period. Sustained economic development, growing urbanization, and evolving consumer preferences are creating a positive environment for industry expansion. Strategic investments in sustainable practices, innovative product development, and efficient distribution networks will be crucial for capturing market share and achieving long-term success. The market offers significant potential for both established players and new entrants who can effectively leverage technological advancements and cater to evolving consumer demands.
GCC Bottled Water Industry Segmentation
-
1. Type
- 1.1. Still Water
- 1.2. Sparkling Water
- 1.3. Functional Water
-
2. Distribution Channel
- 2.1. Supermarkets/Hypermarkets
- 2.2. Convenience/Grocery Stores
- 2.3. On-trade Channels
- 2.4. Home and Office Delivery
- 2.5. Other Distribution Channels
-
3. Geography
- 3.1. Saudi Arabia
- 3.2. United Arab Emirates
- 3.3. Kuwait
- 3.4. Qatar
- 3.5. Bahrain
- 3.6. Oman
GCC Bottled Water Industry Segmentation By Geography
- 1. Saudi Arabia
- 2. United Arab Emirates
- 3. Kuwait
- 4. Qatar
- 5. Bahrain
- 6. Oman
GCC Bottled Water Industry Regional Market Share
Geographic Coverage of GCC Bottled Water Industry
GCC Bottled Water Industry REPORT HIGHLIGHTS
| Aspects | Details |
|---|---|
| Study Period | 2020-2034 |
| Base Year | 2025 |
| Estimated Year | 2026 |
| Forecast Period | 2026-2034 |
| Historical Period | 2020-2025 |
| Growth Rate | CAGR of 11.16% from 2020-2034 |
| Segmentation |
|
Table of Contents
- 1. Introduction
- 1.1. Research Scope
- 1.2. Market Segmentation
- 1.3. Research Objective
- 1.4. Definitions and Assumptions
- 2. Executive Summary
- 2.1. Market Snapshot
- 3. Market Dynamics
- 3.1. Market Drivers
- 3.2. Market Restrains
- 3.3. Market Trends
- 3.4. Market Opportunities
- 4. Market Factor Analysis
- 4.1. Porters Five Forces
- 4.1.1. Bargaining Power of Suppliers
- 4.1.2. Bargaining Power of Buyers
- 4.1.3. Threat of New Entrants
- 4.1.4. Threat of Substitutes
- 4.1.5. Competitive Rivalry
- 4.2. PESTEL analysis
- 4.3. BCG Analysis
- 4.3.1. Stars (High Growth, High Market Share)
- 4.3.2. Cash Cows (Low Growth, High Market Share)
- 4.3.3. Question Mark (High Growth, Low Market Share)
- 4.3.4. Dogs (Low Growth, Low Market Share)
- 4.4. Ansoff Matrix Analysis
- 4.5. Supply Chain Analysis
- 4.6. Regulatory Landscape
- 4.7. Current Market Potential and Opportunity Assessment (TAM–SAM–SOM Framework)
- 4.8. IMR Analyst Note
- 4.1. Porters Five Forces
- 5. Market Analysis, Insights and Forecast 2021-2033
- 5.1. Market Analysis, Insights and Forecast - by Type
- 5.1.1. Still Water
- 5.1.2. Sparkling Water
- 5.1.3. Functional Water
- 5.2. Market Analysis, Insights and Forecast - by Distribution Channel
- 5.2.1. Supermarkets/Hypermarkets
- 5.2.2. Convenience/Grocery Stores
- 5.2.3. On-trade Channels
- 5.2.4. Home and Office Delivery
- 5.2.5. Other Distribution Channels
- 5.3. Market Analysis, Insights and Forecast - by Geography
- 5.3.1. Saudi Arabia
- 5.3.2. United Arab Emirates
- 5.3.3. Kuwait
- 5.3.4. Qatar
- 5.3.5. Bahrain
- 5.3.6. Oman
- 5.4. Market Analysis, Insights and Forecast - by Region
- 5.4.1. Saudi Arabia
- 5.4.2. United Arab Emirates
- 5.4.3. Kuwait
- 5.4.4. Qatar
- 5.4.5. Bahrain
- 5.4.6. Oman
- 5.1. Market Analysis, Insights and Forecast - by Type
- 6. Global GCC Bottled Water Industry Analysis, Insights and Forecast, 2021-2033
- 6.1. Market Analysis, Insights and Forecast - by Type
- 6.1.1. Still Water
- 6.1.2. Sparkling Water
- 6.1.3. Functional Water
- 6.2. Market Analysis, Insights and Forecast - by Distribution Channel
- 6.2.1. Supermarkets/Hypermarkets
- 6.2.2. Convenience/Grocery Stores
- 6.2.3. On-trade Channels
- 6.2.4. Home and Office Delivery
- 6.2.5. Other Distribution Channels
- 6.3. Market Analysis, Insights and Forecast - by Geography
- 6.3.1. Saudi Arabia
- 6.3.2. United Arab Emirates
- 6.3.3. Kuwait
- 6.3.4. Qatar
- 6.3.5. Bahrain
- 6.3.6. Oman
- 6.1. Market Analysis, Insights and Forecast - by Type
- 7. Saudi Arabia GCC Bottled Water Industry Analysis, Insights and Forecast, 2020-2032
- 7.1. Market Analysis, Insights and Forecast - by Type
- 7.1.1. Still Water
- 7.1.2. Sparkling Water
- 7.1.3. Functional Water
- 7.2. Market Analysis, Insights and Forecast - by Distribution Channel
- 7.2.1. Supermarkets/Hypermarkets
- 7.2.2. Convenience/Grocery Stores
- 7.2.3. On-trade Channels
- 7.2.4. Home and Office Delivery
- 7.2.5. Other Distribution Channels
- 7.3. Market Analysis, Insights and Forecast - by Geography
- 7.3.1. Saudi Arabia
- 7.3.2. United Arab Emirates
- 7.3.3. Kuwait
- 7.3.4. Qatar
- 7.3.5. Bahrain
- 7.3.6. Oman
- 7.1. Market Analysis, Insights and Forecast - by Type
- 8. United Arab Emirates GCC Bottled Water Industry Analysis, Insights and Forecast, 2020-2032
- 8.1. Market Analysis, Insights and Forecast - by Type
- 8.1.1. Still Water
- 8.1.2. Sparkling Water
- 8.1.3. Functional Water
- 8.2. Market Analysis, Insights and Forecast - by Distribution Channel
- 8.2.1. Supermarkets/Hypermarkets
- 8.2.2. Convenience/Grocery Stores
- 8.2.3. On-trade Channels
- 8.2.4. Home and Office Delivery
- 8.2.5. Other Distribution Channels
- 8.3. Market Analysis, Insights and Forecast - by Geography
- 8.3.1. Saudi Arabia
- 8.3.2. United Arab Emirates
- 8.3.3. Kuwait
- 8.3.4. Qatar
- 8.3.5. Bahrain
- 8.3.6. Oman
- 8.1. Market Analysis, Insights and Forecast - by Type
- 9. Kuwait GCC Bottled Water Industry Analysis, Insights and Forecast, 2020-2032
- 9.1. Market Analysis, Insights and Forecast - by Type
- 9.1.1. Still Water
- 9.1.2. Sparkling Water
- 9.1.3. Functional Water
- 9.2. Market Analysis, Insights and Forecast - by Distribution Channel
- 9.2.1. Supermarkets/Hypermarkets
- 9.2.2. Convenience/Grocery Stores
- 9.2.3. On-trade Channels
- 9.2.4. Home and Office Delivery
- 9.2.5. Other Distribution Channels
- 9.3. Market Analysis, Insights and Forecast - by Geography
- 9.3.1. Saudi Arabia
- 9.3.2. United Arab Emirates
- 9.3.3. Kuwait
- 9.3.4. Qatar
- 9.3.5. Bahrain
- 9.3.6. Oman
- 9.1. Market Analysis, Insights and Forecast - by Type
- 10. Qatar GCC Bottled Water Industry Analysis, Insights and Forecast, 2020-2032
- 10.1. Market Analysis, Insights and Forecast - by Type
- 10.1.1. Still Water
- 10.1.2. Sparkling Water
- 10.1.3. Functional Water
- 10.2. Market Analysis, Insights and Forecast - by Distribution Channel
- 10.2.1. Supermarkets/Hypermarkets
- 10.2.2. Convenience/Grocery Stores
- 10.2.3. On-trade Channels
- 10.2.4. Home and Office Delivery
- 10.2.5. Other Distribution Channels
- 10.3. Market Analysis, Insights and Forecast - by Geography
- 10.3.1. Saudi Arabia
- 10.3.2. United Arab Emirates
- 10.3.3. Kuwait
- 10.3.4. Qatar
- 10.3.5. Bahrain
- 10.3.6. Oman
- 10.1. Market Analysis, Insights and Forecast - by Type
- 11. Bahrain GCC Bottled Water Industry Analysis, Insights and Forecast, 2020-2032
- 11.1. Market Analysis, Insights and Forecast - by Type
- 11.1.1. Still Water
- 11.1.2. Sparkling Water
- 11.1.3. Functional Water
- 11.2. Market Analysis, Insights and Forecast - by Distribution Channel
- 11.2.1. Supermarkets/Hypermarkets
- 11.2.2. Convenience/Grocery Stores
- 11.2.3. On-trade Channels
- 11.2.4. Home and Office Delivery
- 11.2.5. Other Distribution Channels
- 11.3. Market Analysis, Insights and Forecast - by Geography
- 11.3.1. Saudi Arabia
- 11.3.2. United Arab Emirates
- 11.3.3. Kuwait
- 11.3.4. Qatar
- 11.3.5. Bahrain
- 11.3.6. Oman
- 11.1. Market Analysis, Insights and Forecast - by Type
- 12. Oman GCC Bottled Water Industry Analysis, Insights and Forecast, 2020-2032
- 12.1. Market Analysis, Insights and Forecast - by Type
- 12.1.1. Still Water
- 12.1.2. Sparkling Water
- 12.1.3. Functional Water
- 12.2. Market Analysis, Insights and Forecast - by Distribution Channel
- 12.2.1. Supermarkets/Hypermarkets
- 12.2.2. Convenience/Grocery Stores
- 12.2.3. On-trade Channels
- 12.2.4. Home and Office Delivery
- 12.2.5. Other Distribution Channels
- 12.3. Market Analysis, Insights and Forecast - by Geography
- 12.3.1. Saudi Arabia
- 12.3.2. United Arab Emirates
- 12.3.3. Kuwait
- 12.3.4. Qatar
- 12.3.5. Bahrain
- 12.3.6. Oman
- 12.1. Market Analysis, Insights and Forecast - by Type
- 13. Competitive Analysis
- 13.1. Company Profiles
- 13.1.1 Danone SA*List Not Exhaustive
- 13.1.1.1. Company Overview
- 13.1.1.2. Products
- 13.1.1.3. Company Financials
- 13.1.1.4. SWOT Analysis
- 13.1.2 Nestle SA
- 13.1.2.1. Company Overview
- 13.1.2.2. Products
- 13.1.2.3. Company Financials
- 13.1.2.4. SWOT Analysis
- 13.1.3 Crystal Mineral Water & Refreshments LLC Co
- 13.1.3.1. Company Overview
- 13.1.3.2. Products
- 13.1.3.3. Company Financials
- 13.1.3.4. SWOT Analysis
- 13.1.4 Masafi Inc
- 13.1.4.1. Company Overview
- 13.1.4.2. Products
- 13.1.4.3. Company Financials
- 13.1.4.4. SWOT Analysis
- 13.1.5 Agthia Group PJSC
- 13.1.5.1. Company Overview
- 13.1.5.2. Products
- 13.1.5.3. Company Financials
- 13.1.5.4. SWOT Analysis
- 13.1.6 PepsiCo Inc
- 13.1.6.1. Company Overview
- 13.1.6.2. Products
- 13.1.6.3. Company Financials
- 13.1.6.4. SWOT Analysis
- 13.1.7 Al-Qassim Water
- 13.1.7.1. Company Overview
- 13.1.7.2. Products
- 13.1.7.3. Company Financials
- 13.1.7.4. SWOT Analysis
- 13.1.8 New Technology Bottling Company (NTBC) KSCC
- 13.1.8.1. Company Overview
- 13.1.8.2. Products
- 13.1.8.3. Company Financials
- 13.1.8.4. SWOT Analysis
- 13.1.9 ALGhadeer Drinking Water LLC
- 13.1.9.1. Company Overview
- 13.1.9.2. Products
- 13.1.9.3. Company Financials
- 13.1.9.4. SWOT Analysis
- 13.1.10 Al-Rawdatain Water Bottling Co
- 13.1.10.1. Company Overview
- 13.1.10.2. Products
- 13.1.10.3. Company Financials
- 13.1.10.4. SWOT Analysis
- 13.1.11 Al Furat Drinking Water LLC
- 13.1.11.1. Company Overview
- 13.1.11.2. Products
- 13.1.11.3. Company Financials
- 13.1.11.4. SWOT Analysis
- 13.1.1 Danone SA*List Not Exhaustive
- 13.2. Market Entropy
- 13.2.1 Company's Key Areas Served
- 13.2.2 Recent Developments
- 13.3. Company Market Share Analysis 2025
- 13.3.1 Top 5 Companies Market Share Analysis
- 13.3.2 Top 3 Companies Market Share Analysis
- 13.4. List of Potential Customers
- 14. Research Methodology
List of Figures
- Figure 1: Global GCC Bottled Water Industry Revenue Breakdown (Million, %) by Region 2025 & 2033
- Figure 2: Saudi Arabia GCC Bottled Water Industry Revenue (Million), by Type 2025 & 2033
- Figure 3: Saudi Arabia GCC Bottled Water Industry Revenue Share (%), by Type 2025 & 2033
- Figure 4: Saudi Arabia GCC Bottled Water Industry Revenue (Million), by Distribution Channel 2025 & 2033
- Figure 5: Saudi Arabia GCC Bottled Water Industry Revenue Share (%), by Distribution Channel 2025 & 2033
- Figure 6: Saudi Arabia GCC Bottled Water Industry Revenue (Million), by Geography 2025 & 2033
- Figure 7: Saudi Arabia GCC Bottled Water Industry Revenue Share (%), by Geography 2025 & 2033
- Figure 8: Saudi Arabia GCC Bottled Water Industry Revenue (Million), by Country 2025 & 2033
- Figure 9: Saudi Arabia GCC Bottled Water Industry Revenue Share (%), by Country 2025 & 2033
- Figure 10: United Arab Emirates GCC Bottled Water Industry Revenue (Million), by Type 2025 & 2033
- Figure 11: United Arab Emirates GCC Bottled Water Industry Revenue Share (%), by Type 2025 & 2033
- Figure 12: United Arab Emirates GCC Bottled Water Industry Revenue (Million), by Distribution Channel 2025 & 2033
- Figure 13: United Arab Emirates GCC Bottled Water Industry Revenue Share (%), by Distribution Channel 2025 & 2033
- Figure 14: United Arab Emirates GCC Bottled Water Industry Revenue (Million), by Geography 2025 & 2033
- Figure 15: United Arab Emirates GCC Bottled Water Industry Revenue Share (%), by Geography 2025 & 2033
- Figure 16: United Arab Emirates GCC Bottled Water Industry Revenue (Million), by Country 2025 & 2033
- Figure 17: United Arab Emirates GCC Bottled Water Industry Revenue Share (%), by Country 2025 & 2033
- Figure 18: Kuwait GCC Bottled Water Industry Revenue (Million), by Type 2025 & 2033
- Figure 19: Kuwait GCC Bottled Water Industry Revenue Share (%), by Type 2025 & 2033
- Figure 20: Kuwait GCC Bottled Water Industry Revenue (Million), by Distribution Channel 2025 & 2033
- Figure 21: Kuwait GCC Bottled Water Industry Revenue Share (%), by Distribution Channel 2025 & 2033
- Figure 22: Kuwait GCC Bottled Water Industry Revenue (Million), by Geography 2025 & 2033
- Figure 23: Kuwait GCC Bottled Water Industry Revenue Share (%), by Geography 2025 & 2033
- Figure 24: Kuwait GCC Bottled Water Industry Revenue (Million), by Country 2025 & 2033
- Figure 25: Kuwait GCC Bottled Water Industry Revenue Share (%), by Country 2025 & 2033
- Figure 26: Qatar GCC Bottled Water Industry Revenue (Million), by Type 2025 & 2033
- Figure 27: Qatar GCC Bottled Water Industry Revenue Share (%), by Type 2025 & 2033
- Figure 28: Qatar GCC Bottled Water Industry Revenue (Million), by Distribution Channel 2025 & 2033
- Figure 29: Qatar GCC Bottled Water Industry Revenue Share (%), by Distribution Channel 2025 & 2033
- Figure 30: Qatar GCC Bottled Water Industry Revenue (Million), by Geography 2025 & 2033
- Figure 31: Qatar GCC Bottled Water Industry Revenue Share (%), by Geography 2025 & 2033
- Figure 32: Qatar GCC Bottled Water Industry Revenue (Million), by Country 2025 & 2033
- Figure 33: Qatar GCC Bottled Water Industry Revenue Share (%), by Country 2025 & 2033
- Figure 34: Bahrain GCC Bottled Water Industry Revenue (Million), by Type 2025 & 2033
- Figure 35: Bahrain GCC Bottled Water Industry Revenue Share (%), by Type 2025 & 2033
- Figure 36: Bahrain GCC Bottled Water Industry Revenue (Million), by Distribution Channel 2025 & 2033
- Figure 37: Bahrain GCC Bottled Water Industry Revenue Share (%), by Distribution Channel 2025 & 2033
- Figure 38: Bahrain GCC Bottled Water Industry Revenue (Million), by Geography 2025 & 2033
- Figure 39: Bahrain GCC Bottled Water Industry Revenue Share (%), by Geography 2025 & 2033
- Figure 40: Bahrain GCC Bottled Water Industry Revenue (Million), by Country 2025 & 2033
- Figure 41: Bahrain GCC Bottled Water Industry Revenue Share (%), by Country 2025 & 2033
- Figure 42: Oman GCC Bottled Water Industry Revenue (Million), by Type 2025 & 2033
- Figure 43: Oman GCC Bottled Water Industry Revenue Share (%), by Type 2025 & 2033
- Figure 44: Oman GCC Bottled Water Industry Revenue (Million), by Distribution Channel 2025 & 2033
- Figure 45: Oman GCC Bottled Water Industry Revenue Share (%), by Distribution Channel 2025 & 2033
- Figure 46: Oman GCC Bottled Water Industry Revenue (Million), by Geography 2025 & 2033
- Figure 47: Oman GCC Bottled Water Industry Revenue Share (%), by Geography 2025 & 2033
- Figure 48: Oman GCC Bottled Water Industry Revenue (Million), by Country 2025 & 2033
- Figure 49: Oman GCC Bottled Water Industry Revenue Share (%), by Country 2025 & 2033
List of Tables
- Table 1: Global GCC Bottled Water Industry Revenue Million Forecast, by Type 2020 & 2033
- Table 2: Global GCC Bottled Water Industry Revenue Million Forecast, by Distribution Channel 2020 & 2033
- Table 3: Global GCC Bottled Water Industry Revenue Million Forecast, by Geography 2020 & 2033
- Table 4: Global GCC Bottled Water Industry Revenue Million Forecast, by Region 2020 & 2033
- Table 5: Global GCC Bottled Water Industry Revenue Million Forecast, by Type 2020 & 2033
- Table 6: Global GCC Bottled Water Industry Revenue Million Forecast, by Distribution Channel 2020 & 2033
- Table 7: Global GCC Bottled Water Industry Revenue Million Forecast, by Geography 2020 & 2033
- Table 8: Global GCC Bottled Water Industry Revenue Million Forecast, by Country 2020 & 2033
- Table 9: Global GCC Bottled Water Industry Revenue Million Forecast, by Type 2020 & 2033
- Table 10: Global GCC Bottled Water Industry Revenue Million Forecast, by Distribution Channel 2020 & 2033
- Table 11: Global GCC Bottled Water Industry Revenue Million Forecast, by Geography 2020 & 2033
- Table 12: Global GCC Bottled Water Industry Revenue Million Forecast, by Country 2020 & 2033
- Table 13: Global GCC Bottled Water Industry Revenue Million Forecast, by Type 2020 & 2033
- Table 14: Global GCC Bottled Water Industry Revenue Million Forecast, by Distribution Channel 2020 & 2033
- Table 15: Global GCC Bottled Water Industry Revenue Million Forecast, by Geography 2020 & 2033
- Table 16: Global GCC Bottled Water Industry Revenue Million Forecast, by Country 2020 & 2033
- Table 17: Global GCC Bottled Water Industry Revenue Million Forecast, by Type 2020 & 2033
- Table 18: Global GCC Bottled Water Industry Revenue Million Forecast, by Distribution Channel 2020 & 2033
- Table 19: Global GCC Bottled Water Industry Revenue Million Forecast, by Geography 2020 & 2033
- Table 20: Global GCC Bottled Water Industry Revenue Million Forecast, by Country 2020 & 2033
- Table 21: Global GCC Bottled Water Industry Revenue Million Forecast, by Type 2020 & 2033
- Table 22: Global GCC Bottled Water Industry Revenue Million Forecast, by Distribution Channel 2020 & 2033
- Table 23: Global GCC Bottled Water Industry Revenue Million Forecast, by Geography 2020 & 2033
- Table 24: Global GCC Bottled Water Industry Revenue Million Forecast, by Country 2020 & 2033
- Table 25: Global GCC Bottled Water Industry Revenue Million Forecast, by Type 2020 & 2033
- Table 26: Global GCC Bottled Water Industry Revenue Million Forecast, by Distribution Channel 2020 & 2033
- Table 27: Global GCC Bottled Water Industry Revenue Million Forecast, by Geography 2020 & 2033
- Table 28: Global GCC Bottled Water Industry Revenue Million Forecast, by Country 2020 & 2033
Frequently Asked Questions
1. What is the projected Compound Annual Growth Rate (CAGR) of the GCC Bottled Water Industry?
The projected CAGR is approximately 11.16%.
2. Which companies are prominent players in the GCC Bottled Water Industry?
Key companies in the market include Danone SA*List Not Exhaustive, Nestle SA, Crystal Mineral Water & Refreshments LLC Co, Masafi Inc, Agthia Group PJSC, PepsiCo Inc, Al-Qassim Water, New Technology Bottling Company (NTBC) KSCC, ALGhadeer Drinking Water LLC, Al-Rawdatain Water Bottling Co, Al Furat Drinking Water LLC.
3. What are the main segments of the GCC Bottled Water Industry?
The market segments include Type, Distribution Channel, Geography.
4. Can you provide details about the market size?
The market size is estimated to be USD 6.79 Million as of 2022.
5. What are some drivers contributing to market growth?
Growth In Foodservice Expenditure and Tourism Sector; Premiumization with the Growth of Fortified and Flavored Water.
6. What are the notable trends driving market growth?
Scarce Water Resources Leading to Increasing Dependency on Packaged Drinking Water.
7. Are there any restraints impacting market growth?
Concerns Regarding Plastic Waste and the Rising Inclination Toward Tap Water.
8. Can you provide examples of recent developments in the market?
N/A
9. What pricing options are available for accessing the report?
Pricing options include single-user, multi-user, and enterprise licenses priced at USD 4750, USD 5250, and USD 8750 respectively.
10. Is the market size provided in terms of value or volume?
The market size is provided in terms of value, measured in Million.
11. Are there any specific market keywords associated with the report?
Yes, the market keyword associated with the report is "GCC Bottled Water Industry," which aids in identifying and referencing the specific market segment covered.
12. How do I determine which pricing option suits my needs best?
The pricing options vary based on user requirements and access needs. Individual users may opt for single-user licenses, while businesses requiring broader access may choose multi-user or enterprise licenses for cost-effective access to the report.
13. Are there any additional resources or data provided in the GCC Bottled Water Industry report?
While the report offers comprehensive insights, it's advisable to review the specific contents or supplementary materials provided to ascertain if additional resources or data are available.
14. How can I stay updated on further developments or reports in the GCC Bottled Water Industry?
To stay informed about further developments, trends, and reports in the GCC Bottled Water Industry, consider subscribing to industry newsletters, following relevant companies and organizations, or regularly checking reputable industry news sources and publications.
Methodology
Step 1 - Identification of Relevant Samples Size from Population Database


Step 2 - Approaches for Defining Global Market Size (Value, Volume* & Price*)

Note*: In applicable scenarios
Step 3 - Data Sources
Primary Research
- Web Analytics
- Survey Reports
- Research Institute
- Latest Research Reports
- Opinion Leaders
Secondary Research
- Annual Reports
- White Paper
- Latest Press Release
- Industry Association
- Paid Database
- Investor Presentations

Step 4 - Data Triangulation
Involves using different sources of information in order to increase the validity of a study
These sources are likely to be stakeholders in a program - participants, other researchers, program staff, other community members, and so on.
Then we put all data in single framework & apply various statistical tools to find out the dynamic on the market.
During the analysis stage, feedback from the stakeholder groups would be compared to determine areas of agreement as well as areas of divergence