

Key Insights
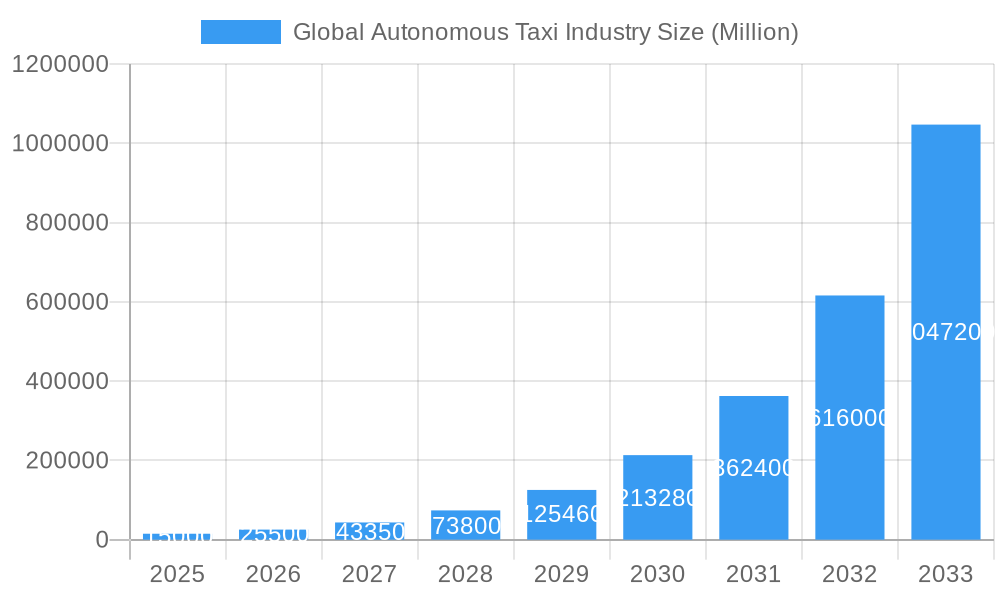
The global autonomous taxi market is poised for significant expansion, driven by rapid technological progress, growing urbanization, and a demand for efficient mobility solutions. With a projected Compound Annual Growth Rate (CAGR) of 99.1% from a market size of $0.61 billion in the base year 2025, the industry anticipates substantial growth through 2033. Key catalysts include declining autonomous vehicle technology costs, supportive regulatory frameworks, and the integration of electric and hybrid powertrains. Advancements in sensor technology, mapping, and the proliferation of ride-hailing services further propel market acceleration. Emerging challenges, such as safety perceptions, regulatory complexities, and substantial initial investments, are being addressed through innovation and strategic deployment.
Global Autonomous Taxi Industry Market Size (In Million)
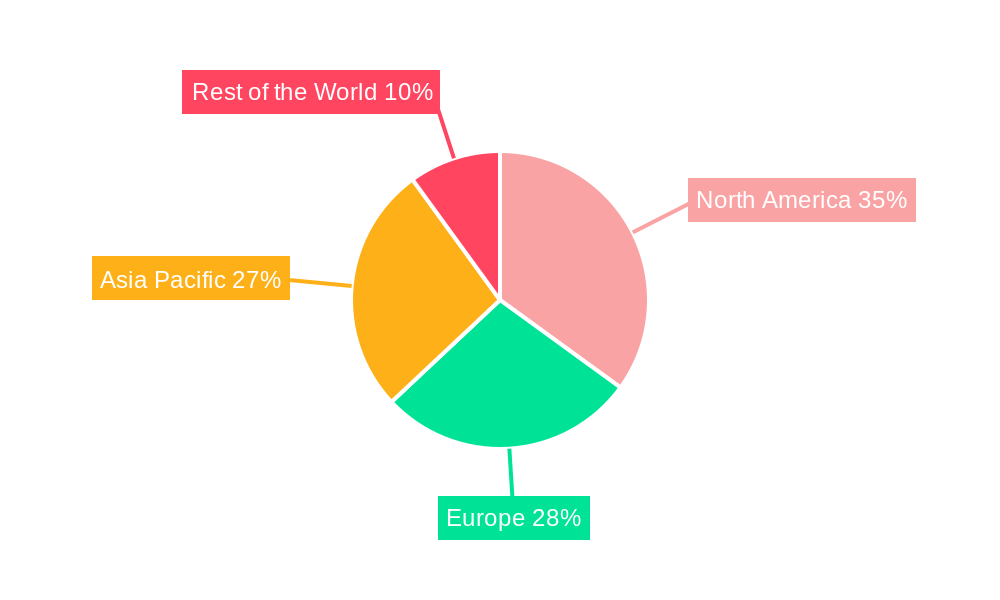
Market segmentation highlights robust growth in rental and station-based services, with increasing adoption of higher autonomy levels. Electric propulsion systems are leading, and the market encompasses both passenger and goods transportation vehicles, including cars and shuttle vans. The competitive arena features established automotive leaders, technology titans, and specialized autonomous driving firms engaged in strategic alliances, innovation, and global expansion. While North America and Europe currently dominate, the Asia-Pacific region, particularly China, is expected to witness exceptional growth due to its extensive population and evolving infrastructure. Continued advancements in safety, reliability, and favorable regulatory landscapes will be pivotal in shaping the future of this dynamic sector. Strategic emphasis on addressing safety concerns and enhancing consumer acceptance will be paramount for market success.
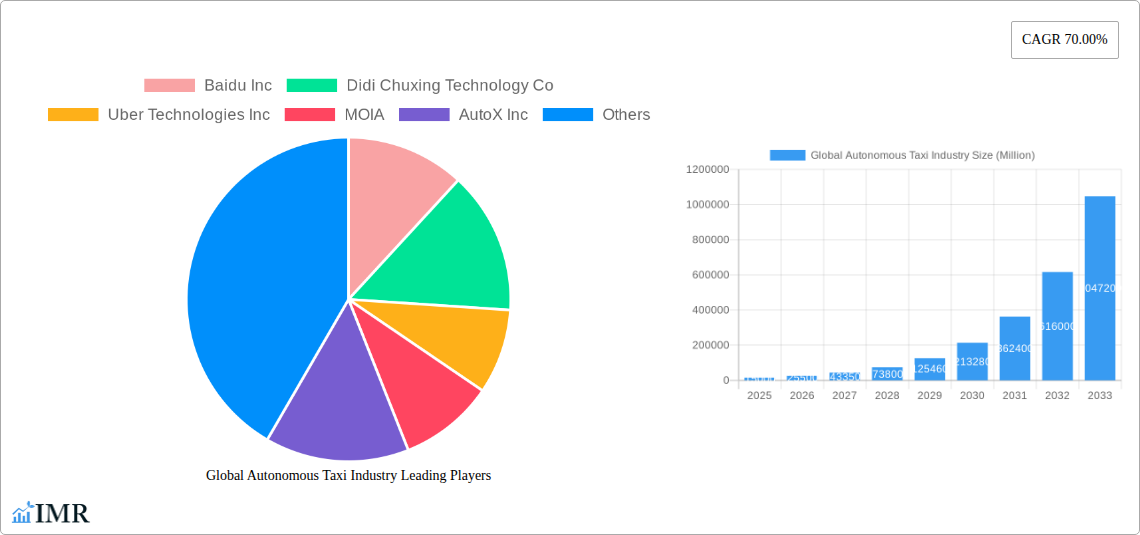
Global Autonomous Taxi Industry Company Market Share
Global Autonomous Taxi Industry Market Report: 2019-2033
This comprehensive report provides a detailed analysis of the global autonomous taxi industry, encompassing market dynamics, growth trends, regional landscapes, and key players. The study period covers 2019-2033, with a base year of 2025 and a forecast period of 2025-2033. This report is crucial for investors, industry professionals, and strategists seeking to understand and capitalize on the burgeoning opportunities within this transformative sector. Market values are presented in million units.
Global Autonomous Taxi Industry Market Dynamics & Structure
The global autonomous taxi market is experiencing rapid growth, driven by technological advancements, evolving consumer preferences, and supportive government policies. However, significant challenges remain, including regulatory hurdles, safety concerns, and infrastructure limitations. Market concentration is currently moderate, with several key players vying for dominance, but the landscape is expected to consolidate as the industry matures. The parent market is the broader transportation sector, while the child market includes ride-hailing services and fleet management.
- Market Concentration: Moderately concentrated, with top 5 players holding approximately xx% market share in 2024.
- Technological Innovation Drivers: Advancements in AI, sensor technology (LiDAR, radar, cameras), and high-definition mapping are crucial drivers.
- Regulatory Frameworks: Varying regulations across regions create complexities and affect market entry.
- Competitive Product Substitutes: Traditional taxis and ride-sharing services remain significant competitors.
- End-User Demographics: Primarily urban populations with high disposable incomes and a preference for convenient, efficient transportation.
- M&A Trends: A significant increase in mergers and acquisitions (M&A) activity is anticipated (xx deals projected in the forecast period). Consolidation is expected to accelerate. Innovation barriers include high R&D costs and the complexity of integrating diverse technologies.
Global Autonomous Taxi Industry Growth Trends & Insights
The global autonomous taxi market is projected to witness substantial growth, driven by increasing demand for convenient and efficient transportation, coupled with the continuous improvement of autonomous vehicle technology. The adoption rate is anticipated to accelerate during the forecast period, particularly in urban areas with robust infrastructure. Technological disruptions, such as the development of more sophisticated sensor systems and AI algorithms, are further fueling market expansion. Shifting consumer preferences toward on-demand mobility and shared transportation are also impacting growth.
- Market Size Evolution: The market is projected to grow from xx million units in 2024 to xx million units in 2033, representing a CAGR of xx%.
- Adoption Rates: Adoption rates are expected to increase significantly, reaching xx% penetration in key urban markets by 2033.
- Technological Disruptions: Advancements in battery technology, sensor fusion, and edge computing will reshape the market.
- Consumer Behavior Shifts: Growing acceptance of autonomous vehicles and a preference for ride-sharing contribute to growth.
Dominant Regions, Countries, or Segments in Global Autonomous Taxi Industry
North America and Europe currently lead the autonomous taxi market, driven by strong technological advancements, supportive regulatory environments, and high consumer adoption rates. Within these regions, specific cities with well-developed infrastructure (e.g., San Francisco, London) are experiencing faster growth. The rental-based service type and electric vehicle propulsion are currently dominant segments. Level 4 autonomy is gaining traction, although widespread deployment of fully driverless vehicles is still some years away.
- Leading Region: North America (xx% market share in 2024).
- Key Drivers (North America): Strong investment in R&D, supportive government policies, and advanced technological infrastructure.
- Leading Segment (Service Type): Rental-based (xx% market share in 2024).
- Key Drivers (Rental-Based): Flexibility and convenience for users.
- Leading Segment (Propulsion): Electric Vehicles (xx% market share in 2024).
- Key Drivers (Electric Vehicles): Environmental concerns and cost-effectiveness.
Global Autonomous Taxi Industry Product Landscape
Autonomous taxi products are evolving rapidly, with a focus on improving safety, reliability, and user experience. Key innovations include advanced sensor fusion techniques, enhanced AI algorithms for navigation and decision-making, and improved passenger comfort features. The unique selling propositions often include increased safety, reduced travel times, and cost-effectiveness compared to traditional taxi services. Technological advancements are constantly pushing boundaries, ensuring a dynamic and competitive product landscape.
Key Drivers, Barriers & Challenges in Global Autonomous Taxi Industry
Key Drivers: Technological advancements in AI, sensor technology, and mapping are primary drivers. Government support and investment in infrastructure also play a significant role. Furthermore, growing consumer demand for convenient, on-demand mobility fuels market expansion.
Challenges and Restraints: High initial investment costs, complex regulatory frameworks, safety concerns, and the need for robust infrastructure pose significant challenges. Cybersecurity risks and potential job displacement are also areas of concern. The impact of these challenges is estimated to be xx million units in lost potential revenue annually.
Emerging Opportunities in Global Autonomous Taxi Industry
Untapped markets in developing economies and expansion into niche applications (e.g., last-mile delivery, airport transfers) present considerable opportunities. Integration with smart city initiatives and the development of innovative business models (e.g., subscription services) are also emerging trends. Evolving consumer preferences toward personalized and sustainable transportation further broaden opportunities.
Growth Accelerators in the Global Autonomous Taxi Industry Industry
Technological breakthroughs, strategic partnerships, and market expansion strategies are crucial growth accelerators. The development of more robust and reliable autonomous driving systems, combined with collaborations between technology companies and automotive manufacturers, will accelerate market adoption. Expanding into new geographical markets and diversifying service offerings will further stimulate growth.
Key Players Shaping the Global Autonomous Taxi Industry Market
- Baidu Inc
- Didi Chuxing Technology Co
- Uber Technologies Inc
- MOIA
- AutoX Inc
- GM Cruise
- Tesla Inc
- Waymo LLC
- APTIV PLC
- EasyMile
- NAVYA SA
- AB Volvo
- ZF Friedrichshafen AG
Notable Milestones in Global Autonomous Taxi Industry Sector
- August 2022: Waymo LLC introduced new features to improve accessibility for passengers with disabilities.
- December 2021: AutoX Inc. opened a production facility in China for Level 4 RoboTaxis.
- May 2021: Agro AI introduced a new high-resolution LiDAR sensor with extended range. (Note: Agro AI is not listed as a key player in the provided list. This milestone is included as requested, but its relevance to the primary market players should be considered.)
In-Depth Global Autonomous Taxi Industry Market Outlook
The future of the autonomous taxi industry is bright, with significant growth potential driven by continuous technological advancements, increasing consumer acceptance, and supportive government policies. Strategic partnerships and market expansion into new geographical areas and applications will be critical for success. The market is expected to reach xx million units by 2033, creating lucrative opportunities for both established players and emerging startups.
Global Autonomous Taxi Industry Segmentation
-
1. Level of Autonomy
- 1.1. Level 4
- 1.2. Level 5
-
2. Propulsion
- 2.1. Electric Vehicles
- 2.2. Hybrid Vehicles
- 2.3. Fuel Cell Electric Vehicles
-
3. Vehicle
- 3.1. Car
- 3.2. Van/Shuttle
-
4. Application
- 4.1. Passenger Transportation
- 4.2. Goods Transportation
-
5. Service Type
- 5.1. Rental-Based
- 5.2. Station-Based
Global Autonomous Taxi Industry Segmentation By Geography
-
1. North America
- 1.1. United States
- 1.2. Canada
- 1.3. Rest of North America
-
2. Europe
- 2.1. Germany
- 2.2. United Kingdom
- 2.3. France
- 2.4. Italy
- 2.5. Spain
- 2.6. Rest of Europe
-
3. Asia Pacific
- 3.1. China
- 3.2. Japan
- 3.3. India
- 3.4. Rest of Asia Pacific
-
4. Rest of the World
- 4.1. South America
- 4.2. Middle East and Africa
Global Autonomous Taxi Industry Regional Market Share
Geographic Coverage of Global Autonomous Taxi Industry
Global Autonomous Taxi Industry REPORT HIGHLIGHTS
| Aspects | Details |
|---|---|
| Study Period | 2020-2034 |
| Base Year | 2025 |
| Estimated Year | 2026 |
| Forecast Period | 2026-2034 |
| Historical Period | 2020-2025 |
| Growth Rate | CAGR of 99.1% from 2020-2034 |
| Segmentation |
|
Table of Contents
- 1. Introduction
- 1.1. Research Scope
- 1.2. Market Segmentation
- 1.3. Research Objective
- 1.4. Definitions and Assumptions
- 2. Executive Summary
- 2.1. Market Snapshot
- 3. Market Dynamics
- 3.1. Market Drivers
- 3.2. Market Restrains
- 3.3. Market Trends
- 3.4. Market Opportunities
- 4. Market Factor Analysis
- 4.1. Porters Five Forces
- 4.1.1. Bargaining Power of Suppliers
- 4.1.2. Bargaining Power of Buyers
- 4.1.3. Threat of New Entrants
- 4.1.4. Threat of Substitutes
- 4.1.5. Competitive Rivalry
- 4.2. PESTEL analysis
- 4.3. BCG Analysis
- 4.3.1. Stars (High Growth, High Market Share)
- 4.3.2. Cash Cows (Low Growth, High Market Share)
- 4.3.3. Question Mark (High Growth, Low Market Share)
- 4.3.4. Dogs (Low Growth, Low Market Share)
- 4.4. Ansoff Matrix Analysis
- 4.5. Supply Chain Analysis
- 4.6. Regulatory Landscape
- 4.7. Current Market Potential and Opportunity Assessment (TAM–SAM–SOM Framework)
- 4.8. IMR Analyst Note
- 4.1. Porters Five Forces
- 5. Market Analysis, Insights and Forecast 2021-2033
- 5.1. Market Analysis, Insights and Forecast - by Level of Autonomy
- 5.1.1. Level 4
- 5.1.2. Level 5
- 5.2. Market Analysis, Insights and Forecast - by Propulsion
- 5.2.1. Electric Vehicles
- 5.2.2. Hybrid Vehicles
- 5.2.3. Fuel Cell Electric Vehicles
- 5.3. Market Analysis, Insights and Forecast - by Vehicle
- 5.3.1. Car
- 5.3.2. Van/Shuttle
- 5.4. Market Analysis, Insights and Forecast - by Application
- 5.4.1. Passenger Transportation
- 5.4.2. Goods Transportation
- 5.5. Market Analysis, Insights and Forecast - by Service Type
- 5.5.1. Rental-Based
- 5.5.2. Station-Based
- 5.6. Market Analysis, Insights and Forecast - by Region
- 5.6.1. North America
- 5.6.2. Europe
- 5.6.3. Asia Pacific
- 5.6.4. Rest of the World
- 5.1. Market Analysis, Insights and Forecast - by Level of Autonomy
- 6. Global Autonomous Taxi Industry Analysis, Insights and Forecast, 2021-2033
- 6.1. Market Analysis, Insights and Forecast - by Level of Autonomy
- 6.1.1. Level 4
- 6.1.2. Level 5
- 6.2. Market Analysis, Insights and Forecast - by Propulsion
- 6.2.1. Electric Vehicles
- 6.2.2. Hybrid Vehicles
- 6.2.3. Fuel Cell Electric Vehicles
- 6.3. Market Analysis, Insights and Forecast - by Vehicle
- 6.3.1. Car
- 6.3.2. Van/Shuttle
- 6.4. Market Analysis, Insights and Forecast - by Application
- 6.4.1. Passenger Transportation
- 6.4.2. Goods Transportation
- 6.5. Market Analysis, Insights and Forecast - by Service Type
- 6.5.1. Rental-Based
- 6.5.2. Station-Based
- 6.1. Market Analysis, Insights and Forecast - by Level of Autonomy
- 7. North America Global Autonomous Taxi Industry Analysis, Insights and Forecast, 2020-2032
- 7.1. Market Analysis, Insights and Forecast - by Level of Autonomy
- 7.1.1. Level 4
- 7.1.2. Level 5
- 7.2. Market Analysis, Insights and Forecast - by Propulsion
- 7.2.1. Electric Vehicles
- 7.2.2. Hybrid Vehicles
- 7.2.3. Fuel Cell Electric Vehicles
- 7.3. Market Analysis, Insights and Forecast - by Vehicle
- 7.3.1. Car
- 7.3.2. Van/Shuttle
- 7.4. Market Analysis, Insights and Forecast - by Application
- 7.4.1. Passenger Transportation
- 7.4.2. Goods Transportation
- 7.5. Market Analysis, Insights and Forecast - by Service Type
- 7.5.1. Rental-Based
- 7.5.2. Station-Based
- 7.1. Market Analysis, Insights and Forecast - by Level of Autonomy
- 8. Europe Global Autonomous Taxi Industry Analysis, Insights and Forecast, 2020-2032
- 8.1. Market Analysis, Insights and Forecast - by Level of Autonomy
- 8.1.1. Level 4
- 8.1.2. Level 5
- 8.2. Market Analysis, Insights and Forecast - by Propulsion
- 8.2.1. Electric Vehicles
- 8.2.2. Hybrid Vehicles
- 8.2.3. Fuel Cell Electric Vehicles
- 8.3. Market Analysis, Insights and Forecast - by Vehicle
- 8.3.1. Car
- 8.3.2. Van/Shuttle
- 8.4. Market Analysis, Insights and Forecast - by Application
- 8.4.1. Passenger Transportation
- 8.4.2. Goods Transportation
- 8.5. Market Analysis, Insights and Forecast - by Service Type
- 8.5.1. Rental-Based
- 8.5.2. Station-Based
- 8.1. Market Analysis, Insights and Forecast - by Level of Autonomy
- 9. Asia Pacific Global Autonomous Taxi Industry Analysis, Insights and Forecast, 2020-2032
- 9.1. Market Analysis, Insights and Forecast - by Level of Autonomy
- 9.1.1. Level 4
- 9.1.2. Level 5
- 9.2. Market Analysis, Insights and Forecast - by Propulsion
- 9.2.1. Electric Vehicles
- 9.2.2. Hybrid Vehicles
- 9.2.3. Fuel Cell Electric Vehicles
- 9.3. Market Analysis, Insights and Forecast - by Vehicle
- 9.3.1. Car
- 9.3.2. Van/Shuttle
- 9.4. Market Analysis, Insights and Forecast - by Application
- 9.4.1. Passenger Transportation
- 9.4.2. Goods Transportation
- 9.5. Market Analysis, Insights and Forecast - by Service Type
- 9.5.1. Rental-Based
- 9.5.2. Station-Based
- 9.1. Market Analysis, Insights and Forecast - by Level of Autonomy
- 10. Rest of the World Global Autonomous Taxi Industry Analysis, Insights and Forecast, 2020-2032
- 10.1. Market Analysis, Insights and Forecast - by Level of Autonomy
- 10.1.1. Level 4
- 10.1.2. Level 5
- 10.2. Market Analysis, Insights and Forecast - by Propulsion
- 10.2.1. Electric Vehicles
- 10.2.2. Hybrid Vehicles
- 10.2.3. Fuel Cell Electric Vehicles
- 10.3. Market Analysis, Insights and Forecast - by Vehicle
- 10.3.1. Car
- 10.3.2. Van/Shuttle
- 10.4. Market Analysis, Insights and Forecast - by Application
- 10.4.1. Passenger Transportation
- 10.4.2. Goods Transportation
- 10.5. Market Analysis, Insights and Forecast - by Service Type
- 10.5.1. Rental-Based
- 10.5.2. Station-Based
- 10.1. Market Analysis, Insights and Forecast - by Level of Autonomy
- 11. Competitive Analysis
- 11.1. Company Profiles
- 11.1.1 Baidu Inc
- 11.1.1.1. Company Overview
- 11.1.1.2. Products
- 11.1.1.3. Company Financials
- 11.1.1.4. SWOT Analysis
- 11.1.2 Didi Chuxing Technology Co
- 11.1.2.1. Company Overview
- 11.1.2.2. Products
- 11.1.2.3. Company Financials
- 11.1.2.4. SWOT Analysis
- 11.1.3 Uber Technologies Inc
- 11.1.3.1. Company Overview
- 11.1.3.2. Products
- 11.1.3.3. Company Financials
- 11.1.3.4. SWOT Analysis
- 11.1.4 MOIA
- 11.1.4.1. Company Overview
- 11.1.4.2. Products
- 11.1.4.3. Company Financials
- 11.1.4.4. SWOT Analysis
- 11.1.5 AutoX Inc
- 11.1.5.1. Company Overview
- 11.1.5.2. Products
- 11.1.5.3. Company Financials
- 11.1.5.4. SWOT Analysis
- 11.1.6 GM Cruise
- 11.1.6.1. Company Overview
- 11.1.6.2. Products
- 11.1.6.3. Company Financials
- 11.1.6.4. SWOT Analysis
- 11.1.7 Tesla Inc *List Not Exhaustive
- 11.1.7.1. Company Overview
- 11.1.7.2. Products
- 11.1.7.3. Company Financials
- 11.1.7.4. SWOT Analysis
- 11.1.8 Waymo LLC
- 11.1.8.1. Company Overview
- 11.1.8.2. Products
- 11.1.8.3. Company Financials
- 11.1.8.4. SWOT Analysis
- 11.1.9 APTIV PLC
- 11.1.9.1. Company Overview
- 11.1.9.2. Products
- 11.1.9.3. Company Financials
- 11.1.9.4. SWOT Analysis
- 11.1.10 EasyMile
- 11.1.10.1. Company Overview
- 11.1.10.2. Products
- 11.1.10.3. Company Financials
- 11.1.10.4. SWOT Analysis
- 11.1.11 NAVYA SA
- 11.1.11.1. Company Overview
- 11.1.11.2. Products
- 11.1.11.3. Company Financials
- 11.1.11.4. SWOT Analysis
- 11.1.12 AB Volvo
- 11.1.12.1. Company Overview
- 11.1.12.2. Products
- 11.1.12.3. Company Financials
- 11.1.12.4. SWOT Analysis
- 11.1.13 ZF Friedrichshafen AG
- 11.1.13.1. Company Overview
- 11.1.13.2. Products
- 11.1.13.3. Company Financials
- 11.1.13.4. SWOT Analysis
- 11.1.1 Baidu Inc
- 11.2. Market Entropy
- 11.2.1 Company's Key Areas Served
- 11.2.2 Recent Developments
- 11.3. Company Market Share Analysis 2025
- 11.3.1 Top 5 Companies Market Share Analysis
- 11.3.2 Top 3 Companies Market Share Analysis
- 11.4. List of Potential Customers
- 12. Research Methodology
List of Figures
- Figure 1: Global Global Autonomous Taxi Industry Revenue Breakdown (billion, %) by Region 2025 & 2033
- Figure 2: North America Global Autonomous Taxi Industry Revenue (billion), by Level of Autonomy 2025 & 2033
- Figure 3: North America Global Autonomous Taxi Industry Revenue Share (%), by Level of Autonomy 2025 & 2033
- Figure 4: North America Global Autonomous Taxi Industry Revenue (billion), by Propulsion 2025 & 2033
- Figure 5: North America Global Autonomous Taxi Industry Revenue Share (%), by Propulsion 2025 & 2033
- Figure 6: North America Global Autonomous Taxi Industry Revenue (billion), by Vehicle 2025 & 2033
- Figure 7: North America Global Autonomous Taxi Industry Revenue Share (%), by Vehicle 2025 & 2033
- Figure 8: North America Global Autonomous Taxi Industry Revenue (billion), by Application 2025 & 2033
- Figure 9: North America Global Autonomous Taxi Industry Revenue Share (%), by Application 2025 & 2033
- Figure 10: North America Global Autonomous Taxi Industry Revenue (billion), by Service Type 2025 & 2033
- Figure 11: North America Global Autonomous Taxi Industry Revenue Share (%), by Service Type 2025 & 2033
- Figure 12: North America Global Autonomous Taxi Industry Revenue (billion), by Country 2025 & 2033
- Figure 13: North America Global Autonomous Taxi Industry Revenue Share (%), by Country 2025 & 2033
- Figure 14: Europe Global Autonomous Taxi Industry Revenue (billion), by Level of Autonomy 2025 & 2033
- Figure 15: Europe Global Autonomous Taxi Industry Revenue Share (%), by Level of Autonomy 2025 & 2033
- Figure 16: Europe Global Autonomous Taxi Industry Revenue (billion), by Propulsion 2025 & 2033
- Figure 17: Europe Global Autonomous Taxi Industry Revenue Share (%), by Propulsion 2025 & 2033
- Figure 18: Europe Global Autonomous Taxi Industry Revenue (billion), by Vehicle 2025 & 2033
- Figure 19: Europe Global Autonomous Taxi Industry Revenue Share (%), by Vehicle 2025 & 2033
- Figure 20: Europe Global Autonomous Taxi Industry Revenue (billion), by Application 2025 & 2033
- Figure 21: Europe Global Autonomous Taxi Industry Revenue Share (%), by Application 2025 & 2033
- Figure 22: Europe Global Autonomous Taxi Industry Revenue (billion), by Service Type 2025 & 2033
- Figure 23: Europe Global Autonomous Taxi Industry Revenue Share (%), by Service Type 2025 & 2033
- Figure 24: Europe Global Autonomous Taxi Industry Revenue (billion), by Country 2025 & 2033
- Figure 25: Europe Global Autonomous Taxi Industry Revenue Share (%), by Country 2025 & 2033
- Figure 26: Asia Pacific Global Autonomous Taxi Industry Revenue (billion), by Level of Autonomy 2025 & 2033
- Figure 27: Asia Pacific Global Autonomous Taxi Industry Revenue Share (%), by Level of Autonomy 2025 & 2033
- Figure 28: Asia Pacific Global Autonomous Taxi Industry Revenue (billion), by Propulsion 2025 & 2033
- Figure 29: Asia Pacific Global Autonomous Taxi Industry Revenue Share (%), by Propulsion 2025 & 2033
- Figure 30: Asia Pacific Global Autonomous Taxi Industry Revenue (billion), by Vehicle 2025 & 2033
- Figure 31: Asia Pacific Global Autonomous Taxi Industry Revenue Share (%), by Vehicle 2025 & 2033
- Figure 32: Asia Pacific Global Autonomous Taxi Industry Revenue (billion), by Application 2025 & 2033
- Figure 33: Asia Pacific Global Autonomous Taxi Industry Revenue Share (%), by Application 2025 & 2033
- Figure 34: Asia Pacific Global Autonomous Taxi Industry Revenue (billion), by Service Type 2025 & 2033
- Figure 35: Asia Pacific Global Autonomous Taxi Industry Revenue Share (%), by Service Type 2025 & 2033
- Figure 36: Asia Pacific Global Autonomous Taxi Industry Revenue (billion), by Country 2025 & 2033
- Figure 37: Asia Pacific Global Autonomous Taxi Industry Revenue Share (%), by Country 2025 & 2033
- Figure 38: Rest of the World Global Autonomous Taxi Industry Revenue (billion), by Level of Autonomy 2025 & 2033
- Figure 39: Rest of the World Global Autonomous Taxi Industry Revenue Share (%), by Level of Autonomy 2025 & 2033
- Figure 40: Rest of the World Global Autonomous Taxi Industry Revenue (billion), by Propulsion 2025 & 2033
- Figure 41: Rest of the World Global Autonomous Taxi Industry Revenue Share (%), by Propulsion 2025 & 2033
- Figure 42: Rest of the World Global Autonomous Taxi Industry Revenue (billion), by Vehicle 2025 & 2033
- Figure 43: Rest of the World Global Autonomous Taxi Industry Revenue Share (%), by Vehicle 2025 & 2033
- Figure 44: Rest of the World Global Autonomous Taxi Industry Revenue (billion), by Application 2025 & 2033
- Figure 45: Rest of the World Global Autonomous Taxi Industry Revenue Share (%), by Application 2025 & 2033
- Figure 46: Rest of the World Global Autonomous Taxi Industry Revenue (billion), by Service Type 2025 & 2033
- Figure 47: Rest of the World Global Autonomous Taxi Industry Revenue Share (%), by Service Type 2025 & 2033
- Figure 48: Rest of the World Global Autonomous Taxi Industry Revenue (billion), by Country 2025 & 2033
- Figure 49: Rest of the World Global Autonomous Taxi Industry Revenue Share (%), by Country 2025 & 2033
List of Tables
- Table 1: Global Autonomous Taxi Industry Revenue billion Forecast, by Level of Autonomy 2020 & 2033
- Table 2: Global Autonomous Taxi Industry Revenue billion Forecast, by Propulsion 2020 & 2033
- Table 3: Global Autonomous Taxi Industry Revenue billion Forecast, by Vehicle 2020 & 2033
- Table 4: Global Autonomous Taxi Industry Revenue billion Forecast, by Application 2020 & 2033
- Table 5: Global Autonomous Taxi Industry Revenue billion Forecast, by Service Type 2020 & 2033
- Table 6: Global Autonomous Taxi Industry Revenue billion Forecast, by Region 2020 & 2033
- Table 7: Global Autonomous Taxi Industry Revenue billion Forecast, by Level of Autonomy 2020 & 2033
- Table 8: Global Autonomous Taxi Industry Revenue billion Forecast, by Propulsion 2020 & 2033
- Table 9: Global Autonomous Taxi Industry Revenue billion Forecast, by Vehicle 2020 & 2033
- Table 10: Global Autonomous Taxi Industry Revenue billion Forecast, by Application 2020 & 2033
- Table 11: Global Autonomous Taxi Industry Revenue billion Forecast, by Service Type 2020 & 2033
- Table 12: Global Autonomous Taxi Industry Revenue billion Forecast, by Country 2020 & 2033
- Table 13: United States Global Autonomous Taxi Industry Revenue (billion) Forecast, by Application 2020 & 2033
- Table 14: Canada Global Autonomous Taxi Industry Revenue (billion) Forecast, by Application 2020 & 2033
- Table 15: Rest of North America Global Autonomous Taxi Industry Revenue (billion) Forecast, by Application 2020 & 2033
- Table 16: Global Autonomous Taxi Industry Revenue billion Forecast, by Level of Autonomy 2020 & 2033
- Table 17: Global Autonomous Taxi Industry Revenue billion Forecast, by Propulsion 2020 & 2033
- Table 18: Global Autonomous Taxi Industry Revenue billion Forecast, by Vehicle 2020 & 2033
- Table 19: Global Autonomous Taxi Industry Revenue billion Forecast, by Application 2020 & 2033
- Table 20: Global Autonomous Taxi Industry Revenue billion Forecast, by Service Type 2020 & 2033
- Table 21: Global Autonomous Taxi Industry Revenue billion Forecast, by Country 2020 & 2033
- Table 22: Germany Global Autonomous Taxi Industry Revenue (billion) Forecast, by Application 2020 & 2033
- Table 23: United Kingdom Global Autonomous Taxi Industry Revenue (billion) Forecast, by Application 2020 & 2033
- Table 24: France Global Autonomous Taxi Industry Revenue (billion) Forecast, by Application 2020 & 2033
- Table 25: Italy Global Autonomous Taxi Industry Revenue (billion) Forecast, by Application 2020 & 2033
- Table 26: Spain Global Autonomous Taxi Industry Revenue (billion) Forecast, by Application 2020 & 2033
- Table 27: Rest of Europe Global Autonomous Taxi Industry Revenue (billion) Forecast, by Application 2020 & 2033
- Table 28: Global Autonomous Taxi Industry Revenue billion Forecast, by Level of Autonomy 2020 & 2033
- Table 29: Global Autonomous Taxi Industry Revenue billion Forecast, by Propulsion 2020 & 2033
- Table 30: Global Autonomous Taxi Industry Revenue billion Forecast, by Vehicle 2020 & 2033
- Table 31: Global Autonomous Taxi Industry Revenue billion Forecast, by Application 2020 & 2033
- Table 32: Global Autonomous Taxi Industry Revenue billion Forecast, by Service Type 2020 & 2033
- Table 33: Global Autonomous Taxi Industry Revenue billion Forecast, by Country 2020 & 2033
- Table 34: China Global Autonomous Taxi Industry Revenue (billion) Forecast, by Application 2020 & 2033
- Table 35: Japan Global Autonomous Taxi Industry Revenue (billion) Forecast, by Application 2020 & 2033
- Table 36: India Global Autonomous Taxi Industry Revenue (billion) Forecast, by Application 2020 & 2033
- Table 37: Rest of Asia Pacific Global Autonomous Taxi Industry Revenue (billion) Forecast, by Application 2020 & 2033
- Table 38: Global Autonomous Taxi Industry Revenue billion Forecast, by Level of Autonomy 2020 & 2033
- Table 39: Global Autonomous Taxi Industry Revenue billion Forecast, by Propulsion 2020 & 2033
- Table 40: Global Autonomous Taxi Industry Revenue billion Forecast, by Vehicle 2020 & 2033
- Table 41: Global Autonomous Taxi Industry Revenue billion Forecast, by Application 2020 & 2033
- Table 42: Global Autonomous Taxi Industry Revenue billion Forecast, by Service Type 2020 & 2033
- Table 43: Global Autonomous Taxi Industry Revenue billion Forecast, by Country 2020 & 2033
- Table 44: South America Global Autonomous Taxi Industry Revenue (billion) Forecast, by Application 2020 & 2033
- Table 45: Middle East and Africa Global Autonomous Taxi Industry Revenue (billion) Forecast, by Application 2020 & 2033
Frequently Asked Questions
1. What is the projected Compound Annual Growth Rate (CAGR) of the Global Autonomous Taxi Industry?
The projected CAGR is approximately 99.1%.
2. Which companies are prominent players in the Global Autonomous Taxi Industry?
Key companies in the market include Baidu Inc, Didi Chuxing Technology Co, Uber Technologies Inc, MOIA, AutoX Inc, GM Cruise, Tesla Inc *List Not Exhaustive, Waymo LLC, APTIV PLC, EasyMile, NAVYA SA, AB Volvo, ZF Friedrichshafen AG.
3. What are the main segments of the Global Autonomous Taxi Industry?
The market segments include Level of Autonomy, Propulsion, Vehicle, Application, Service Type.
4. Can you provide details about the market size?
The market size is estimated to be USD 0.61 billion as of 2022.
5. What are some drivers contributing to market growth?
Increase in Leisure Activities in the Country.
6. What are the notable trends driving market growth?
Robo-Taxis Are Attracting People Around the World.
7. Are there any restraints impacting market growth?
Strict Vehicle Emission Regulations.
8. Can you provide examples of recent developments in the market?
In August 2022, Waymo LLC introduced new features designed to make its fleet of autonomous taxis more accessible to passengers with visual impairments and other disabilities.
9. What pricing options are available for accessing the report?
Pricing options include single-user, multi-user, and enterprise licenses priced at USD 4750, USD 5250, and USD 8750 respectively.
10. Is the market size provided in terms of value or volume?
The market size is provided in terms of value, measured in billion.
11. Are there any specific market keywords associated with the report?
Yes, the market keyword associated with the report is "Global Autonomous Taxi Industry," which aids in identifying and referencing the specific market segment covered.
12. How do I determine which pricing option suits my needs best?
The pricing options vary based on user requirements and access needs. Individual users may opt for single-user licenses, while businesses requiring broader access may choose multi-user or enterprise licenses for cost-effective access to the report.
13. Are there any additional resources or data provided in the Global Autonomous Taxi Industry report?
While the report offers comprehensive insights, it's advisable to review the specific contents or supplementary materials provided to ascertain if additional resources or data are available.
14. How can I stay updated on further developments or reports in the Global Autonomous Taxi Industry?
To stay informed about further developments, trends, and reports in the Global Autonomous Taxi Industry, consider subscribing to industry newsletters, following relevant companies and organizations, or regularly checking reputable industry news sources and publications.
Methodology
Step 1 - Identification of Relevant Samples Size from Population Database


Step 2 - Approaches for Defining Global Market Size (Value, Volume* & Price*)

Note*: In applicable scenarios
Step 3 - Data Sources
Primary Research
- Web Analytics
- Survey Reports
- Research Institute
- Latest Research Reports
- Opinion Leaders
Secondary Research
- Annual Reports
- White Paper
- Latest Press Release
- Industry Association
- Paid Database
- Investor Presentations

Step 4 - Data Triangulation
Involves using different sources of information in order to increase the validity of a study
These sources are likely to be stakeholders in a program - participants, other researchers, program staff, other community members, and so on.
Then we put all data in single framework & apply various statistical tools to find out the dynamic on the market.
During the analysis stage, feedback from the stakeholder groups would be compared to determine areas of agreement as well as areas of divergence